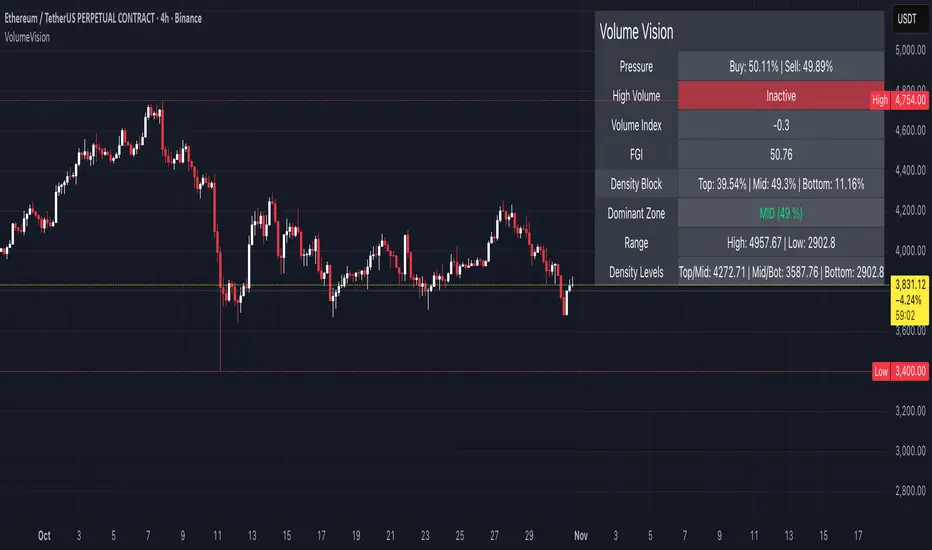
Volume VisionVolume Vision is a precision volume-analysis system that exposes how trading activity is distributed inside the current market range.
It divides the active price structure into three live zones — Top, Middle, and Bottom — and measures where real participation is concentrated.
This creates a dynamic “volume map” that allows you to instantly see whether the market is being driven by accumulation, distribution, or equilibrium.
At the heart of the indicator is a fully original implementation of the FGI — a proprietary composite metric designed to read market emotion and internal pressure.
It transforms several hidden components — volume, volatility, dominance, and directional momentum — into one unified curve of sentiment.
FGI values around 30 typically reflect phases of fear, capitulation, and potential accumulation.
Values near 80 mark conditions of greed, overextension, and possible distribution.
Observing these boundaries helps detect when the market is preparing to shift from compression to expansion or from euphoria to cooling.
Core Functions
Density Zones: Splits recent price movement into Top / Mid / Bottom areas, quantifying volume within each.
Dominant Zone: Highlights where the major share of liquidity currently resides.
Pressure Meter: Shows the balance between buy and sell volume in real time.
Volume Index: Normalizes present volume activity against its historical range to spot abnormal behaviour.
FGI Reading: Custom sentiment curve ranging from fear (≈ 30) to greed (≈ 80).
Alerts: Optional signals for High Volume and Rising Volume moments.
Dashboard: Compact on-chart table that summarizes all key readings without cluttering the view.
Interpretation Guide
When FGI drops near 30, the market often forms accumulation bases or bottom structures.
When FGI climbs toward 80, momentum usually reaches its limit and profit-taking or distribution begins.
A dominant Top zone with strong sell pressure indicates distribution, while Bottom dominance with buy pressure suggests accumulation.
Mid-zone dominance with neutral FGI reflects balance — a state of indecision before the next move.
Watch for volume spikes accompanied by FGI shifts: these often precede major impulse starts or ends.
Style: non-repainting core, minimal visuals, real-time clarity.
Created for traders who need to see where the energy is flowing, not just what price is printing.
by MahaTrend
Cari dalam skrip untuk "volume"
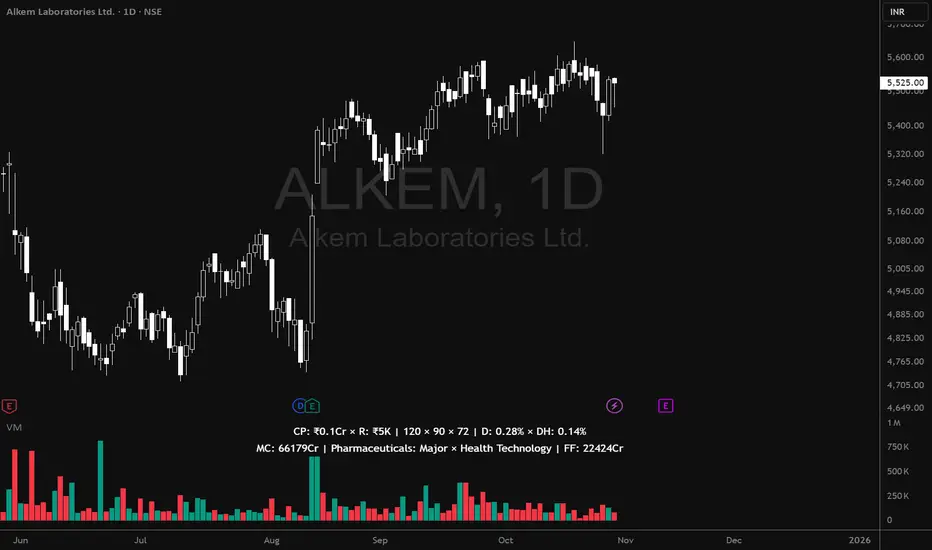
Volume MatrixVolume Matrix (VM) is a comprehensive volume and position-sizing toolkit designed to help traders interpret market participation and manage trade risk efficiently.
It combines volume analytics, risk-adjusted position sizing, and stock-specific financial data — all in a clear, visual, and automated format directly on TradingView charts.
The indicator integrates capital management, episodic volume spikes, and market capitalization data into a single, intuitive framework, giving traders an edge in both decision-making and discipline.
⚙️ Core Components & Features
🧩 1. Position Sizing & Risk Management
A dynamic risk table helps traders determine how much to trade and how much to risk per position, adapting automatically based on user inputs:
- Capital (CP): Total account size (₹ or $).
- Risk Mode (R): Choose between Percentage of capital or fixed Currency value.
- Lot Size Mode: Optional toggle to align quantities with F&O lot sizes (India-based).
- Standard Stop-Loss (SSL): Displays position quantities for three custom stop-loss levels (e.g., 0.75%, 1%, 1.25%).
- % Distance Metrics: D: Distance from day’s low/high (helps assess stop distance). DH: Distance from mid-body (useful for candle risk assessment). Auto-adjusts based on whether the trader is in Long, Short, or Both mode.
📈 Helps answer:
“How much quantity should I trade at my desired risk level?”
🔶 2. Volume Visualization
- Plots volume bars with default up/down coloring.
- Green for bullish bars.
- Red for bearish bars.
- Designed for quick visual differentiation of buying/selling pressure.
🚀 3. Episodic Pivot (EP) Detector
Identifies high-volume breakout or capitulation days, often marking significant turning points or trend initiations.
- Highlights bars where volume exceeds a custom threshold (in millions).
- Marks them visually with an orange triangle under the candle.
-Best used on daily charts to spot institutional footprints.
📊 Helps answer:
“Is today’s volume large enough to signal major institutional activity?”
🧾 4. Data Metrics Table
Displays fundamental and contextual data about the asset:
- Market Capitalization (MC): Auto-calculated using outstanding shares × price.
- Free Float (FF): Value of tradable shares in currency or Cr (INR).
- Industry × Sector × F&O Status: Shows the company’s industry and sector classification. Displays FC (Futures Contract) or NFC (Non-F&O stock).
- Customizable appearance: Choose between text/value display, text color, and background color. Flexible positioning and size control to suit any chart layout.
📚 Helps answer:
“What type of stock is this, how big is it, and does it trade in futures?”
🪄 5. User Interface Customization
- Modular UI grouped by functionality (Risk, Direction, Metrics, Volume, etc.).
- Flexible table position & size (Top/Bottom/Middle & Tiny–Huge).
- All elements are toggleable, giving full control over displayed data.
- Built to ensure visual clarity on any chart background.
| Trading Goal | How Volume Matrix Supports It |
| ------------------------------ | -------------------------------------------------------------- |
| **Risk Management** | Calculates optimal trade size and risk exposure automatically. |
| **Position Sizing Discipline** | Enforces consistent sizing across trades using SSL levels. |
| **Volume Confirmation** | Highlights institutional participation via Episodic Pivots. |
| **Stock Context Awareness** | Shows market cap, sector, and float value instantly. |
| **Efficiency** | Reduces manual work — no need for calculators or spreadsheets. |
💡 In Short
Volume Matrix simplifies trade planning, brings transparency to risk, and connects volume with context — all in one elegant visual tool.
Perfect for:
- Discretionary traders refining entries and sizing.
- Swing traders watching for volume-based pivots.
- Analysts who want price-volume fundamentals at a glance.
TR Volume Candles (Lite)Volume candles for your trading pleasure.
What it does
A lightweight recreation of Traders Reality’s “vector candle” coloring. It repaints the price candles (body, wick, and border) based on relative volume and spread×volume so you can spot high-activity bars at a glance—without the overhead of pivots, sessions, zones, or request.security calls.
Logic (matches TR)
Compute the average of the previous 10 bars’ volume (current bar excluded).
Compute volSpread = (high − low) × volume, and compare to the highest volSpread of the previous 10 bars (current bar excluded).
Color rules:
Green / Red (highest priority): volume ≥ 2× 10-bar average or volSpread ≥ highest of prior 10.
Blue / Violet: volume ≥ 1.5× 10-bar average (and not already green/red).
Regular: none of the above.
Colors (defaults align with TR)
Bull candles: Green (2× / spread×vol), Blue (1.5×), otherwise Light Gray.
Bear candles: Red (2× / spread×vol), Violet (1.5×), otherwise Dark Gray.
Why it’s fast
No external libraries, no symbol overrides, no multi-timeframe requests—just native series math on the current chart.
Inputs
Colors only (keep TR defaults or customize). Thresholds and lookback are fixed to TR standards to ensure identical behavior.
Alerts
“Any Vector Candle,” plus individual alerts for Green, Red, Blue, and Purple. For confirmed signals, set alert to Once per bar close.
Notes
Works on all timeframes.
Candle width is unchanged (uniform, as in your screenshot).
Heikin Ashi or other synthetic candle types will color based on those candles’ OHLC/volume; for strict equivalence, use standard candles.
Volume is exchange-feed dependent; anomalies (splits/halts) can spike the logic temporarily.
Use cases
Quickly highlight expansion bars that often precede/confirm momentum. Combine with your trend tools (EMAs, VWAP, MavilimW) or Darvas/box structures for context.

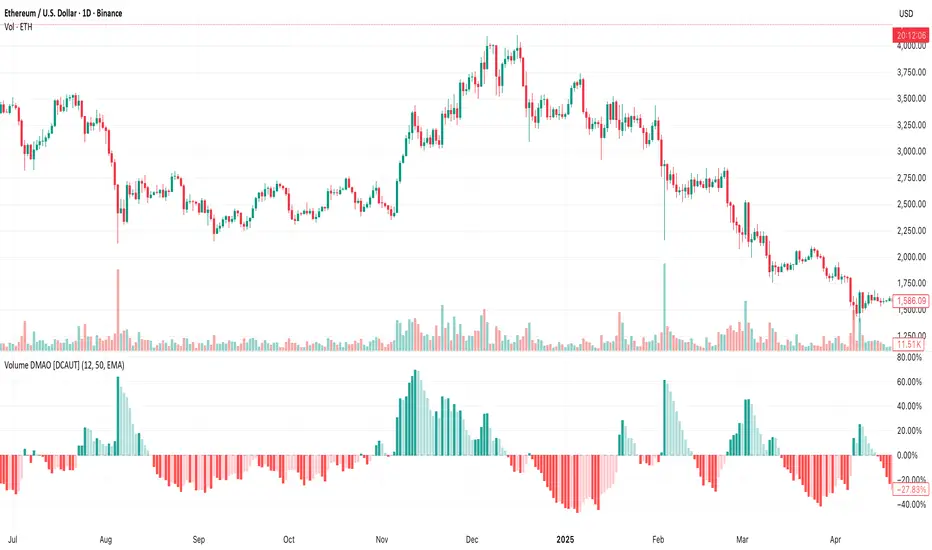
Volume DMAO [DCAUT]█ Volume DMAO Indicator
📊 OVERVIEW
The Volume DMAO (Dual Moving Average Oscillator) applies PPO-style calculation to volume data rather than price. It measures the percentage difference between fast and slow moving averages of volume, providing insights into volume momentum and market participation trends.
🎯 CONCEPTS
Signal Interpretation
Positive Values : Current volume above historical average (expansion phase)
Negative Values : Current volume below historical average (contraction phase)
Rising Trend : Volume momentum accelerating (increasing participation)
Falling Trend : Volume momentum decelerating (decreasing participation)
Primary Applications
Volume Confirmation : Validate price movements with volume momentum analysis
Divergence Detection : Spot potential reversals when volume diverges from price
Trend Strength : Assess volume participation in price trends
Entry/Exit Signals : Time trades based on volume momentum shifts
📋 PARAMETER SETUP
Input Parameters
Fast Length : Period for fast moving average (default: 12)
Slow Length : Period for slow moving average (default: 50)
MA Type : Moving average algorithm (default: EMA)
📊 COLOR CODING
Histogram Colors
Dark Green : Positive and rising (strong volume expansion)
Light Green : Positive and falling (weakening volume expansion)
Light Red : Negative and rising (recovering from volume contraction)
Dark Red : Negative and falling (strong volume contraction)
💡 CORE VALUE
Unlike traditional volume indicators, Volume DMAO provides normalized percentage readings that:
- Enable comparison across different timeframes and instruments
- Reveal volume momentum changes before price movements
- Identify market phases through volume participation analysis
VIM (Volume in Money)Volume in Money + MA (Short Numbers & Coloring)
This indicator visualizes the monetary volume traded in each candle, calculated as:
Money Volume
=
Volume
×
Close Price
Money Volume=Volume×Close Price
🔹 Features:
Plots bars representing the money volume (total traded value).
Coloring options:
• Prev Close → Green if the current close is higher than the previous close, Red if lower.
• Candle Direction → Green if the candle is bullish (close > open), Red if bearish (close < open).
Moving Average (default length: 14) applied on the money volume for trend analysis.
Axis values and labels displayed in a shortened format (K, M, B, T) for readability.
📊 This helps traders quickly identify whether large amounts of money flowed into or out of the asset, making it easier to detect unusual activity compared to regular volume indicators.

Volume Pulse [BreakoutOrFakeout]Volume Pulse
What It Is
A beautifully designed volume indicator that transforms standard volume bars into an intelligent, visually stunning analysis tool. It instantly highlights when "smart money" is moving and helps identify real breakouts from fakeouts.
What Makes It Special
Visual Intelligence: Uses gradient color technology that intensifies based on volume strength - weak volume appears transparent while strong volume pops with vibrant colors. You'll literally SEE the difference between retail and institutional activity.
Spike Detection: Automatically identifies and marks unusual volume surges with golden diamond markers - these often precede major price moves.
Dynamic Adaptation: The moving average line intelligently changes opacity based on current volume conditions, creating a living, breathing indicator that responds to market activity.
Real-Time Stats: Floating information panel shows current volume compared to average with percentage changes - no mental math required.
How to Use It
Color Intensity = Volume Strength
Faded bars = Weak volume (potential fakeout)
Solid bars = Strong volume (potential breakout)
Golden Diamonds = Pay Attention
Mark 2x average volume spikes
Often appear at reversal points or breakout confirmations
Blue Line Relationship
Volume above line = Increasing interest
Volume below line = Declining participation
Background Highlights
Subtle yellow glow on extreme volume days
Makes significant days impossible to miss
Perfect For
Confirming breakout validity
Spotting accumulation/distribution
Identifying climax tops/bottoms
Day trading volume patterns
Swing trading entry confirmation
Why Traders Love It
✓ Makes volume analysis actually enjoyable
✓ Clean design reduces chart clutter
✓ Works on all timeframes
✓ No complex settings to figure out
✓ Professional appearance impresses clients
The Bottom Line: It's "just" a volume indicator - but it makes every other volume indicator look outdated. The gradient effect alone will change how you view volume forever.
⚠️ For educational purposes only. Trading involves risk.

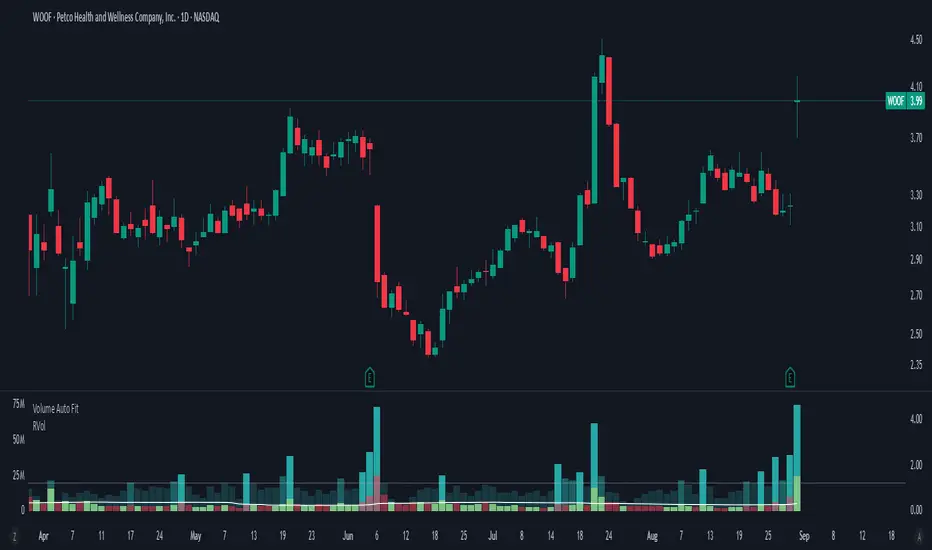
Volume Auto FitThis does nothing more than decreasing the size of (absolute) volume candles a bit, in order to allow showing candles with "Absolute" volume and Relative volume inside of the same panel - to save space.
I want to see both because:
Relative volume indicates higher activity than usual
Absolute volume helps with "Volume Price Analysis"
On the 5m you don't need "Volume Auto fit", but can just use usual "Volume" and it will look fine.
For the 1D I've created this one though, since RVol can be gigantic there sometimes.
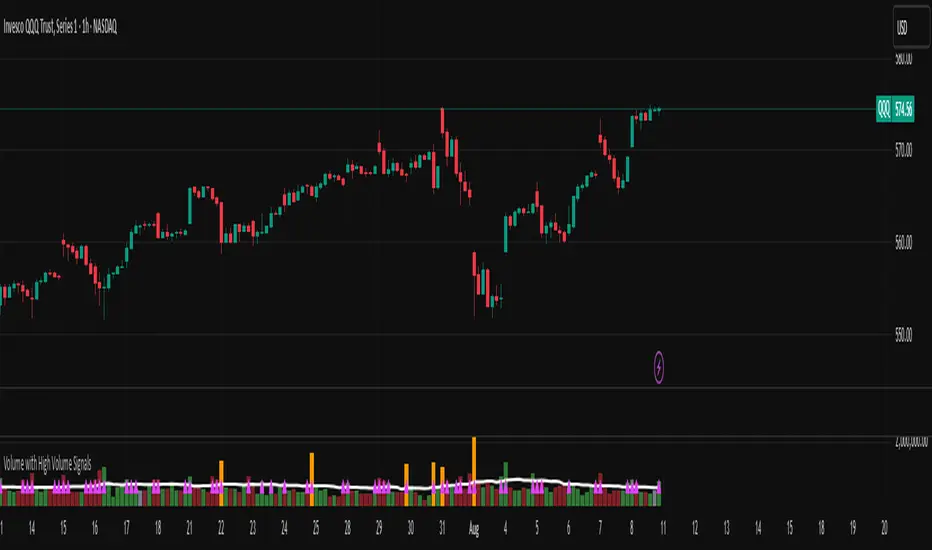
Volume with High Volume SignalsIndicator Description for Promotional Post (in English)
Unlock Market Insights with the "Volume with High Volume Signals" Indicator!
Are you ready to take your trading to the next level? The Volume with High Volume Signals indicator is your ultimate tool for spotting critical market movements driven by volume surges. Designed for traders who want clarity and precision, this Pine Script indicator combines powerful volume analysis with customizable features to help you stay ahead of the game.
Why Choose This Indicator?
Dynamic Volume Visualization: Watch volume bars come to life with customizable coloring. Choose to color bars based on candle direction (green for bullish, red for bearish) or use a neutral gray for a clean look.
High Volume Detection: Instantly spot significant volume spikes with our advanced highlighting feature. When volume exceeds twice the Simple Moving Average (SMA), bars are highlighted in a bold, customizable color (default: yellow) to signal potential breakout or reversal opportunities.
Dual Moving Averages: Track volume trends with both Simple Moving Average (SMA) and Exponential Moving Average (EMA). Fully customizable periods, colors, and line thickness let you tailor the indicator to your trading style.
Visual Alerts for Key Moments: When volume surges above both SMA and EMA, a vibrant fuchsia triangle appears above the bar, giving you an immediate visual cue for high-impact market activity.
User-Friendly Customization: Adjust every aspect of the indicator—toggle SMA/EMA visibility, set periods, choose colors, and fine-tune line thickness to match your preferences.
Perfect For:
Day traders looking for high-volume breakouts.
Swing traders identifying trend reversals.
Any trader who wants to harness volume as a leading indicator.
Why It’s a Must-Have:
Volume is the heartbeat of the market, and this indicator transforms raw data into actionable insights. Whether you're scalping, swing trading, or analyzing long-term trends, the Volume with High Volume Signals indicator empowers you to make informed decisions with confidence.
Get Started Today!
Add the Volume with High Volume Signals indicator to your TradingView arsenal and start decoding market moves like a pro. Don’t miss out on the edge that top traders rely on—grab this indicator now and elevate your trading strategy!
Volume Profile + VWAP + Long Wick StrategyVolume Profile + VWAP + Long Wick Strategy
This indicator combines Volume Profile (VP), VWAP (Volume Weighted Average Price) with deviation bands, and a long wick candle strategy to identify potential support/resistance zones and trading signals. It detects "power wicks" (long shadows with high volume near key levels like POC, VAH/VAL, or VWAP) as reversal setups, generating buy/sell alerts after confirmation wicks appear near these zones.
Key Features:
Volume Profile: Displays VP histogram over a lookback period, highlighting POC (Point of Control), VAH/VAL (Value Area High/Low) with customizable rows and thresholds.
VWAP & Bands: Plots VWAP with 1-3 std dev bands; filters signals based on trend and proximity to bands.
Long Wick Detection: Identifies strong ("power") and signal wicks based on wick/body ratios, ATR size, and volume multipliers. Supports Market Maker (MM) volume bonuses for liquidity zones.
Trading Signals: Generates BUY/SELL arrows when price retests wick levels with confirmation, limited by max signals per zone and min wait bars. Filtered by MTF (multi-timeframe) alignment (e.g., higher TF EMA trend and candle direction) and VWAP trend.
Sessions: Shows POC/VAH/VAL for Asian, London, and NY sessions with optional active-only display.
MTF Analysis: Scores bullish/bearish alignment across two higher timeframes for signal filtering.
Visuals: Liquidity sweep boxes, resistance/support lines, info table (levels, signals remaining, VWAP status), and MTF status box.
Customizable: Adjust wick ratios, volume thresholds, VP rows, MTF periods, and display options.
Ideal for intraday/scalping on forex/crypto/stocks. Use on lower TFs with MTF filters for confluence. Not financial advice—backtest thoroughly!

Volume FVG | Liquidity Gaps + (Z-Core Edition)📘 Indicator Description — Volume FVG Pro+
Volume FVG Pro+ is a technical analysis tool designed to automatically detect and visualize Fair Value Gaps (FVG) on the chart. It incorporates volume-based and ATR-based filtering to highlight only meaningful zones while reducing market noise.
⚙️ How It Works:
FVG Detection:
Identifies gaps between candles that may indicate institutional activity or imbalance.
Supports two types:
Regular FVG — all price gaps.
Volume FVG — gaps with abnormally high volume, calculated via Z-Score (relative to volume average).
ATR Filtering:
Filters out insignificant price gaps using Average True Range (ATR).
Helps show only zones with strong volatility behavior.
Mitigation Logic:
Zones are marked as mitigated (deactivated) when price retraces into them.
Mitigation can be detected by wick or close, with configurable depth percentage.
Zone Extension:
Active zones automatically extend forward until they are mitigated.
Display Options:
Fully customizable:
Bullish/Bearish coloring.
Opacity and box length.
Toggle labels and outlines.
🛠️ Settings Overview:
Z-Score Thresholds — for volume-based FVG detection.
ATR Multiplier — volatility sensitivity.
Mitigation Depth (%) — defines how deep price must retrace to deactivate a zone.
Display Options — full control over how zones appear on the chart.
📌 Why Use Volume FVG:
These gaps often represent footprints of large participants.
They are statistically more likely (15–20%) to hold price and act as reaction zones compared to regular FVGs (based on internal analysis).
Useful for identifying entry/exit areas and refining market structure analysis.
👤 Best For:
Smart Money / Order Flow / Liquidity-based traders.
Intraday and swing traders using price reaction and volume cues.
Anyone seeking clear and efficient FVG detection with filtering.

Volume-Confirmed Price Momentum# **Volume-Confirmed Price Momentum (VCPM) Indicator**
## **🔍 Overview**
Introducing the **Volume-Confirmed Price Momentum (VCPM)**, a sophisticated dual-metric indicator designed to identify high-probability momentum moves by analyzing the relationship between price action and volume dynamics. This indicator combines correlation analysis with volume strength validation to filter out weak signals and highlight institutional-backed movements.
---
## **⚙️ Core Mechanics**
**Price-Volume Correlation Engine:**
- Calculates real-time correlation between price movements and volume
- Configurable lookback period (default: 8 bars)
- Option to use price changes or absolute values
- Correlation range: -1.0 (perfect negative) to +1.0 (perfect positive)
**Volume Strength Analyzer:**
- Compares current volume against its moving average (default: 128 periods)
- Normalizes volume ratio to 0-1 scale for consistent interpretation
- Identifies when volume significantly exceeds historical norms
---
## **📊 Signal Generation**
### **🟢 Bullish Confirmation Signal**
**Trigger:** Positive correlation > 0.6 + Volume ratio > 0.5
- Price and volume moving in harmony upward
- Above-average volume confirms the move
- Indicates strong institutional buying interest
### **🔴 Bearish Confirmation Signal**
**Trigger:** Negative correlation < -0.6 + Volume ratio > 0.5
- Price declining with increasing volume
- Suggests distribution or institutional selling
- High-confidence bearish momentum
---
## **🎯 Trading Applications**
**Breakout Validation:**
Filter false breakouts by requiring volume confirmation before entering positions.
**Trend Continuation:**
Identify when existing trends have strong volume backing for continuation plays.
**Distribution Detection:**
Spot potential tops when price struggles despite high volume (negative correlation).
**Entry Timing:**
Built-in alert system notifies when both conditions align for optimal entry points.
---
## **🔧 Customization Features**
- **Correlation Period:** Adjust sensitivity (2-500 bars)
- **Volume Averaging:** Modify volume comparison timeframe
- **Alert Thresholds:** Fine-tune correlation and volume ratio triggers
- **Visual Options:** Toggle volume histogram display
- **Price Source:** Choose from OHLC or custom sources
---
## **💡 Why VCPM Works**
Traditional momentum indicators often generate false signals during low-volume periods. VCPM solves this by requiring **dual confirmation**: price momentum must be supported by corresponding volume activity. This approach:
- Reduces whipsaws and false breakouts
- Identifies institutional participation
- Provides higher conviction trade setups
- Works across all timeframes and markets
---
## **📈 Best Use Cases**
✅ **Crypto markets** (high volatility, volume-driven)
✅ **Stock breakouts** (earnings, news events)
✅ **Forex majors** (during high-impact news)
✅ **Futures trading** (momentum confirmation)
---
## **⚠️ Important Notes**
- Works best in liquid markets with consistent volume data
- Combine with support/resistance levels for enhanced accuracy
- Consider market context (trending vs. ranging conditions)
- Not recommended for extremely low-volume periods
---
## **🚀 Getting Started**
1. Add VCPM to your chart as a sub-panel indicator
2. Configure correlation threshold (start with 0.6)
3. Set volume ratio threshold (start with 0.5)
4. Enable alerts for automated signal detection
5. Backtest on your preferred timeframe and instrument
---
**Ready to enhance your momentum trading with volume confirmation? Try VCPM and experience the difference institutional-backed signals can make in your trading results.**
*Available in Pine Script v6 - Compatible with all TradingView accounts*

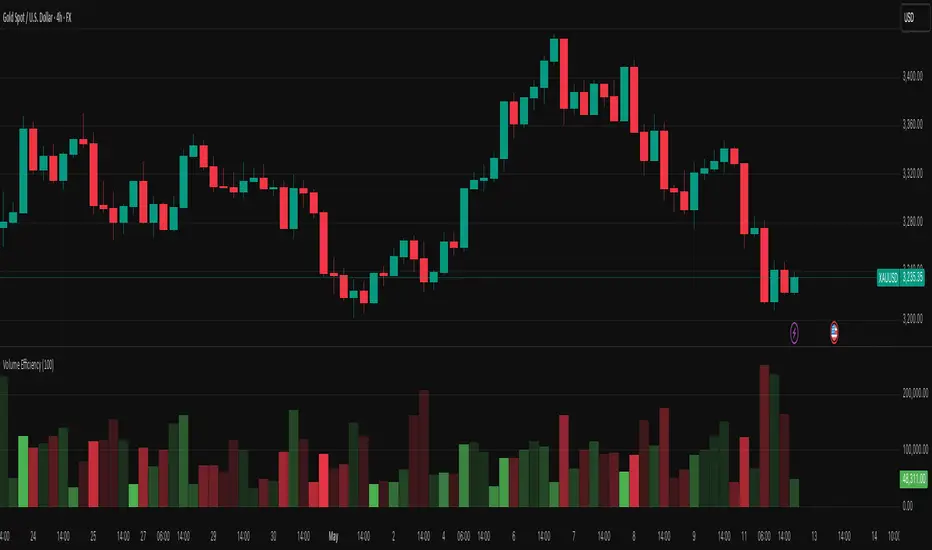
Volume EfficiencyThis indicator displays each candle's volume in an enhanced visual form, combining the amount of volume with the efficiency of the price movement.
Each volume bar changes its color intensity based on:
Higher efficiency (large price movement with low volume) → stronger color.
Lower efficiency (high volume with little price movement) → weaker color.
Additionally:
Green: Bullish candles (close > open).
Red: Bearish candles (close < open).
The color reflects not only the volume but also how "easily" the price moved.
The efficiency calculation is based on the actual body movement of the candle (abs(close - open)) divided by the total volume, dynamically adjusted to the maximum efficiency over the last N candles (configurable).
Interpretation:
Intensely green or red volume bars: clean and efficient movements (low resistance).
Pale bars: market absorption or indecision (high volume but little price movement).
Configurable parameter:
Efficiency period: number of candles used to normalise the maximum efficiency.
Volume Intelligence Suite (VIS) v2📊 Volume Intelligence Suite – Smart Volume, Smart Trading
The Volume Intelligence Suite is a powerful, all-in-one TradingView indicator designed to give traders deeper insight into market activity by visualizing volume behavior with price action context. Whether you're a scalper, day trader, or swing trader, this tool helps uncover hidden momentum, institutional activity, and potential reversals with precision.
🔍 Key Features:
Dynamic Volume Zones – Highlights high and low volume areas to spot accumulation/distribution ranges.
Volume Spikes Detector – Automatically marks abnormal volume bars signaling potential breakout or trap setups.
Smart Delta Highlighting – Compares bullish vs bearish volume in real time to reveal buyer/seller strength shifts.
Session-Based Volume Profiling – Breaks volume into key trading sessions (e.g., London, New York) for clearer context.
Volume Heatmap Overlay – Optional heatmap to show intensity and velocity of volume flow per candle.
Custom Alerts – Built-in alerts for volume surges, divergences, and exhaustion signals.
Optimized for Kill Zone Analysis – Pairs perfectly with ICT-style session strategies and Waqar Asim’s trading methods.
🧠 Why Use Volume Intelligence?
Most traders overlook the story behind each candle. Volume Intelligence Suite helps you "see the why behind the move" — exposing key areas of interest where smart money may be active. Instead of reacting late, this tool puts you in position to anticipate.
Use it to:
Validate breakouts
Detect fakeouts and liquidity grabs
Confirm bias during kill zones
Analyze volume divergence with price swings
⚙️ Fully Customizable:
From volume thresholds to visual styles and session timings, everything is user-adjustable to fit your market, timeframe, and strategy.
✅ Best For:
ICT/Smart Money Concepts (SMC) traders
Breakout & reversal traders
Kill zone session scalpers
Institutional footprint followers

Volume-Price Momentum IndicatorVolume-Price Momentum Indicator (VPMI)
Overview
The Volume-Price Momentum Indicator (VPMI), developed by Kevin Svenson , is a powerful technical analysis tool designed to identify strong bullish and bearish momentum in price movements, driven by volume dynamics. By analyzing price changes and volume surges over a user-defined lookback period, VPMI highlights potential trend shifts and continuation patterns through a smoothed histogram, optional labels, and background highlights. Ideal for traders seeking to capture momentum-driven opportunities, VPMI is suitable for various markets, including stocks, forex, and cryptocurrencies.
How It Works
VPMI calculates the difference between volume-weighted buying and selling pressure based on price changes over a specified lookback period. It amplifies signals during high-volume periods, applies smoothing to reduce noise, and uses momentum checks to detect sustained trends.
Indicator display:
A histogram that oscillates above (bullish) or below (bearish) a zero line, with brighter colors indicating stronger momentum and faded colors for weaker signals.
Optional labels ("Bullish" or "Bearish") to mark significant momentum shifts.
Optional background highlights to visually emphasize strong trend conditions.
Alerts to notify users when strong bullish or bearish momentum is detected.
Key Features
Customizable Settings:
Adjust the lookback period, volume threshold, momentum length, and smoothing to suit your trading style.
Volume Sensitivity:
Emphasizes price movements during high-volume surges, enhancing signal reliability.
Momentum Detection: Uses linear regression and momentum change to confirm sustained trends, reducing false signals.
Visual Clarity:
Offers a clear histogram with color-coded signals, plus optional labels and backgrounds for enhanced chart readability.
Alerts:
Configurable alerts for strong momentum signals, enabling timely trade decisions.
Inputs and Customization
Lookback Period (Default: 9):
Sets the number of bars to analyze price changes. Higher values smooth signals but may lag.
Volume Threshold (Default: 1.4):
Defines the volume level (relative to a 20-period SMA) that qualifies as a surge, amplifying signals.
High Volume Multiplier (Default: 1.5):
Boosts histogram values during high-volume periods for stronger signals.
Histogram Smoothing Length (Default: 4):
Controls the EMA smoothing applied to the histogram, reducing noise.
Momentum Check Length (Default: 4):
Sets the period for momentum trend analysis (recommended to be less than Lookback Period).
Momentum Threshold (Default: 6):
Defines the minimum momentum change required for strong signals.
Show Labels (Default: Off):
Toggle to display "Bullish" or "Bearish" labels on significant momentum shifts.
Show Backgrounds (Default: Off):
Toggle to highlight chart backgrounds during strong momentum periods.
Bullish/Bearish Colors:
Customize colors for bullish (default: green) and bearish (default: red) signals.
Faded Transparency (Default: 40):
Adjusts the transparency of weaker signals for visual distinction.
How to Use
Interpret Signals:
Above Zero (Green):
Indicates bullish momentum. Bright green suggests strong, sustained buying pressure.
Below Zero (Red):
Indicates bearish momentum. Bright red suggests strong, sustained selling pressure.
Faded Colors:
Weaker momentum, potentially signaling consolidation or trend exhaustion.
Enable Visuals:
Turn on "Show Labels" and "Show Backgrounds" in the settings for additional context on strong momentum signals.
Set Alerts:
Use the built-in alert conditions ("Strong Bullish Momentum" or "Strong Bearish Momentum") to receive notifications when significant trends emerge.
Combine with Other Tools:
Pair VPMI with support/resistance levels, trendlines, or other indicators (e.g., RSI, MACD) for confirmation.
Best Practices
Timeframe:
VPMI works on all timeframes, but shorter timeframes (e.g., 5m, 15m) may produce more signals, while longer timeframes (e.g., 1h, 4h, 1D) offer higher reliability.
Market Conditions:
Most effective in trending markets. In choppy or sideways markets, consider increasing the smoothing length or momentum threshold to filter noise.
Risk Management:
Always use VPMI signals in conjunction with a robust trading plan, including stop-losses and position sizing.
Limitations
Lagging Nature:
As a momentum indicator, VPMI may lag in fast-moving markets due to smoothing and lookback calculations.
False Signals:
In low-volume or ranging markets, signals may be less reliable. Adjust the volume threshold or momentum settings to improve accuracy.
Customization Required:
Optimal settings vary by asset and timeframe. Experiment with inputs to align with your trading strategy.
Why Use VPMI?
VPMI offers a unique blend of volume and price momentum analysis, making it a versatile tool for traders seeking to identify high-probability trend opportunities. Its customizable inputs, clear visuals, and alert capabilities empower users to tailor the indicator to their needs, whether for day trading, swing trading, or long-term analysis.
Get Started
Apply VPMI to your chart, tweak the settings to match your trading style, and start exploring momentum-driven opportunities. For questions or feedback, consult TradingView’s community forums or documentation. Happy trading!

Volume and Volatility Ratio Indicator-WODI该指标名为“交易量与波动率比例指标-WODI”,主要基于交易量和价格波动率构造一个复合指数,帮助识别市场内可能存在的异常或转折信号。具体实现如下:
用户自定义参数
用户可以设置交易量均线长度(vol_length)、指数的短期与长期均线长度(index_short_length、index_long_length)、均线敏感度(index_magnification)、阈值放大因子(index_threshold_magnification)以及检测K线形态的区间(lookback_bars)。这些参数为后续计算提供了灵活性,允许用户根据不同市场环境自定义指标的敏感度和响应速度。
交易量均线与百分比计算
首先通过 ta.sma 计算指定长度的交易量简单均线(vol_ma)。
接下来,将当前交易量与均线进行比较,计算出当前交易量占均线的百分比(vol_percent),这反映了短期内交易量的相对活跃程度。
波动率的衡量
使用当前K线的最高价和最低价计算振幅,再除以收盘价乘以100得到波动率(volatility),从而反映市场价格波动的幅度。
构建交易量/波动率指数
将交易量百分比与波动率相乘,形成了“交易量/波动率指数”(volatility_index)。该指数能够同时反映市场的交易活跃度和价格波动性,两者的联合作用帮助捕捉市场的“热度”。
计算指标均线与阈值
对交易量/波动率指数分别计算短期均线(index_short_ma)和长期均线(index_long_ma),并通过乘以一个敏感度参数(index_magnification)进行调整。
同时,依据长期均线计算一个阈值(index_threshold),起到过滤噪音的作用。当指数突破该阈值时,可能预示着市场的重要变化。
K线形态与反转模式检测
通过遍历最近几根K线(由lookback_bars控制),指标会检测是否符合一系列预定条件(涉及交易量、价格振幅、K线形态等),以判断是否存在反转模式。若符合条件,则标记为反转模式,从而为潜在的转折点提供提示。
图表展示
最终在独立窗口中绘制多个元素:
指数短均线与长均线:经过敏感度调整后显示,用于分析指数趋势。
交易量/波动率指数:采用阶梯线风格绘制,直观展示指数变化。
阈值线:作为参考水平,便于判断指数是否突破常规范围。
交易量柱状图:当当前交易量高于均线时,通过不同颜色显示;当检测到反转模式时,颜色会进一步强化,帮助用户迅速识别潜在信号。
English Description
This indicator, titled “Volume and Volatility Ratio Indicator - WODI”, is designed to construct a composite index based on trading volume and price volatility, aiding in the identification of abnormal market conditions or potential reversal signals. Its functionality is broken down as follows:
User-Defined Parameters
The indicator allows users to set parameters such as the moving average length for volume (vol_length), the short and long moving average lengths for the index (index_short_length and index_long_length), a sensitivity multiplier (index_magnification), a threshold magnification factor (index_threshold_magnification), and the number of bars for pattern detection (lookback_bars). These parameters provide flexibility to adjust the sensitivity and responsiveness of the indicator based on different market conditions.
Volume Moving Average and Percentage Calculation
A simple moving average (SMA) of volume is computed over the specified length (vol_ma) using the ta.sma function.
The current volume is then compared to its moving average to calculate the volume percentage (vol_percent), reflecting the relative trading intensity in the short term.
Measuring Volatility
Volatility is calculated based on the current bar’s high and low prices, normalized by the closing price and multiplied by 100, which provides a measure of the market’s price fluctuation magnitude.
Constructing the Volume/Volatility Index
The index (volatility_index) is derived by multiplying the volume percentage by the calculated volatility. This composite metric reflects both market activity and price movement, effectively capturing the overall “heat” of the market.
Calculating the Index Moving Averages and Threshold
Two moving averages for the volatility_index are computed: one short-term (index_short_ma) and one long-term (index_long_ma). These are then adjusted by the sensitivity multiplier (index_magnification).
A threshold level (index_threshold) is calculated based on the long-term moving average multiplied by the threshold magnification factor, serving to filter out market noise. When the index exceeds this threshold, it may signal significant market shifts.
Detection of Reversal Patterns
The indicator iterates through the recent bars (as determined by lookback_bars) to check whether a set of predetermined conditions (involving trends in the volatility_index, volume comparisons, price closes, and K-line patterns) are met. If these conditions are satisfied, it flags a reversal pattern, which may serve as a warning for a potential market turnaround.
Visualization on the Chart
The final display includes several elements plotted in a separate indicator window:
The short-term and long-term moving averages of the index (after sensitivity adjustment) which help visualize the trend of the composite index.
The volatility index itself is drawn using a step-line style for clarity.
A threshold line is plotted to provide a reference level against which index movements can be compared.
A volume histogram is also displayed, where bars are colored differently when the current volume exceeds the moving average; the color is further enhanced if a reversal pattern is detected, making it easy for users to quickly spot potential signals.
Volumen trend indicator 5MVOLUMEN TREND INDICATOR
Introduction
This indicator on TradingView provides a combination of technical analysis through a data table and visual elements on the chart. Its purpose is to provide a comprehensive view of the analyzed asset, facilitating decision-making.
How It Works
The indicator operates on two levels:
Data Table:
Displays key information about the asset's trend.
Includes metrics such as the current price, percentage change, volatility, and other relevant variables.
Can be customized to include additional indicators as needed.
Provides a quick analysis without the need to interpret complex charts.
Technical Elements on the Chart:
Incorporates dynamic support and resistance lines.
Can include moving averages, Bollinger Bands, RSI, or other custom indicators.
Offers visual alerts for significant changes in the asset's trend.
Facilitates detailed technical analysis through direct observation of patterns and signals.
Default Technical Indicators
The indicator comes with the following default pre-configured technical indicators:
Exponential Moving Average (EMA) 9:
This EMA responds more quickly to price movements, making it ideal for identifying short-term trends. It is generally used to detect crossovers with other EMAs or prices and is considered an entry or exit signal.
Exponential Moving Average (EMA) 21:
The 21-period EMA is used to identify medium-term trends. Its interaction with the 9 EMA is key to confirming buy or sell signals when both cross.
RSI (Relative Strength Index):
It is used to measure the magnitude of recent gains and losses of an asset, helping to identify overbought or oversold conditions.
Bollinger Bands:
These bands help identify volatility levels and potential reversal points. Price touching the upper or lower bands can be an important signal of trend change or continuation.
Customization
The user can modify several aspects of the indicator, such as:
Colors and styles of visual elements on the chart.
Types of indicators to include in the table.
Configuration of alerts and notifications.
Time interval for calculations and data updates.
EMA values (the periods can be changed if other configurations are desired).
Recommended Usage
To make the most of the indicator:
Use the data table to get an overview of the asset.
Analyze the technical elements on the chart to confirm trends.
Set alerts to avoid missing key opportunities.
Compare the information with other indicators and data sources before making decisions.
Precautions and Best Practices
Avoid relying solely on the indicator: Complement it with other technical and fundamental analysis.
Adjust the settings according to the asset's volatility: Not all strategies work the same across different markets.
Don’t overload the chart with too many elements: This can create visual noise and confusion in interpretation.
Test it on a demo account before trading live: To familiarize yourself with the indicator's functionality and adjustments.
----------------------------------------------
Remember that no system is perfect, keep these considerations in mind for this indicator:
Do not trade when a signal appears during an opposite trend:
Do not trade when the market is uncertain in its direction or within a parallel channel:

Volume Aggregated Spot & FuturesAggregated volume for cryptos using spot and perpetual contracts but only those that are based on normal volume and not on tick volume.
Provides more reliable volume than volume from one provider.
Thanks to HALDRO because it's his code and I simplified it to create this version.
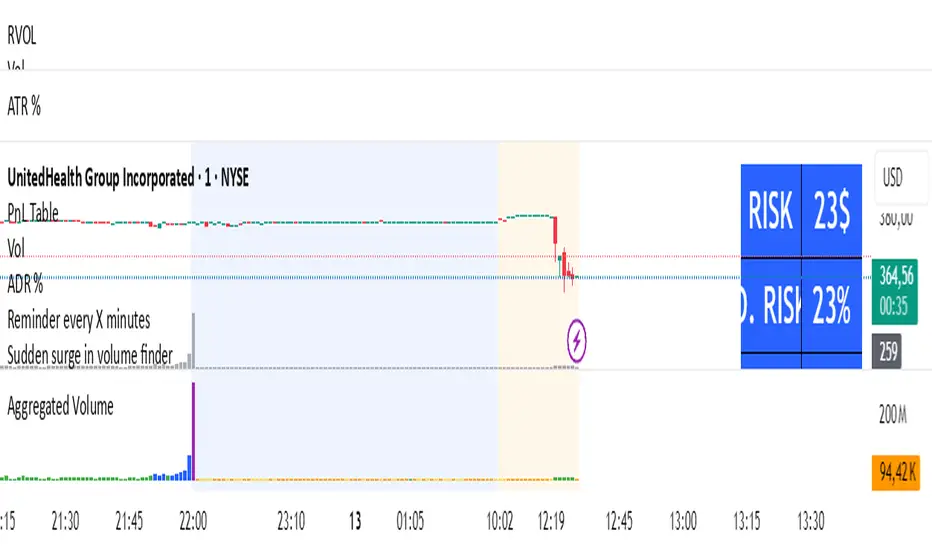
Volume strength % Bias @MaxMaserati 📊 MMM Candle Bias Volume % Strength Bias 📊
🔍 Overview
A sophisticated yet intuitive market analysis tool that combines volume analysis, trend detection, and momentum scoring to provide clear trading signals. This indicator helps traders identify market control between buyers and sellers using a unique scoring system based on volume, price action, and multi-timeframe alignment.
This professional-grade tool is designed to enhance your trading decisions through clear visual signals and comprehensive market analysis.
🧩 Core Components
📈 Volume Analysis System
- Compares current volume to 20-period average
- Identifies high-volume periods (1.5x above average)
- Uses volume confirmation for signal strength
- Integrates volume trends across multiple timeframes (240min, 60min, current)
🔧 Advanced Features
- Multiple timeframe analysis (240, 60, current)
- Perfect alignment detection (+)
- Early warning system for trend changes
- Momentum scoring across timeframes
- Volume-trend correlation analysis
- Trend alignment confirmation
🎯 Market Control Measurement
- Analyzes candlestick patterns and body ratios
- Calculates buyer/seller control percentages
- Monitors trend strength across timeframes
- Tracks consecutive directional movements
- Identifies perfect alignments (+) across timeframes
🏷️ Label Understanding
Direction Arrows:
- ↗️ = Uptrend in progress
- ↘️ = Downtrend in progress
- → = Sideways/Neutral trend
Volume Indicator:
- 🔊 = High volume (1.5x above average volume)
Exit Warnings:
- XXX = Strongest exit signal (high volume reversal)
- XX = Strong exit warning
🚦 Visual Signals
- Green bars: Bull Control %
- Red bars: Bear Control %
- Direction Arrows: ↗️ (Up), ↘️ (Down), → (Sideways)
- Volume Alert: 🔊 (High Volume)
- Perfect Alignment: + (All timeframes aligned)
- Exit Warnings: XXX, XX (Risk Levels)
⚠️ Exit Signals
- XXX: Immediate exit (strong reversal with volume)
- XX: Strong warning (deteriorating conditions)
- X: Initial caution signal
- More urgent when losing perfect alignment (+)
📝 Labels Combination significance
- ↗️🔊+ = Perfect uptrend with volume confirmation
- ↘️🔊+ = Perfect downtrend with volume confirmation
- ↗️+ = Perfect uptrend alignment
- ↘️🔊XX = Downtrend with volume and exit warning
⭐ Perfect Alignment (+)
Indicates:
- All timeframes in agreement (240min, 60min, current)
- Strong momentum (above 60%)
- Clear trend direction
- Highest probability setups
- Best for position entries
🌟 Special Signals
🔄 Trend Shifts
- "Strong ⬆️" or "Strong ⬇️": Major momentum moves
- "Early": Potential trend formation
- "⬆️ Trend Shift" or "⬇️ Trend Shift": Potential Major trend change alerts
- Requirements: 60%+ control, 3+ consecutive bars
- Enhanced reliability with + alignment
📍 Signal Zones & Interpretation
💪 Strong Zone (70%+ Control)
- Highest probability trading opportunities
- Perfect for full position sizing
- Requires volume confirmation (🔊)
- Enhanced reliability with perfect alignment (+)
- Best for confident directional trades
✅ Confirmed Zone (60-70% Control)
- Solid trading opportunities
- Recommended for reduced position sizes
- Look for consecutive confirmations
- Must have volume support (🔊)
- More valuable with perfect alignment (+)
📋 Trading Strategy Guide
💯 For Strong Signals (>70%)
1. Wait for bar confirmation above 70%
2. Confirm high volume presence (🔊)
3. Check for perfect alignment (+)
4. Monitor for XXX exit signals
5. Set wider stops based on volatility
✔️ For Confirmed Signals (60-70%)
1. Require volume confirmation (🔊)
2. Look for perfect alignment (+)
3. Look for multiple confirmations
4. Set tighter stops
5. Exit quickly on XX or XXX signals
General Uses
📥 Best Entry
1. Wait for + symbol with volume (🔊)
2. Confirm trend direction (↗️ or ↘️)
3. Check control percentage (preferably 70%+)
4. Look for consecutive aligned bars
5. Enter with appropriate position size
⚖️ Risk Management
- Quick exits: Honor XXX warnings
- Tight stops: Required for 60-70% zone trades
- Volume confirmation: Essential for all entries
- Perfect alignment (+): Allows for larger position sizes
Remember: This indicator serves as a market strength meter. Perfect alignments (+) with higher percentages and multiple confirmations indicate the strongest signals. Always combine with proper risk management and additional technical analysis for optimal results.
Note: Past performance doesn't guarantee future results. This is a tool to help your trading decisions. Always combine it with other technical analysis and proper risk management for best results.

Volume Profile With HVN & LVN detectorVolume Profile Indicator
Based on the works of tradeforopp
Overview
The Volume Profile Indicator is a powerful technical analysis tool that visually represents the distribution of trading volume over price levels within a specified timeframe. It helps traders identify key support and resistance zones, high-volume trading areas, and low-volume rejection zones. The indicator includes customizable settings for Volume Point of Control (VPOC), High Volume Nodes (HVNs), and Low Volume Nodes (LVNs), making it a versatile tool for price action analysis and volume-based decision-making.
Key Features
🔹 Customizable Volume Profile
Adjustable number of rows to define the resolution of the volume profile.
Configurable timeframe aggregation for profile calculation (e.g., Daily, Weekly).
Selectable price resolution timeframe for precise profile construction.
Extendable volume profile for future sessions.
Fully customizable profile color and transparency settings.
🔹 Volume Point of Control (VPOC)
Displays the most traded price level within the selected timeframe.
Option to extend multiple VPOCs across the chart.
Adjustable VPOC line width and color customization.
Option to display VPOC labels when working with higher timeframe profiles.
🔹 High Volume Nodes (HVNs)
Identifies high-volume price levels where significant trading activity has occurred.
Configurable HVN strength to adjust detection sensitivity.
Two display modes:
Lines: Plots HVN levels as horizontal lines.
Areas: Highlights HVN regions with colored boxes.
Separate bullish and bearish HVN color settings.
🔹 Low Volume Nodes (LVNs)
Identifies low-volume price levels, which often act as rejection zones.
Configurable LVN strength to fine-tune detection.
Two display modes:
Lines: Marks LVN levels as horizontal lines.
Areas: Highlights LVN regions with shaded boxes.
Separate bullish and bearish LVN color settings.
🔹 Optimized for Performance
Efficient use of arrays for data storage and retrieval.
Global functions for HVN and LVN detection.
Uses security calls to access lower timeframe price and volume data.
Use Cases
✅ Identify Support & Resistance Levels
The indicator highlights key price levels where significant buying or selling interest exists.
✅ Detect Breakout & Reversal Zones
Low-volume areas (LVNs) often indicate price rejection zones, while high-volume areas (HVNs) suggest strong price acceptance zones.
✅ Improve Trade Entries & Exits
Traders can use the Volume Point of Control (VPOC) and volume clusters to refine entry and exit points.
✅ Enhance Price Action Strategies
By incorporating volume-based analysis, this indicator provides deeper market insights beyond traditional support/resistance and trendlines.
Customization & Settings
📌 Volume Profile Settings:
Rows: Defines the granularity of the volume profile.
Profile Timeframe: Specifies the aggregation period (e.g., Daily, Weekly).
Resolution Timeframe: Determines the price resolution for volume analysis.
Profile Extend %: Controls how much the profile extends into the next session.
📌 Volume Point of Control (VPOC):
Enable/Disable VPOC visualization.
Extend past VPOC levels to the right.
Display VPOC labels for higher timeframe profiles.
Adjustable VPOC line width and color.
📌 High Volume Nodes (HVNs):
Enable/Disable HVN detection.
Define HVN strength (volume threshold).
Choose between Line Mode or Area Mode.
Configure bullish and bearish HVN colors.
📌 Low Volume Nodes (LVNs):
Enable/Disable LVN detection.
Define LVN strength (volume threshold).
Choose between Line Mode or Area Mode.
Configure bullish and bearish LVN colors.

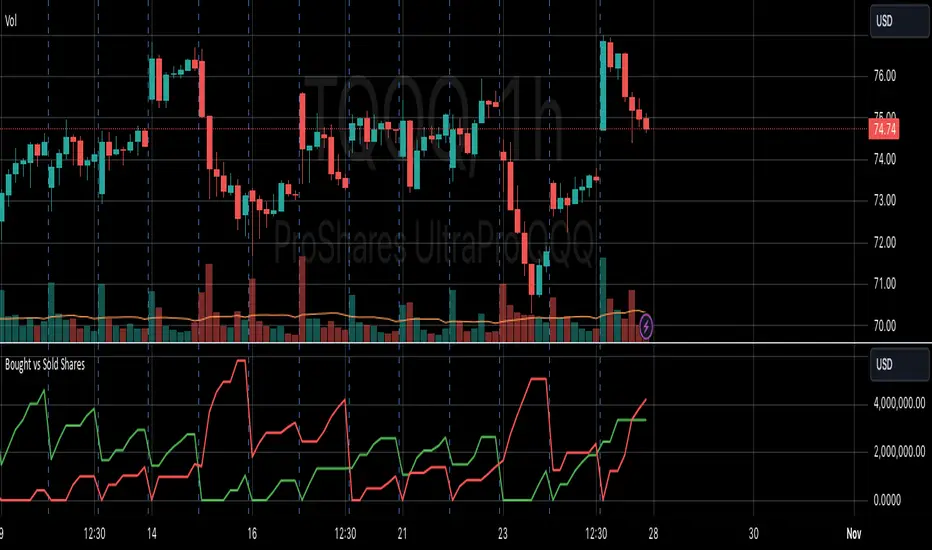
VOLUME DIRECTION INDICATORDesigned for the 1-hour chart, this indicator shows:
Green Line: Volume when price rises, suggesting buying.
Red Line: Volume when price falls, indicating selling.
How to Use:
Watch for Crossover: When the Green Line moves above the Red, it might signal a budding uptrend.
Check Retracement: If the Green Line pulls back but stays above the Red, the uptrend could be strengthening.
Price Check: Look for a small price drop but not a reversal.
Trade Entry:
Enter at the high of the retracement candle.
Or wait for the Green Line to rise again.
For Precision: Draw a line at the retracement peak and switch to a shorter timeframe to find entry patterns above this line.
Remember: Use this with other tools for better trading decisions.
The Volume Direction Indicator provides a visual representation of market activity by assuming volume can be attributed to buying or selling based on price action within each bar. When the price closes higher than it opened, the volume for that period is considered as 'Bought Shares', plotted in green. Conversely, if the price closes lower, the volume is treated as 'Sold Shares', shown in red. This indicator resets daily to give a fresh perspective on trading activity each day.
Key Features:
Buying Pressure: Green line represents the cumulative volume during periods where the price increased.
Selling Pressure: Red line indicates the cumulative volume during price decreases.
Daily Reset: Accumulated values reset at the start of each new trading day, focusing on daily market sentiment.
Note: This indicator simplifies market dynamics by linking volume directly to price changes. It does not account for complex trading scenarios like short selling or market manipulations. Use this indicator as a tool to gauge general market direction and activity, not for precise transaction data.
Volume CalendarDescription:
The indicator displays a calendar with Volume data for up to 6 last months. It is designed to work on any timeframe, but works best on Daily and below. It is also consistent in that it displays the same data even if you go to lower timeframes like 5 minutes (even though the data is used is Daily).
Features:
- displays volume data for last N months (volume, volume change, % of weekly, monthly and yearly volume)
- display total volume for each month
- display monthly sentiment
- find dates with volume spikes
Inputs:
- Number of months -> how many last months of data to display (from 1 to 6)
- Volume Type -> display only Bullish, only Bearish or all volume
- Cell color is based on -> Volume - the brighter the cell the higher volume was on that day; Volume Change - the brighter the cell the higher was the volume change that day; Volume Spike - the brighter the cell the higher was volume spike that day (volume spike is based on volume being above its average over last N candles)
- Cell color timeframe -> Weekly - the cell color is calculated comparing volume of that cell with weekly volume; Monthly - comparing volume with monthly volume
- Use volume for sentiment -> take the volume into account when calculating monthly sentiment (otherwise calculate it based on number of Bullish and Bearish days in the month)
- Spike Average Period -> period of the moving average used for spike calculation
- Spike Threshold -> current volume must be this many times greater than the average for it to be considered a spike
- Table Size -> size of the table
- Theme -> colouring of the table

Volume - Plus / Connectable [Azullian]The connectable volume plus indicator enhances your trading strategy by providing an in-depth analysis of volume data within the connectable indicator system . This tool extends beyond the scope of traditional volume analysis, enabling a comprehensive examination of market trends without the necessity for coding. As part of our range of connectable indicators , it effectively works with TradingView's input source as a signal connector , facilitating a synchronized and interactive approach. Each connectable indicator, including Volume - Plus, contributes signal weight , allowing for a detailed and nuanced analysis which then informs a connectable signal monitor, signal filter, or strategy.
█ DISTINCTIVE FEATURES
Volume - Plus is equipped with features that enhance market analysis:
• Advanced Volume Analysis: Select from sophisticated volume modes like Volume waves and Time segmented volume for comprehensive market insights.
• Customizable Periods & Sources: Adjust the volume calculation settings to align with your specific strategy, using adjustable periods and alternative data sources.
• Versatile Scoring Conditions: Utilize six different thresholds for scoring to create a tailored approach for volume-based signal generation.
• Intuitive Visual Representation: Clear visual cues on volume trends and conditions are displayed directly on your charts, aiding in decision-making.
█ UNIFORM SETTINGS AND A WAY OF WORK
Although connectable indicators may have specific weight scoring conditions, they all aim to follow a standardized general approach to weight scoring settings, as outlined below.
■ Connectable indicators - Settings
• 🗲 Energy: Energy applies an ATR multiplier to the plotted shapes on the chart. A higher value plots shapes farther away from the candle, enhancing visibility.
• ☼ Brightness: Brightness determines the opacity of the shape plotted on the chart, aiding visibility. Indicator weight also influences opacity.
• BC - Bar coloring: Color candles based on your volume settings.
• → Input: Use the input setting to specify a data source for the indicator. Here you can connect the indicator to other indicators.
• ⌥ Flow: Determine where you want to receive signals from:
○ Both: Weights from this indicator and the connected indicator will apply
○ Indicator only: Only weights from this indicator will apply
○ Input only: Only weights from the connected indicator will apply
• ⥅ Weight multiplier: Multiply all weights in the entire indicator by a given factor, useful for quickly testing different indicators in a granular setup.
• ⥇ Threshold: Set a threshold to indicate the minimum amount of weight it should receive to pass it through to the next indicator.
• ⥱ Limiter: Set a hard limit to the maximum amount of weight that can be fed through the indicator.
■ Connectable indicators - Weight scoring settings
▢ Weight scoring conditions
• SM – Signal mode: Enable specific conditions for weight scoring
○ Start: A new trend in volume starting will score
○ End: A new trend in volume ending will score
○ Zone: Continuous scoring for each candle between the start and the end.
• SP – Signal period: Defines a range of candles within which a signal can score.
• SC - Signal count: Specifies the number of bars to retrospectively examine and score.
○ Single: Score for a single occurrence
○ All occurrences: Score for all occurrences
○ Single + Threshold: Score for single occurrences within the signal period (SP)
○ Every + Threshold: Score for all occurrences within the signal period (SP)
▢ Weight scoring direction
• ES: Enter Short weight
• XL: Exit long weight
• EL: Enter Long weight
• XS: Exit Short weight
▢ Weight scoring values
• Weights can hold either positive or negative scores. Positive weights enhance a particular trading direction, while negative weights diminish it.
█ Volume - Plus - INDICATOR SETTINGS
■ Main settings
• Enable/Disable Indicator: Toggle the entire indicator on or off.
• V - Volume mode: Choose between Volume waves and Time segmented volume
• P - Period: Set a period on which the volume is calculated.
• S - Source: Choose an alternative data source for the Volume calculation.
• T - Timeframe: Select an alternative timeframe for the Volume calculation.
• C - Candletype: Choose a candletype for the alternative source.
• B - Scaling bottom: Scale volume to this bottom level
• T - Scaling top: Scale volume to this top level
• A - Moving average type: Filter and smooth with these moving average types (ALMA, EMA, HMA, RMA, SMA, SWMA, VWMA, WMA)
• L - Moving average length: Set the length for the moving average.
• M - Moving average mode: Set the moving average mode
○ Source: Set as source
○ Banded threshold: Make the threshold levels move with a moving average
■ Conditions
Set six thresholds for scoring and determine your own type of scoring mechanism
• Enable/Disable condition: Toggle a condition on or off
• Conditional direction: Choose a direction for scoring
○ Above: Volume breaches the threshold
○ Rising: Volume rises above the threshold
○ Falling: Volume falls under the threshold
○ Crossover: Volume crosses over the threshold
○ Crossunder: Volume crosses under the threshold
• TH: Set a threshold level
• BBN: Set a sentiment for your condition
○ Bullish
○ Bearish
○ Neutral
■ Scoring functionality
• For each threshold you are able to set a sentiment. Sentiment scoring is incorporated in the weight conditions as usual.
█ PLOTTING
• Standard: Symbols (EL, XS, ES, XL) Volume is plotted according to the volume mode in the seperate pane and also with bar coloring on the candle if this option is enabled.
• Conditional Settings: A larger icon appears if global conditions are met. For instance, with a Threshold(⥇) of 12, Signal Period (SP) of 3, and Scoring Condition (SC) set to "EVERY", a volume threshold signaling over two times in 3 candles (scoring 6 each) triggers a larger icon.
█ USAGE OF CONNECTABLE INDICATORS
■ Connectable chaining mechanism
Connectable indicators can be connected directly to the signal monitor, signal filter or strategy , or they can be daisy chained to each other while the last indicator in the chain connects to the signal monitor, signal filter or strategy. When using a signal filter you can chain the filter to the strategy input to make your chain complete.
• Direct chaining: Connect an indicator directly to the signal monitor, signal filter or strategy through the provided inputs (→).
• Daisy chaining: Connect indicators using the indicator input (→). The first in a daisy chain should have a flow (⌥) set to 'Indicator only'. Subsequent indicators use 'Both' to pass the previous weight. The final indicator connects to the signal monitor, signal filter, or strategy.
■ Set up this indicator with a signal filter and strategy
The indicator provides visual cues based on signal conditions. However, its weight system is best utilized when paired with a connectable signal filter, monitor, or strategy .
Let's connect the volume - plus to a connectable signal filter and a strategy :
1. Load all relevant indicators
• Load Volume - Plus / Connectable
• Load Signal filter / Connectable
• Load Strategy / Connectable
2. Signal Filter: Connect the Volume - Plus to the Signal Filter - Plus
• Open the signal filter settings
• Choose one of the five input dropdowns (1→, 2→, 3→, 4→, 5→) and choose : Volume - Plus / Connectable: Signal Connector
• Toggle the enable box before the connected input to enable the incoming signal
3. Signal Filter: Update the filter settings if needed
• The default filter mode for the trading direction is SWING, and is compatible with the default settings in the strategy and indicators.
4. Signal Filter: Update the weight threshold settings if needed
• All connectable indicators load by default with a score of 6 for each direction (EL, XL, ES, XS)
• By default, weight threshold is 'ABOVE' Threshold 1 (TH1) and Threshold 2 (TH2), both set at 5. This allows each occurrence to score, as the default score is 1 point above the threshold.
5. Strategy: Connect the strategy to the signal filter in the strategy settings
• Select a strategy input → and select the Signal filter: Signal connector
6. Strategy: Enable filter compatible directions
• As the default setting of the filter is SWING, we should also set the SM (Strategy mode) to SWING.
Now that everything is connected, you'll notice green spikes in the signal filter representing long signals, and red spikes indicating short signals. Trades will also appear on the chart, complemented by a performance overview. Your journey is just beginning: delve into different scoring mechanisms, merge diverse connectable indicators, and craft unique chains. Instantly test your results and discover the potential of your configurations. Dive deep and enjoy the process!
█ BENEFITS
• Adaptable Modular Design: Arrange indicators in diverse structures via direct or daisy chaining, allowing tailored configurations to align with your analysis approach.
• Streamlined Backtesting: Simplify the iterative process of testing and adjusting combinations, facilitating a smoother exploration of potential setups.
• Intuitive Interface: Navigate TradingView with added ease. Integrate desired indicators, adjust settings, and establish alerts without delving into complex code.
• Signal Weight Precision: Leverage granular weight allocation among signals, offering a deeper layer of customization in strategy formulation.
• Advanced Signal Filtering: Define entry and exit conditions with more clarity, granting an added layer of strategy precision.
• Clear Visual Feedback: Distinct visual signals and cues enhance the readability of charts, promoting informed decision-making.
• Standardized Defaults: Indicators are equipped with universally recognized preset settings, ensuring consistency in initial setups across different types like momentum or volatility.
• Reliability: Our indicators are meticulously developed to prevent repainting. We strictly adhere to TradingView's coding conventions, ensuring our code is both performant and clean.
█ COMPATIBLE INDICATORS
Each indicator that incorporates our open-source 'azLibConnector' library and adheres to our conventions can be effortlessly integrated and used as detailed above.
For clarity and recognition within the TradingView platform, we append the suffix ' / Connectable' to every compatible indicator.
█ COMMON MISTAKES, CLARIFICATIONS AND TIPS
• Removing an indicator from a chain: Deleting a linked indicator and confirming the "remove study tree" alert will also remove all underlying indicators in the object tree. Before removing one, disconnect the adjacent indicators and move it to the object stack's bottom.
• Point systems: The azLibConnector provides 500 points for each direction (EL: Enter long, XL: Exit long, ES: Enter short, XS: Exit short) Remember this cap when devising a point structure.
• Flow misconfiguration: In daisy chains the first indicator should always have a flow (⌥) setting of 'indicator only' while other indicator should have a flow (⌥) setting of 'both'.
• Hide attributes: As connectable indicators send through quite some information you'll notice all the arguments are taking up some screenwidth and cause some visual clutter. You can disable arguments in Chart Settings / Status line.
• Layout and abbreviations: To maintain a consistent structure, we use abbreviations for each input. While this may initially seem complex, you'll quickly become familiar with them. Each abbreviation is also explained in the inline tooltips.
• Inputs: Connecting a connectable indicator directly to the strategy delivers the raw signal without a weight threshold, meaning every signal will trigger a trade.
█ A NOTE OF GRATITUDE
Through years of exploring TradingView and Pine Script, we've drawn immense inspiration from the community's knowledge and innovation. Thank you for being a constant source of motivation and insight.
█ RISK DISCLAIMER
Azullian's content, tools, scripts, articles, and educational offerings are presented purely for educational and informational uses. Please be aware that past performance should not be considered a predictor of future results.

Volume Spread Analysis [Ahmed]Greetings everyone,
I'm thrilled to present a Pine Script I've crafted for Volume Spread Analysis (VSA) Indicator. This tool is aimed at empowering you to make smarter trading choices by scrutinizing the volume spread across a specified interval.
The script delivers a comparative volume analysis, permitting you to fix the type and length of the moving average. It subsequently delineates the moving average (MA), MA augmented by 1 standard deviation (SD), and MA increased by 2 SD. You can fully personalize the color coding for these echelons.
Volume Spread Analysis is an analytical technique that scrutinizes candles and the volume per candle to predict price direction. It considers the volume per candle, the spread range, and the closing price.
To effectively leverage VSA, you need to adhere to a few steps:
1. Ensure you use candlesticks for trading. Other chart types like line, bar, and renko charts may not yield optimal results.
2. Confirm that your broker provides reliable volume data.
3. Be mindful of the chart's timeframe. Volume analysis may not be effective on very short timeframes such as a minute chart. I recommend using daily, weekly, or monthly charts.
Another tip is to examine the spread between the price bars and the volume bars to discern the trend.
The script not only makes it easier to integrate these principles into your trading but also brings precision and convenience to your analysis.
Please remember to adhere to Tradinview terms of service when using the script. Happy trading!
