ADX with 20 ThresholdI wanted an ADX with a threshold line so I created an indicator.
ADX (20 Threshold) Cheat-Sheet
Purpose: Filter trades by trend strength.
Indicator: ADX (derived from DMI) with optional +DI/−DI lines.
Key Rules:
ADX > 20: Trend is strong → trade OK
ADX < 20: Trend is weak/choppy → avoid trades
Optional +DI / −DI: Shows momentum direction
HTF Use: Stable trend confirmation
LTF Use: Optional filter with EMA slope for entries
Tips:
Combine with EMAs or MACD for directional bias.
ADX does not indicate direction, only strength.
Best used to avoid low-probability trades in sideways markets.
Penunjuk dan strategi

Global M2(USD) V2This indicator tracks the total Global M2 Money Supply in USD. It aggregates economic data from the world's four largest central banks (Fed, PBOC, ECB, BOJ). The script automatically converts non-USD money supplies (CNY, EUR, JPY) into USD using real-time exchange rates to provide a unified view of global liquidity.
Usage
Macro Analysis: Overlay this on assets like Bitcoin or the S&P 500 to see if price appreciation is driven by fiat currency debasement ("money printing").
Liquidity Trends: A rising orange line indicates expanding global liquidity (generally bullish for risk assets), while a falling line suggests monetary tightening.
Real-time Data: A label at the end of the line displays the exact raw total in USD for precise tracking.
该脚本旨在追踪以美元计价的全球 M2 货币供应总量。它聚合了四大央行(美联储、中国央行、欧洲央行、日本央行)的经济数据,并通过实时汇率将非美货币(人民币、欧元、日元)统一折算为美元,从而构建出一个标准化的全球流动性指标。
用法
宏观对冲: 将其叠加在比特币或股票图表上,用于判断资产价格的上涨是否由全球法币“大放水”推动。
趋势研判: 橙色曲线向上代表全球流动性扩张(通常利好风险资产),向下则代表流动性紧缩。
数据直观: 脚本会在图表末端生成一个标签,实时显示当前全球 M2 的具体美元总额。

MA + ATR Channel V2This script creates a dynamic volatility channel (similar to a Keltner Channel). It plots a central Moving Average (SMA or EMA) to represent the baseline trend and uses the Average True Range (ATR) to calculate the Upper and Lower bands. The channel automatically widens during high volatility and narrows during low volatility.
Usage
Mean Reversion: In sideways markets, prices touching the outer bands often tend to revert back to the central line.
该脚本构建了一个基于波动率的动态通道(类似肯特纳通道)。它以**移动平均线(SMA或EMA)为中轴判断趋势,并利用真实波幅(ATR)**计算通道宽度。通道范围会随市场波动加剧而变宽,随波动平缓而收窄。
用法
震荡回归: 在横盘行情中,价格触及通道边缘时,往往有回调至中轴的倾向。

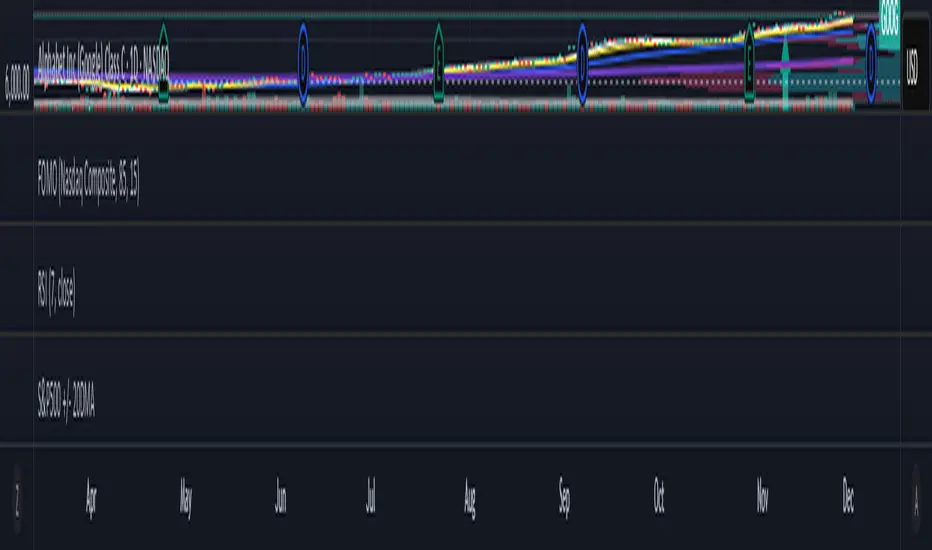
Market Regime & Bias Assistant [Prototype v1.1]
Market Regime & Bias Assistant
### **Overview**
The **Market Regime & Bias Assistant** is an all-in-one trend filtration and trading system designed to keep traders on the right side of the market. Instead of relying on a single moving average, this indicator combines **ADX (Trend Strength)**, **Multi-Timeframe EMAs**, **RSI**, and **Volume Spread Analysis (VSA)** concepts to generate a quantitative "Confidence Score" for the current market bias.
It automatically adapts its settings based on your timeframe (Intraday vs. Swing) and provides clear visual cues via background shading, candle coloring, and a data panel.
---
### **Key Features**
* **Auto-Adaptive Modes:** Automatically switches between "Intraday" and "Swing" settings based on your timeframe.
* *Intraday:* Uses faster EMAs (Aggressive 9/30 or Conservative 20/50) and VWAP.
* *Swing:* Uses standard 20/50 EMAs with 200/800 long-term context moving averages.
* **Market Regime Detection:** Identifies if the market is in a **Trend (Bull/Bear)** or a **Range (Neutral)** using a combination of ADX thresholds and EMA alignment.
* **Confidence Scoring (0-100):** A proprietary algorithm that scores the quality of the trend based on RSI alignment, Volume confirmation, and Long-term EMA context.
* **Vector Volume Candles:** Color-coded candles to highlight institutional activity (High Volume) vs. Climactic Volume (Exhaustion).
* **Pullback Signals:** "L" and "S" markers indicating high-probability entries after a pullback into the EMA value zone.
* **Data Dashboard:** A bottom-right panel displaying the current Mode, Regime, Bias, and quantitative Confidence Score.
---
### **How to Read the Visuals**
#### **1. Background Colors (The Regime)**
* **Green Background:** Confirmed **Bullish Trend**. Only look for Longs.
* **Red Background:** Confirmed **Bearish Trend**. Only look for Shorts.
* **Gray Background:** **Neutral / Range**. The market is chopping or consolidating. Stand aside or trade strictly mean-reversion.
#### **2. Candle Colors (Vector Volume)**
* **Green/Red Borders:** Normal volume.
* **Blue / Fuchsia:** **High Volume (1.2x Average)**. Indicates institutional interest or a breakout.
* **Lime / Bright Red:** **Climactic Volume (1.8x Average)**. Indicates potential exhaustion or a stopping volume event.
#### **3. The EMAs**
* **Fast/Slow Lines:** Show the immediate trend direction.
* **Gray/White Lines:** The 200 and 800 EMAs. These act as major support/resistance levels and define the "Big Picture" bias.
* **Lime Line (Intraday Only):** The VWAP (Volume Weighted Average Price).
---
### **How to Use This Indicator**
**Step 1: Check the Regime**
Look at the background color and the Dashboard panel. Is the Trend Strength "Strong" or "Very Strong"?
* *Rule:* Do not take trend-following trades if the Regime is "Range/Neutral."
**Step 2: Check the Confidence**
The dashboard calculates a score from 0 to 100.
* **High Confidence (>67):** All systems go. Alignment of RSI, Volume, and Trend.
* **Medium Confidence (34-66):** Caution warranted. Usually implies divergence in RSI or low volume.
* **Low Confidence (<34):** The trend is weak or failing.
**Step 3: Wait for the Setup (The Arrows)**
The indicator looks for pullbacks into the "Value Zone" (the space between the Fast and Slow EMA).
* **Triangle Up (L):** Appears when price pulls back into the zone during a Bull trend, then bounces out with volume confirmation.
* **Triangle Down (S):** Appears when price rallies into the zone during a Bear trend, then rejects lower.
---
### **Settings & Customization**
* **Mode:** Default is "Auto," but you can force "Intraday" or "Swing" manually.
* **Intraday Style:** Choose between "Aggressive" (9 EMA / 30 EMA) for scalping or "Conservative" (20 EMA / 50 EMA) for day trading.
* **ADX Threshold:** Adjusts how strict the trend filter is (Default: 20).
* **Visual Toggles:** Turn off/on the Panel, Background shading, or Vector candles to clean up your chart.
### **Alerts**
This script comes with built-in alert conditions for:
1. **Bullish Regime Start**
2. **Bearish Regime Start**
3. **High-Confidence Setup Detected**

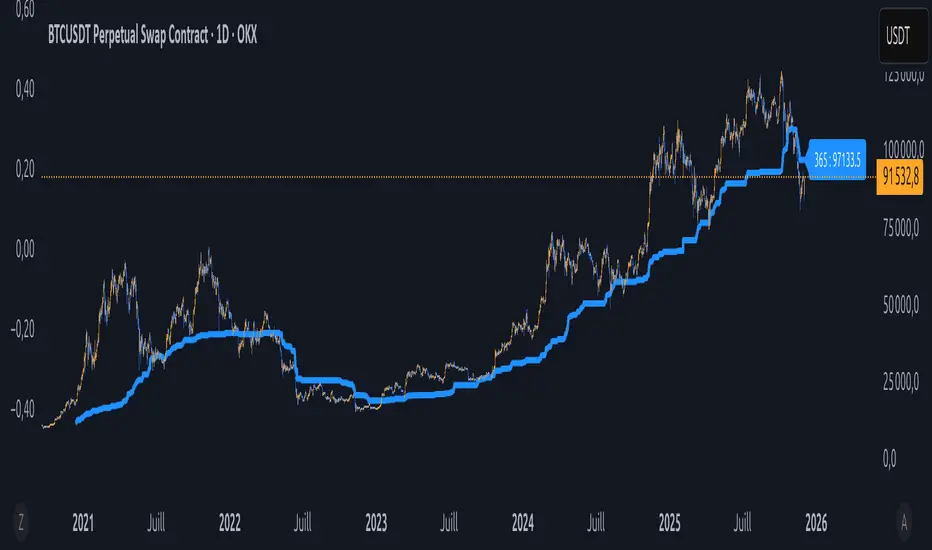
BTC Price Prediction Model [Global PMI]🇨🇳 中文说明 (Chinese Version)
1. 简介
本指标由 GW Capital 使用 Gemini Vibe Coding 技术制作。利用先进的 AI 编程能力,将复杂的宏观经济模型重构为可执行的交易工具。
2. 致谢
特别感谢模型原作者 Marty Kendall。他对这一算法的研究奠定了基础,揭示了比特币价格与宏观经济因素之间的深层联系。
3. 模型原理与公式
该模型基于四大宏观经济支柱计算比特币的“公允价值”。它假设比特币的价格是全球流动性、网络安全性、风险偏好和经济周期的函数。
模型公式
$$\ln(BTC) = \alpha + (1 + \beta \cdot PMI_{z}) \times $$
全球流动性 (M2): 美、中、欧、日四大经济体的 M2 总量(折算为美元)。代表可流入资产的法币资金池。
网络安全性 (Hashrate): 比特币全网算力,代表网络的物理安全性和实用价值。
风险偏好 (S&P 500): 作为全球风险情绪的代理指标。
经济周期 (PMI Z-Score): 美国制造业 PMI 用于根据商业周期(扩张 vs 收缩)来放大或抑制估值。
4. 指标用法
指标会在图表上绘制 公允价值 (白线) 以及基于统计偏差 (Z-Score) 的四条情绪带。
情绪区间
🚨 极度贪婪 (红色区域): 价格 > +0.3 标准差。历史上通常预示市场顶部或情绪过热。
⚠️ 一般贪婪 (橙色区域): 价格 > +0.15 标准差。多头动能强劲,但需谨慎。
⚖️ 公允价值 (白线): 基于宏观数据的理论“正确”价格。
😨 一般恐惧 (青色区域): 价格 < -0.15 标准差。进入低估区域。
💎 极度恐惧 (绿色区域): 价格 < -0.3 标准差。历史上通常是代际级别的买入机会。
情绪评分 (0-100)
100: 极度贪婪 (顶部)
50: 公允价值
0: 极度恐惧 (底部)
5. 使用建议
周期: 仅限日线 (1D) 或周线 (1W)。
原因: 底层数据源(M2, PMI)是月度更新的。标普500和算力是日度更新的。在日内图表(如15分钟、1小时、4小时)上使用此指标没有任何意义,因为基本面数据不会变化得那么快。
长期视角: 这是一个宏观周期指标,旨在识别数月甚至数年的周期顶部和底部,而非用于日内交易。
6. 免责声明
本指标仅供教育和参考使用,不构成任何财务建议。该模型依赖于历史相关性,未来可能不再适用。所有交易均涉及风险。GW Capital 及制作者不对任何交易损失承担责任。
🇺🇸 English Guide (英文说明)
1. Introduction
This indicator was created by GW Capital using Gemini Vibe Coding technology. It leverages advanced AI coding capabilities to reconstruct complex macroeconomic models into actionable trading tools.
2. Credits
Special thanks to the original model author, Marty Kendall. His research into the correlation between Bitcoin's price and macroeconomic factors lays the foundation for this algorithm.
3. Model Principles & Formula
This model calculates the "Fair Value" of Bitcoin based on four key macroeconomic pillars. It assumes that Bitcoin's price is a function of Global Liquidity, Network Security, Risk Appetite, and the Economic Cycle.
The Formula
$$\ln(BTC) = \alpha + (1 + \beta \cdot PMI_{z}) \times $$
Global Liquidity (M2): Sum of M2 supply from US, China, Eurozone, and Japan (converted to USD). Represents the pool of fiat money available to flow into assets.
Network Security (Hashrate): Bitcoin's hashrate, representing the physical security and utility of the network.
Risk Appetite (S&P 500): Used as a proxy for global risk sentiment.
Economic Cycle (PMI Z-Score): US Manufacturing PMI is used to amplify or dampen the valuation based on where we are in the business cycle (Expansion vs. Contraction).
4. How to Use
The indicator plots the Fair Value (White Line) and four sentiment bands based on statistical deviation (Z-Score).
Sentiment Zones
🚨 Extreme Greed (Red Zone): Price > +0.3 StdDev. Historically indicates a market top or overheated sentiment.
⚠️ Greed (Orange Zone): Price > +0.15 StdDev. Bullish momentum is strong but caution is advised.
⚖️ Fair Value (White Line): The theoretical "correct" price based on macro data.
😨 Fear (Teal Zone): Price < -0.15 StdDev. Undervalued territory.
💎 Extreme Fear (Green Zone): Price < -0.3 StdDev. Historically a generational buying opportunity.
Sentiment Score (0-100)
100: Maximum Greed (Top)
50: Fair Value
0: Maximum Fear (Bottom)
5. Usage Recommendations
Timeframe: Daily (1D) or Weekly (1W) ONLY.
Reason: The underlying data sources (M2, PMI) are updated monthly. The S&P 500 and Hashrate are daily. Using this indicator on intraday charts (e.g., 15m, 1h, 4h) adds no value because the fundamental data does not change that fast.
Long-Term View: This is a macro-cycle indicator designed for identifying cycle tops and bottoms over months and years, not for day trading.
6. Disclaimer
This indicator is for educational and informational purposes only. It does not constitute financial advice. The model relies on historical correlations which may not hold true in the future. All trading involves risk. GW Capital and the creators assume no responsibility for any trading losses.

The Biz (ADX/DI/RSI Revised)This is an indicator that will help you trade the GEX, showing when price is trending hard, or about to reverse, and will guide you in picking direction and bias. (INDICATOR SLIGHTLY LAGS)

OTA ATR Stop BufferOTA ATR indicator calculates and displays the Daily Average True Range (ATR), and two customizable ATR percentage values in a clean table format. It provides values in ticks and points, helping traders set stop-loss buffers based on market volatility.

S&P 500 Breadth: Bull vs Bear (20DMA)S&P 500 Breadth: Bull vs Bear (20DMA)
Use as simple market breadth
Strategy: HMA 50 + Supertrend SniperHMA 50 + Supertrend Confluence Strategy (Trend Following with Noise Filtering)
Description:
Introduction and Concept This strategy is designed to solve a common problem in trend-following trading: Lag vs. False Signals. Standard Moving Averages often lag too much, while price action indicators can generate false signals during choppy markets. This script combines the speed of the Hull Moving Average (HMA) with the volatility-based filtering of the Supertrend indicator to create a robust "Confluence System."
The primary goal of this script is not just to overlay two indicators, but to enforce a strict rule where a trade is only taken when Momentum (HMA) and Volatility Direction (Supertrend) are in perfect agreement.
Why this combination? (The Logic Behind the Mashup)
Hull Moving Average (HMA 50): We use the HMA because it significantly reduces lag compared to SMA or EMA by using weighted calculations. It acts as our primary Trend Direction detector. However, HMA can be too sensitive and "whipsaw" during sideways markets.
Supertrend (ATR-based): We use the Supertrend (Factor 3.0, Period 10) as our Volatility Filter. It uses Average True Range (ATR) to determine the significant trend boundary.
How it Works (Methodology) The strategy uses a boolean logic system to filter out low-quality trades:
Bullish Confluence: The HMA must be rising (Slope > 0) AND the Close Price must be above the Supertrend line (Uptrend).
Bearish Confluence: The HMA must be falling (Slope < 0) AND the Close Price must be below the Supertrend line (Downtrend).
The "Choppy Zone" (Noise Filter): This is a unique feature of this script. If the HMA indicates one direction (e.g., Rising) but the Supertrend indicates the opposite (e.g., Downtrend), the market is considered "Choppy" or indecisive. In this state, the script paints the candles or HMA line Gray and exits all positions (optional setting) to preserve capital.
Visual Guide & Signals To make the script easy to interpret for traders who do not read Pine Script, I have implemented specific visual cues:
Green Cross (+): Indicates a LONG entry signal. Both HMA and Supertrend align bullishly.
Red Cross (X): Indicates a SHORT entry signal. Both HMA and Supertrend align bearishly.
Thick Line (HMA): The main line changes color based on the trend.
Green: Bullish Confluence.
Red: Bearish Confluence.
Gray: Divergence/Choppy (No Trade Zone).
Thin Step Line: This is the Supertrend line, serving as your dynamic Trailing Stop Loss.
Strategy Settings
HMA Length: Default is 50 (Mid-term trend).
ATR Factor/Period: Default is 3.0/10 (Standard for trend catching).
Exit on Choppy: A toggle switch allowing users to decide whether to hold through noise or exit immediately when indicators disagree.
Risk Warning This strategy performs best in trending markets (Forex, Crypto, Indices). Like all trend-following systems, it may experience drawdown during prolonged accumulation/distribution phases. Please backtest with your specific asset before using it with real capital.

STRAT - MTF Dashboard + FTFC + Reversals v2.7# STRAT Indicator - Complete Description
## Overview
A comprehensive multi-timeframe STRAT trading system indicator that combines market structure analysis, flip levels, Full Timeframe Continuity (FTFC), and reversal pattern detection across 12 timeframes.
## Core Features
### 1. **Multi-Timeframe STRAT Dashboard**
- Displays STRAT combos (1, 2u, 2d, 3) across 12 timeframes: 1m, 5m, 15m, 30m, 1H, 4H, 12H, Daily, Weekly, Monthly, Quarterly, Yearly
- Color-coded directional bias (green/red/doji)
- Inside bars (●) and Outside bars (●) highlighted
- Current timeframe marked with ★
### 2. **HTF Flip Levels with Smart Grouping**
- Displays higher timeframe (HTF) flip levels (open prices) as labels on the right side
- Automatically groups multiple timeframes at the same price level (e.g., "★ 1H/4H/D")
- Current timeframe flip level always displayed with ★ marker
- Color-coded: Green (above price) / Red (below price)
### 3. **Full Timeframe Continuity (FTFC)**
- User-selectable 4 timeframes for FTFC analysis (default: D, W, M, Q)
- Green line: FTFC Up (highest open of 4 timeframes)
- Red line: FTFC Down (lowest open of 4 timeframes)
- Identifies when price is above/below all 4 timeframe opens
### 4. **Hammer & Shooting Star Detection**
- **Hammer Pattern**: Long lower wick (≥2x body), small upper wick, signals potential bottom reversal
- **Shooting Star Pattern**: Long upper wick (≥2x body), small lower wick, signals potential top reversal
- Scans last 100 bars (adjustable) and marks ALL historical patterns
- Chart markers: 🔨 (Hammer) below bars, 🔻 (Shooting Star) above bars
- Dashboard column shows reversal patterns for each timeframe
- Adjustable wick-to-body ratio sensitivity (1.5 to 5.0)
### 5. **Debug Tables**
- **FTFC Debug**: Shows close vs. 4 timeframe opens, confirms all-green/all-red conditions
- **Reversal Debug**: Real-time analysis of current bar - body size, wick measurements, ratios, and pattern qualification
## Settings
### Display Settings
- Dashboard position (9 options: top-left to bottom-right)
- Dashboard text size (tiny to huge)
- Label offset and text size
- Toggle individual features on/off
### FTFC Settings
- Select 4 custom timeframes for continuity analysis
- Default: Daily, Weekly, Monthly, Quarterly
### Reversal Settings
- **Wick to Body Ratio**: Sensitivity for pattern detection (default 2.0)
- **Lookback Bars**: How many historical bars to scan (default 100, max 500)
- Show/hide reversal markers on chart
- Show/hide reversal debug table
## Use Cases
1. **Momentum Trading**: Identify STRAT setups (2-2, 2-1-2 reversals, 3-bar plays) across multiple timeframes
2. **Swing Trading**: Use HTF flip levels as support/resistance and FTFC for trend confirmation
3. **Reversal Trading**: Catch hammer/shooting star patterns at key levels for counter-trend entries
4. **Multi-Timeframe Analysis**: Confirm alignment across timeframes before entering trades
## How to Use
### For STRAT Traders
- Look for 2-1-2 reversal setups in the dashboard
- Watch for inside bars (●) at HTF flip levels for breakout trades
- Use outside bars (●) to identify potential volatility expansion
### For Reversal Traders
- 🔨 Hammers after downtrends = potential long entries
- 🔻 Shooting stars after uptrends = potential short entries
- Combine with HTF flip levels for high-probability setups
### For Trend Followers
- FTFC green line above = bullish structure
- FTFC red line below = bearish structure
- Enter when price breaks and holds above/below FTFC levels
## Visual Elements
- **Green Labels**: HTF flip levels above current price (resistance)
- **Red Labels**: HTF flip levels below current price (support)
- **Lime Line**: FTFC Up (highest timeframe open)
- **Red Line**: FTFC Down (lowest timeframe open)
- **🔨 Icon**: Hammer pattern (potential reversal up)
- **🔻 Icon**: Shooting Star pattern (potential reversal down)
- **★ Symbol**: Current timeframe or multiple timeframes grouped
## Performance Notes
This indicator performs 12 multi-timeframe security calls and may take 15-30 seconds to calculate on initial load. This is normal for comprehensive MTF analysis.
## Version
v2.7 - Simplified reversal detection, current TF labeling, optimized performance
---
**Perfect for**: STRAT traders, multi-timeframe analysts, reversal pattern traders, swing traders looking for high-probability setups with confluence across timeframes.

OBV + WaveTrend Volume Scalper [GratefulFutures]This script is a combination script of three different strategies that provides buy and sell signals based on the change of volume with momentum confirmations.
Sources used:
This script relies on the outstanding scripts of the great script writer LazyBear: LazyBear
The following scripts were used in this publication:
1. A modified "On-Balance Volume Oscillator" modified from LazyBear's original script:
2. Wavetrend Oscillator with crosses, Author: LazyBear
3. Squeeze Momentum Oscillator, Author: LazyBear
This script functions based on the following criteria being true:
1. On balance volume oscillator turning from negative to positive (buy) or positive to negative (sell)
2. Squeeze Momentum value is increasing (buy) or decreasing (sell)
3. Wavetrend 1 (wt1) is greater than wavetrend 2 (wt2) (buy)/ Wavetrend 1 (wt1) is less than wavetrend 2 (wt2) (sell)
By combining these factors the indicator is able to signal exactly when net buying turns to net selling (OBV) and when this change is most advantageous to continue based on the momentum and price action of the underlying asset (SQMOMO and Wavetrend).
This allows you to pair volume and price action for a powerful tool to identify where price will reverse or continue providing exceptional entries for short term trades, especially when combined with other aspects such as support and resistance, or volume profile.
How to use:
Simply adjust the settings to your preference and read the given signals as generated.
Settings
There are multiple ways to tune the signals generated. It is set standard for my preferred use on a 1 minute chart.
OBV Oscillator Settings
The first 4 dropdowns in the Inputs section tune the On Balance Volume Oscillator (OBVO) portion of the indicator. You can choose if you want it to calculate based on close, open, high, low, or other value.
The most impactful in the entire settings is going to be the length and smoothing of the OBVO EMA. Making this number lower increasing the sensitivity to changes in volume, making the signals come quicker but is more susceptible to quick fluctuations. A value of between (5-20) is reasonable for the OBVO EMA length. There is a separate smoothing factor titled OBV Smoothing Length and below that, OBV Smoothing Type , a value of (2) is standard with "SMA" for smoothing type with a value of between 2-10 being reasonable. You may also play with these values to see what you like for your trading style.
Wavetrend Settings
The next 3 options are to modify the wavetrend portion of the indicator. I do not modify these from standard, and feel that they work appropriately on all time frames at the following values: n1 length (10), n2 length (20), Wavetrend Signal SMA length (4)
Squeeze Momentum Settings
The following 5 options through the end modify the Squeeze momentum portion of the indicator. The only one that modifies the signals generated is the KC Length , Making this number lower increasing the sensitivity to changes in price action, making the signals come quicker but is more susceptible to quick fluctuations. A value of between (18-25) is reasonable for KC Length .
Style Setting
You may select if you want to see the buy and sell signals. The following 5 options Raw OBV Osc through Squeeze Momentum allow you to see where each specific requirement was met, posted as a vertical line, but for live use it is recommended to turn all of these vertical lines off and only use the buy and sell signals.
Time Frames:
While this script is most effective on shorter time frames (1 minute for scalping and daytrading) it is also viable to use it on longer timeframes, due to the nature of its components being independent of time frame.
Examples of use - (Green and red vertical lines are for visualization purpose and are not part of the script)
SPY 1 Minute (Factory Settings):
SPX 15 minutes (Factory Settings):
Considerations
This script is meant primarily for short term trading, trades on the basis of seconds to minutes primarily. While they can be a good indication of volume lining up with momentum, it is always wise to use them in combination with other factors such as support, resistance, market structure, volume levels, or the many other techniques out there...
As Always... Happy Trading.
-Not_A_Mad_Scientist (GreatfulFutures Trade University)

Vdubus Divergence Wave Pattern Generator V1The Vdubus Divergence Wave Theory
10 years in the making & now finally thanks to AI I have attempted to put my Trading strategy & logic into a visual representation of how I analyse and project market using Core price action & MacD. Enjoy :)
A Proprietary Structural & Momentum Confluence SystemPart 1: The Strategic Concept1. The Core Philosophy: "Geometry + Physics"Traditional technical analysis often fails because traders confuse location with timing.Geometry (Price Patterns): Tells us WHERE the market is likely to reverse (e.g., at a resistance level or harmonic D-point).Physics (Momentum): Tells us WHEN the energy driving the trend has actually shifted. The Vdubus Theory posits that a trade should never be taken based on Geometry alone. A valid signal requires a specific, fractal decay in momentum—a "Handshake" between price structure and energy exhaustion.2. The 3-Wave Momentum Filter (The Engine)Most traders look for simple divergence (2 points). The Vdubus Theory demands a 3-Wave Structure to confirm the true state of the market.A. The Standard Reversal (Exhaustion)This is the "Safe" entry, catching the slow death of a trend.Wave 1 $\rightarrow$ 2 (The Warning): Price pushes higher, but momentum is lower (Standard Divergence). This signals that the trend is tapping the brakes.Wave 2 $\rightarrow$ 3 (The Confirmation): Price pushes to a final extreme (often a stop-hunt), but momentum is flat or lower than Wave 2 ("No Divergence").The Logic: This confirms that the buyers have expended all remaining energy. The engine is dead.
B. The Climax Reversal (The Trap)This is the "Aggressive" entry, catching V-shape reversals.Wave 1 $\rightarrow$ 2 (The Bait): Price pushes higher, and momentum is Stronger/Higher (No Divergence). This sucks in retail traders who believe the trend is accelerating.Wave 2 $\rightarrow$ 3 (The Snap): Price pushes again, but momentum suddenly collapses (Divergence).The Logic: A "Strong to Weak" shift. The market traps traders with a show of strength before hitting a "concrete wall" of limit orders.C. The Predator (The Trend Continuation)The Logic: Trends rarely move in straight lines. The "Predator" looks for Hidden Divergence during a pullback.The Signal: Price makes a Higher Low (Trend Structure Intact), but Momentum makes a Lower Low (Oversold Trap). This signals the end of the correction and the resumption of the main trend.3. The "Clean Path" PrincipleA trade is only valid if there is no opposing force. If you are looking to Sell (Bearish Reversal), the opposing Bullish momentum must be weak or neutral. If the "Enemy" is strong, the trade is skipped.
Part 2: The Indicator Breakdown
Tool Name: Vdubus Divergence Wave Pattern Generator V1
This script automates your analysis by combining ZigZag Pattern Recognition (Geometry) with your Custom MACD Logic (Physics).
1. The "Golden" Settings
The physics engine is tuned to your specific discovery:
Fast Length: 8
Slow Length: 21
Signal Length: 5
Lookback: 3 (Sensitive enough to catch the exact pivot points).
2. Signal Generation Logic
The indicator scans for four distinct setups. Here is the exact logic code translated into English:
Signal 1: Standard Reversal (Green/Red Pattern)
Geometry: The ZigZag algorithm identifies a 5-point structure (X-A-B-C-D), such as a Gartley, Bat, or Butterfly.
Physics Check:
Finds the last 3 momentum peaks matching the price highs.
Rule: Momentum Peak 2 must be < Peak 1 (Divergence).
Rule: Momentum Peak 3 must be <= Peak 2 (Confirmation/No Div).
Output: Draws the colored pattern and labels it (e.g., "Bearish Gartley (Exhaustion)").
Signal 2: Climax Reversal (Orange Pattern)
Geometry: Identifies the same 5-point structures.
Physics Check:
Rule: Momentum Peak 2 is >= Peak 1 (Strength/No Div).
Rule: Momentum Peak 3 is < Peak 2 (Sudden Failure/Div).
Output: Draws the pattern in Orange labeled "⚠️ CLIMAX REVERSAL". This is your "Trap" detector.
Signal 3: Rounded Top/Bottom (Navy/Maroon Label)
Geometry: Price is compressing or rounding over.
Physics Check:
Scans for 4 consecutive waves of momentum decay.
Rule: Peak 1 > Peak 2 > Peak 3 > Peak 4.
Output: Places a label indicating a "Multi-Wave Decay," identifying turns that don't have sharp pivots.
Signal 4: The Predator (Purple Pattern)
Geometry: Identifies a trend pullback (Higher Low for Buys).
Physics Check:
Rule: Momentum makes a Lower Low while Price makes a Higher Low (Hidden Divergence).
Output: Draws a Purple pattern labeled "🦖 PREDATOR" to signal trend continuation.
3. The Confluence Dashboard
Located in the corner of the screen, this provides a final "Safety Check."
Logic: It compares the absolute value (strength) of the most recent Bearish Momentum Peak vs. the most recent Bullish Momentum Low.
Output:
Green (Bulls Strong): Buying pressure is dominant. Safe to Buy, Dangerous to Sell.
Red (Bears Strong): Selling pressure is dominant. Safe to Sell, Dangerous to Buy.
Grey (Neutral): Forces are balanced.
Summary of Potential
This system solves the "Trader's Dilemma" of entering too early or too late. By waiting for the 3rd Wave, you effectively filter out the market noise and only commit capital when the opposing side has structurally and physically collapsed. It transforms trading from a guessing game into a disciplined execution of identifying Geometric Exhaustion.
Logic 1 / PREVIOUS DIVERGENCE PROJECTS future TREND BREAKS / Reversals *Not in script*
Logic 2 / Wave 1 to 2 = Divergence / Wave 2 to 3 = NO divergence = Signal
Reverse logic: Wave 1 to 2 = NO Divergence / Wave 2 to 3 = Divergence = Signal

ROC Bot AlertsA rules-based momentum scalping framework for short-term index futures
This indicator is designed for traders who focus on fast-moving, intraday momentum opportunities—particularly on lower timeframes such as the 1-minute chart. It uses a structured combination of trend filters and short-term momentum tools to help identify potential continuation entries during active market conditions.
Core Concept
The tool evaluates price behavior relative to a dynamic trend line while measuring short-term rate-of-change and directional strength. When all components align, the indicator highlights moments where the market may be transitioning into or sustaining momentum in one direction. Conversely, when conditions deteriorate or momentum weakens, the indicator suppresses signals to reduce noise and avoid choppy environments.
This approach aims to provide buy/sell signals for scalping in trending or expanding-volatility conditions.
What the Indicator Uses
The system assesses several factors before confirming a potential momentum signal:
A dynamic trend filter to determine directional bias
A rate-of-change threshold to confirm short-term acceleration
A trend-strength component to avoid signals during low-energy or ranging conditions
A cooldown mechanism to prevent rapid, back-to-back signals in unsettled areas
Only when all conditions align does the indicator paint a long or short trigger on the chart.
Intended Use
This tool is best suited for:
- Active scalpers
- Intraday index futures traders (NQ, ES, GC, etc.)
- Short-duration momentum traders
- Traders who prefer clean, rules-based decision making
It is not designed for swing trading, long-term trend following, or counter-trend strategies.
How to Read the Signals
- Buy markers appear when trend, momentum, and strength all support upward continuation.
- Sell markers appear when these same factors align in the opposite direction.
- The 90-period trend line can be shown or hidden based on user preference, but it remains part of the decision framework internally.
- The user may optionally adjust the momentum threshold (ROC%) to suit different volatility environments.
Important Notes
Signals are generated only on completed bars.
As with all technical tools, this should be used alongside proper risk and trade management practices.

SVE Pivot PointsSVE Pivot Points are a modified variation of traditional pivot points created by Sylvain Vervoort (SVE). They are designed to adapt more dynamically to price volatility and short-term market structure, giving traders more responsive support and resistance levels.
Unlike standard floor pivots that rely only on the previous period’s high/low/close, SVE Pivot Points incorporate volatility-based smoothing, making the levels more stable during choppy markets and more reactive when volatility expands.
1. Volatility-Adaptive Formulas
SVE uses smoothing techniques (often EMA-based or Vervoort’s proprietary volatility filters) that adjust to current market noise.
This reduces false levels and gives clearer reaction zones.
2. Dynamic Support & Resistance
You still get:
• Pivot (P)
• Support levels (S1, S2, S3)
• Resistance levels (R1, R2, R3)
But they update based on volatility-weighted highs/lows instead of raw numbers.
3. More Reliable in Intraday Trading
SVE pivot points were designed to:
• Improve accuracy
• Reduce whipsaw
• Give better intraday turning points
This is why they’re popular among futures, forex, and index traders.

One for AllOne for All (OFA) - Complete ICT Analysis Suite
Version 3.3.0 by theCodeman
📊 Overview
One for All (OFA) is a comprehensive TradingView indicator designed for traders who follow Inner Circle Trader (ICT) concepts. This all-in-one tool combines essential ICT analysis features—sessions, kill zones, previous period levels, and higher timeframe candles with Fair Value Gaps (FVGs) and Volume Imbalances (VIs)—into a single, highly customizable indicator. Whether you're a beginner learning ICT concepts or an experienced trader refining your edge, OFA provides the visual structure needed for precise market analysis and execution.
✨ Key Features
- 🏷️ Customizable Watermark**: Display your trading identity with customizable titles, subtitles, symbol info, and full style control
- 🌍 Trading Sessions**: Visualize Asian, London, and New York sessions with high/low lines, range boxes, and open/close markers
- 🎯 Kill Zones**: Highlight 5 critical ICT kill zones with precise timing and visual boxes
- 📈 Previous Period H/L**: Track Daily, Weekly, and Monthly highs/lows with customizable styles and lookback periods
- 🕐 Higher Timeframe Candles**: Display up to 5 HTF timeframes with OHLC trace lines, timers, and interval labels
- 🔍 FVG & VI Detection**: Automatically detect and visualize Fair Value Gaps and Volume Imbalances on HTF candles
- ⚙️ Universal Timezone Support**: Works globally with GMT-12 to GMT+14 timezone selection
- 🎨 Full Customization**: Control colors, styles, visibility, and layout for every feature
🚀 How to Use
Watermark Setup
The watermark overlay helps you identify your charts and maintain focus on your trading principles:
1. Enable/disable watermark via "Show Watermark" toggle
2. Customize the title (default: "Name") to display your trading name or account identifier
3. Set up to 3 subtitles (default: "Patience", "Confidence", "Execution") as trading reminders
4. Choose position (9 locations available), size, color, and transparency
5. Toggle symbol and timeframe display as needed
Use Case: Display your trading principles or account name for multi-monitor setups or content creation.
Trading Sessions Analysis
Sessions define market character and liquidity availability:
1. Enable "Show All Sessions" to visualize all three sessions
2. Adjust timezone to match your local market (default: UTC-5 for EST)
3. Customize session times if needed (defaults cover standard hours)
4. Enable session range boxes to see consolidation zones
5. Use session high/low lines to identify key levels for the current session
6. Enable open/close markers to track session transitions
Use Case: Identify which session you're trading in, track session highs/lows for liquidity, and anticipate session transition volatility.
Kill Zones Trading
Kill zones are ICT's high-probability trading windows:
1. Enable individual kill zones or use "Show All Kill Zones"
2. **Asian Kill Zone** (2000-0000 GMT): Early positioning and smart money accumulation
3. **London Kill Zone** (0300-0500 GMT): European market opening volatility
4. **NY AM Kill Zone** (0930-1100 EST): Post-NYSE open expansion
5. **NY Lunch Kill Zone** (1200-1300 EST): Midday consolidation or manipulation
6. **NY PM Kill Zone** (1330-1600 EST): Afternoon positioning and closes
7. Customize colors and times to match your trading style
8. Set max days display to control historical visibility (default: 30 days)
Use Case: Focus entries during high-probability windows. Watch for liquidity sweeps at kill zone openings and institutional positioning.
Previous Period High/Low Levels
Previous period levels act as magnetic price targets and support/resistance:
1. Enable Daily (PDH/PDL), Weekly (PWH/PWL), or Monthly (PMH/PML) levels individually
2. Set lookback period (how many previous periods to display)
3. Choose line style: Solid (current emphasis), Dashed (standard), or Dotted (subtle)
4. Customize colors per timeframe for visual hierarchy
5. Adjust line width (1-5) for visibility preference
6. Enable gradient effect to fade older periods
7. Position labels left or right based on chart layout
8. Customize label text for your preferred notation
Use Case: Identify key levels where price is likely to react. Daily levels work on intraday timeframes, Weekly on daily charts, Monthly for swing trading.
Higher Timeframe (HTF) Candles
HTF candles reveal the larger market context while trading lower timeframes:
1. Enable up to 5 HTF slots simultaneously (default: 5m, 15m, 1H, 4H, Daily)
2. Choose display mode: "Below Chart" (stacked rows) or "Right Side" (compact column)
3. Customize timeframe, colors (bull/bear), and titles for each slot
4. **OHLC Trace Lines**: Visual lines connecting HTF candle levels to chart bars
5. **HTF Timer**: Countdown showing time remaining until HTF candle close
6. **Interval Labels**: Display day of week (Daily+) or time (intraday) on each candle
7. For Daily candles: Choose open time (Midnight, 8:30, 9:30) to match your market structure preference
Use Case: Trade lower timeframes while respecting higher timeframe structure. Watch for HTF candle closes to confirm directional bias.
FVG & VI Detection
Fair Value Gaps and Volume Imbalances highlight inefficiencies that price often revisits:
1. **Fair Value Gaps (FVGs)**: Detected when HTF candle wicks don't overlap between 3 consecutive candles
- Bullish FVG: Gap between candle 1 high and candle 3 low (green box by default)
- Bearish FVG: Gap between candle 1 low and candle 3 high (red box by default)
2. **Volume Imbalances (VIs)**: Similar detection but focuses on body gaps
- Bullish VI: Gap between candle 1 close and candle 3 open
- Bearish VI: Gap between candle 1 open and candle 3 close
3. Enable FVG/VI detection per HTF slot individually
4. Customize colors and transparency for each imbalance type
5. Boxes appear on chart at formation and remain visible as retracement targets
**Use Case**: Identify high-probability retracement zones. Price often returns to fill FVGs and VIs before continuing the trend. Use as entry zones or profit targets.
🎨 Customization
OFA is built for flexibility. Every feature includes extensive customization options:
Visual Customization
- **Colors**: Independent color control for every element (sessions, kill zones, lines, labels, FVGs, VIs)
- **Transparency**: Adjust box and label transparency (0-100%) for clean charts
- **Line Styles**: Choose Solid, Dashed, or Dotted for previous period lines
- **Sizes**: Control text size, line width, and box borders
- **Positions**: Place watermark in 9 positions, labels left/right
Layout Control
- **HTF Display Mode**: "Below Chart" for detailed analysis, "Right Side" for space efficiency
- **Drawing Limits**: Set max days for sessions/kill zones to manage chart clutter
- **Lookback Periods**: Control how many previous periods to display (1-10)
- **Gradient Effects**: Enable fading for older previous period lines
Timing Adjustments
- **Timezone**: Universal GMT offset selector (-12 to +14) for global markets
- **Session Times**: Customize each session's start/end times
- **Kill Zone Times**: Adjust kill zone windows to match your market's characteristics
- **Daily Open**: Choose Midnight, 8:30, or 9:30 for Daily HTF candle open time
💡 Best Practices
1. Start Simple: Enable one feature at a time to learn how each element affects your analysis
2. Match Your Timeframe: Use Daily levels on intraday charts, Weekly on daily charts, HTF candles one or two levels above your trading timeframe
3. Kill Zone Focus: Concentrate your trading activity during kill zones for higher probability setups
4. HTF Confirmation: Wait for HTF candle closes before committing to directional bias
5. FVG/VI Entries: Look for price to return to unfilled FVGs/VIs for entry opportunities with favorable risk/reward
6. Customize Colors: Use a consistent color scheme that matches your chart theme and reduces visual fatigue
7. Reduce Clutter: Disable features you're not actively using in your current trading plan
8. Session Context: Understand which session controls the market—trade with session direction or anticipate reversals at session transitions
⚙️ Settings Guide
OFA organizes settings into logical groups for easy navigation:
- **═══ WATERMARK ═══**: Title, subtitles, position, style, symbol/timeframe display
- **═══ SESSIONS ═══**: Enable/disable sessions, times, colors, high/low lines, boxes, markers
- **═══ KILL ZONES ═══**: Individual kill zone toggles, times, colors, max days display
- **═══ PREVIOUS H/L - DAILY ═══**: Daily high/low lines, style, color, lookback, labels
- **═══ PREVIOUS H/L - WEEKLY ═══**: Weekly high/low lines, style, color, lookback, labels
- **═══ PREVIOUS H/L - MONTHLY ═══**: Monthly high/low lines, style, color, lookback, labels
- **═══ HTF CANDLES ═══**: Global display mode, layout settings
- **═══ HTF SLOT 1-5 ═══**: Individual HTF configuration (timeframe, colors, title, FVG/VI detection, trace lines, timer, interval labels)
Each setting includes tooltips explaining its function. Hover over any input for detailed guidance.
📝 Final Notes
One for All (OFA) represents a complete ICT analysis toolkit in a single indicator. By combining watermark customization, session visualization, kill zone highlighting, previous period levels, and higher timeframe candles with FVG/VI detection, OFA eliminates the need for multiple indicators cluttering your chart.
**Version**: 3.3.0
**Author**: theCodeman
**Pine Script**: v6
**License**: Mozilla Public License 2.0
Start with default settings to learn the indicator's structure, then customize extensively to match your personal trading style. Remember: tools provide information, but your edge comes from disciplined execution of a proven strategy.
Happy Trading! 📈

Buy after 3 Red Candles - Close > Last Red Highthree red candles broken by one green candle, bullish signal

IU Momentum OscillatorDESCRIPTION:
The IU Momentum Oscillator is a specialized trend-following tool designed to visualize the raw "energy" of price action. Unlike traditional oscillators that rely solely on closing prices relative to a range (like RSI), this indicator calculates momentum based on the ratio of bullish candles over a specific lookback period.
This "Neon Edition" has been engineered with a focus on visual clarity and aesthetic depth. It utilizes "Shadow Plotting" to create a glowing effect and dynamic "Trend Clouds" to highlight the strength of the move. The result is a clean, modern interface that allows traders to instantly gauge market sentiment—whether the bulls or bears are in control—without cluttering the chart with complex lines.
USER INPUTS:
- Momentum Length (Default: 20): The number of past candles analyzed to count bullish occurrences.
- Momentum Smoothing (Default: 20): An SMA filter applied to the raw data to reduce noise and provide a cleaner wave.
- Signal Line Length (Default: 5): The length of the EMA signal line used to generate crossover signals and the "Trend Cloud."
- Overbought / Oversold Levels (Default: 60 / 40): Thresholds that define extreme market conditions.
- Colors: Fully customizable Neon Cyan (Bullish) and Neon Magenta (Bearish) inputs to match your chart theme.
LONG CONDITION:
- Signal: A Buy signal is indicated by a small Cyan Circle.
- Logic: Occurs when the Main Momentum Line (Glowing) crosses ABOVE the Grey Signal Line.
- Visual Confirmation: The "Trend Cloud" turns Cyan and expands, indicating that bullish momentum is accelerating relative to the recent average.
SHORT CONDITIONS:
- Signal: A Sell signal is indicated by a small Magenta Circle.
- Logic: Occurs when the Main Momentum Line (Glowing) crosses BELOW the Grey Signal Line.
- Visual Confirmation: The "Trend Cloud" turns Magenta, indicating that bearish pressure is increasing.
WHY IT IS UNIQUE:
1. Candle-Count Logic: Most oscillators calculate price distance. This indicator calculates price participation (how many candles were actually green vs red). This offers a different perspective on trend sustainability.
2. Optimized Performance: The script uses math.sum functions rather than heavy for loops, ensuring it loads instantly and runs smoothly on all timeframes.
3. Visual Hierarchy: It uses dynamic gradients and transparency (Alpha channels) to create a "Glow" and "Cloud" effect. This makes the chart easier to read at a glance compared to flat, single-line oscillators.
HOW USER CAN BENEFIT FROM IT:
- Trend Confirmation: Traders can use the "Trend Cloud" to stay in trades longer. As long as the cloud is thick and colored, the trend is strong.
- Divergence Spotting: Because this calculates momentum differently than RSI, it can often show divergences (price goes up, but the count of bullish candles goes down) earlier than standard tools.
- Scalping: The crisp crossover signals (Circles) provide excellent entry triggers for scalpers on lower timeframes when combined with key support/resistance levels.
DISCLAIMER:
This source code and the information presented here are for educational and informational purposes only. It does not constitute financial, investment, or trading advice.
Trading in financial markets involves a high degree of risk and may not be suitable for all investors. You should not rely solely on this indicator to make trading decisions. Always perform your own due diligence, manage your risk appropriately, and consult with a qualified financial advisor before executing any trades.

Volatility Regime NavigatorA guide to understanding VIX, VVIX, VIX9D, VVIX/VIX, and the Composite Risk Score
1. Purpose of the Indicator
This dashboard summarizes short-term market volatility conditions using four core volatility metrics.
It produces:
• Individual readings
• A combined Regime classification
• A Composite Risk Score (0–100)
• A simplified Risk Bucket (Bullish → Stress)
Use this to evaluate market fragility, drift potential, tail-risk, and overall risk-on/off conditions.
This is especially useful for intraday ES/NQ trading, expected-move context, and understanding when breakouts or fades have edge.
2. The Four Core Volatility Inputs
(1) VIX — Baseline Equity Volatility
• < 16: Complacent (easy drift-up, but watch for fragility)
• 16–22: Healthy, normal volatility → ideal trading conditions
• > 22: Stress rising
• > 26: Tail-risk / risk-off environment
(2) VIX9D — Short-Term Event Vol
Measures 9-day implied volatility. Reacts to immediate news/events.
• < 14: Strongly bullish (drift regime)
• 14–17: Bullish to neutral
• 17–20: Event risk building
• > 20: Short-term stress / caution
(3) VVIX — Volatility of VIX (fragility index)
Tracks volatility of volatility.
• < 100: “Bullish, Bullish” — very low fragility
• 100–120: Normal
• 120–140: Fragile
• > 140: Stress, hedging pressure
(4) VVIX/VIX Ratio — Microstructure Risk-On/Risk-Off
One of the most sensitive indicators of market confidence.
• 5.0–6.5: Strongest “normal/bullish” zone
• < 5.0: Bottom-stalking / fear regime
• > 6.5: Complacency → vulnerable to reversals
• > 7.5: Fragile / top-risk
3. Composite Risk Score (0–100)
The dashboard converts all four inputs into a single score.
Score Interpretation
• 80–100 → Bullish - Drift regime. Shallow pullbacks. Upside favored.
• 60–79 → Normal - Healthy tape. Balanced two-way trading.
• 40–59 → Fragile - Choppy, failed breakouts, thinner liquidity.
• 20–39 → Risk-Off - Downside tails active. Favor fades and defensive behavior.
• < 20 → Stress - Crisis or event-driven tape. Avoid longs.
Score updates every bar.
4. Regime Label
Independent of the composite score, the script provides a Regime classification based on combinations of VIX + VVIX/VIX:
• Bullish+ → Buying is easy, tape lifts passively
• Normal → Cleanest and most tradable conditions
• Complacent → Top-risk; be careful chasing upside
• Mixed → Signals conflict; chop potential
• Bottom Stalk → High VIX, low VVIX/VIX (capitulation signatures)
A trailing “+” or “*” indicates additional bullish or caution overlays from VIX9D/VVIX.
5. How to Use the Dashboard in Trading
When Bullish (Score ≥ 80):
• Expect drift-up behavior
• Downside limited unless catalyst hits
• Structure favors breakouts and trend continuation
• Mean reversion trades have lower expectancy
When Normal (Score 60–79):
• The “playbook regime”
• Breakouts and mean reversion both valid
• Best overall trading environment
When Fragile (Score 40–59):
• Expect chop
• Breakouts fail
• Take quicker profits
• Avoid overleveraged directional bets
When Risk-Off (20–39):
• Favor fades of strength
• Downside tails activate
• Trend-following short setups gain edge
• Respect volatility bands
When Stress (<20):
• Avoid long exposure
• Do not chase dips
• Expect violent, news-sensitive behavior
• Position sizing becomes critical
6. Quick Summary
• VIX = weather
• VIX9D = short-term storm radar
• VVIX = foundation stability
• VVIX/VIX = confidence vs fragility
• Composite Score = overall regime health
• Risk Bucket = simple “what do I do?” label
This dashboard gives traders a high-confidence, low-noise view of equity volatility conditions in real time.

RSI < 25 + Price Below 200 SMA (4H) - Text Signal
Price below 200MA on 4hr chart
RSI is below 25 ovsersold
Start buying small positions at every signal
Eventually price will capture the 200MA on 4hr
This will work great for NVDA, AAPL, MSFT, NFLX, PANW, AMZN, PLTR, CRWD and META.
Good for swing trading based on price action, RSI oversold and reversal
Add more on the Pin bar candles on 4hr time frame once the price is oversold.

BTC - VERI - Valuation & Entity Ratio IndexVERI: Valuation & Entity Ratio IndexObservation-only.
Data: IntoTheBlock.
Overview & Philosophy
The name VERI is derived from the Latin Veritas (Truth). In a crypto market often driven by deceptive speculative noise, this indicator seeks to establish the "On-Chain Truth" of a price trend.
It operates on the thesis that price action is only sustainable when verified by high-conviction capital flows.VERI is a fundamental composite oscillator that fuses Entity Behavior (Who is holding?) with Network Valuation (Is the price fair?) to identify Bitcoin market cycle extremes.
The "Alpha"
Why this Composite stands out: on-chain metrics often tell only half the story.
MVRV tells you if the price is cheap, but not if anyone is actually buying.
Whale Activity tells you if large players are moving, but not if they are accumulating at a value discount.
VERI fuses these two dimensions into a single Z-Score. It identifies the rare, high-probability moments where Smart Money Conviction intersects with Deep Value.
Methodology
The Mathematics of VERI: The indicator constructs a composite index using three fundamental metrics from IntoTheBlock:
The "Who" (Entity Ratio) : We calculate the flow ratio between Whales (>1% supply holders) and Retail (<0.1% supply holders). A rising ratio indicates supply is transferring from weak hands to strong hands.
The "Why" (Valuation Multiplier) : We utilize the MVRV (Market Value to Realized Value) ratio. To isolate value opportunities, we use the inverse (1 / MVRV).
The Fusion : These factors are multiplied to create the raw VERI index.
Normalization & Inversion
We apply a rolling Z-Score (standard deviation from the mean) and invert the result.
How to Interpret the Indicator
Because the output is inverted, the visual logic matches price action intuitively:
🟥 Distribution Zone (High Values > 1.5):
The Signal: "Low Conviction Overvaluation."
Context: The price is historically expensive relative to the cost basis (High MVRV), and Whales are distributing coins to Retail.Implication: Historically precedes macro tops or deep corrections.
🟩 Accumulation Zone (Low Values < -1.5):
The Signal: "High Conviction Undervaluation."Context: The price is historically cheap (Low MVRV), and Whales are aggressively accumulating relative to Retail.
Implication: Historically precedes macro bottoms and generational entry points.
Zero Line : Represents the historical baseline. A crossover of the zero line often confirms a regime shift (e.g., from Bear to Bull).
Visual Guide & Features
Dynamic Coloring: The line turns Red in the Distribution Zone, Blue in the Accumulation Zone, and Orange during neutral trends.
Zone Labels: Static labels are pinned to the left side of the chart for immediate context.
The "Data Check" Monitor (Status Table): Since this indicator relies on third-party fundamental data, we have included a diagnostic table in the bottom-right corner.
Data Check Monitor Guide
STATUS: LIVE (Green): The indicator is functioning correctly. All data feeds (Whales, Retail, MVRV) are being retrieved successfully.
STATUS: WAIT (Red): The indicator cannot retrieve data. This might happen for some reasons, e.g. your TradingView plan may not support IntoTheBlock integration.
Settings
Lookback Period (Default: 365): The window used for Z-Score normalization. We use a full year to smooth out seasonal volatility.
Smoothing (Default: 7): A 7-day smoothing is applied to the signal to filter out daily noise.
Zone Thresholds: Users can customize the specific Z-Score levels for the Distribution and Accumulation bands.
Disclaimer
This script is for research and educational purposes only. It uses historical on-chain data to visualize market structure and does not constitute financial advice. Past performance of whale entities does not guarantee future results.
Tags
bitcoin, btc, on-chain, mvrv, whales, valuation, fundamentals, cycle, oscillator, veri

EMA + Sessions + RSI This is a simple on-demand indicator. It includes 3 customizable exponential moving averages, three customizable market sessions, and a table showing the status of the RSI
-3 Custom EMAs
-3 Custom Sessions
-1 RSI Table

Équilibre du Sentiment – Multi-Périodes (v6)
English
A unique and advanced sentiment indicator based on the harmonic mean of highs and lows over nested rolling windows.
How it works:
The neutral sentiment point is reached when positive sentiment equals negative sentiment, which corresponds to the situation where the percentage between the price and the minimum is equal to the percentage between the maximum and the price.
For each chosen period N, the script calculates N different "neutral feeling" values:
- One using the last 1 bar
- One using the last 2 bars
- …
- One using the last N bars
It then extracts the exact median of these N values using a sorted insertion method (no approximation).
This produces an extremely smooth, non-repainting equilibrium line that represents the true "central sentiment" of the market over the selected lookback.
Features:
- Up to 3 independent periods (365, 52, 26 by default – fully customizable)
- Optional background coloring (green/red) when price is above/below the main curve
- Clean labels on the last bar showing the current value for each active period
- Zero repainting – fully compatible with strategies and alerts
- Highly responsive even with very long periods (up to 3500 bars)
Great for:
- Identifying long-term fair value / equilibrium zones
- Building mean-reversion or breakout systems
Pure Pine Script® v6 – no external libraries, no security calls, no repainting-free.