ATR/ADR MTF Projection ArrayATR/ADR MTF Projection Array
Overview
A powerful predictive tool that projects ATR (Average True Range) and ADR (Average Daily Range) levels as clean support and resistance arrays on your chart. Designed for traders who want to anticipate the high and low of the day using volatility-based projections with multi-timeframe confluence.
This indicator combines traditional ATR analysis with ICT-style ADR methodology, giving you institutional-grade level projections from a single, customizable tool.
Key Features
🎯 Dual Volatility Metrics
ATR Projections — Classic volatility-based levels with full multi-timeframe support
ADR Projections (ICT Style) — Average Daily Range levels using Inner Circle Trader methodology
Enable/disable each independently based on your trading preference
📊 Multi-Timeframe ATR Analysis
Plot ATR levels from up to 3 timeframes simultaneously (Daily, Weekly, Monthly or custom)
Each timeframe displays with distinct styling for easy identification
Perfect for confluence trading across multiple time horizons
⚡ ICT ADR Methodology
NY Midnight calculation mode (ICT standard) or Classic Daily
Key ICT levels built-in:
1/3 ADR (Judas Swing) — Critical manipulation level where fake moves often terminate
1/2 ADR — Mid-range reference
2/3 ADR — Trending day continuation target
100% ADR — Full daily range completion
150% ADR — Extension target for expansion days
Two projection modes: Static (from anchor) or Dynamic (from session high/low)
🔧 Flexible Anchor Points
Previous Close (default)
Daily Open
Weekly Open
Monthly Open
Session Open
📈 Range Completion Tracking
Real-time display of how much of the expected daily range has been consumed
Visual status indicator helps identify when the day's move may be exhausted
How To Use
For Bias Confirmation:
Establish your directional bias using your preferred method (trigger day, market structure, etc.)
Monitor the 1/3 ADR level during London/NY open for potential Judas Swing (manipulation move)
Target 2/3 to 100% ADR for your HOD/LOD objective
For Target Setting:
Use ATR levels as volatility-based profit targets
ADR 100% level often marks session extremes
When Range Used reaches 100%+, expect consolidation or reversal
For Multi-Timeframe Confluence:
Enable Weekly/Monthly ATR levels alongside Daily
Look for clustering of levels across timeframes for high-probability zones
Settings Guide
Master Controls — Toggle ATR/ADR systems and bull/bear levels independently
ATR Settings — Configure period, multiplier, anchor point, and select which timeframes to display
ATR Level Multipliers — Choose which projection levels to show (0.5x, 0.75x, 1.0x, 1.25x, 1.5x)
ADR Settings (ICT Style) — Select calculation mode (NY Midnight recommended), period (5 days is ICT standard), and projection mode
ADR Level Selection — Toggle individual ICT levels (1/3, 1/2, 2/3, 100%, 150%)
Visual Settings — Customize colors, line styles, labels, and info table position
Alerts Included
ATR 1.0x Bull/Bear Cross
ADR 1/3 Judas Swing Zone (Bull/Bear)
ADR 100% Range Completion (Bull/Bear)
Penunjuk dan strategi

Daily Dual Pivots (Std + Fib) Extended by Jackel
簡介: 這個指標旨在為日內交易者提供最強大的支撐與阻力參考。它將市場上最常用的兩種 Pivot Points 計算方式——標準 (Standard) 與 斐波那契 (Fibonacci)——結合在同一個圖表中,讓你一眼就能看出關鍵的價格匯聚點 (Confluence Areas)。
主要特色:
雙重系統並存:
標準 Pivot (Standard):以 實線 (Solid Lines) 顯示。這是機構與大部分交易者使用的傳統支撐阻力位。
斐波那契 Pivot (Fibonacci):以 圓點/虛線 (Dotted Lines) 顯示。利用 Fib 黃金比例 (0.382, 0.618) 計算出的潛在反轉位。
清晰的視覺區分:標準版使用暖色系 (紅/綠/橙),Fib 版使用冷色系 (藍/紫),互不干擾,清晰易讀。
可選擴展關卡 (S4-S5 / R4-R5):預設顯示 P, R1-R3, S1-S3。如果市場波動劇烈,你可以在設定中開啟 "Show Extra Levels" 來顯示 R4/R5 及 S4/S5。
自動隱藏歷史:預設只顯示「當日」的線條,保持圖表整潔。如需回測,可開啟「顯示歷史數據」選項。
如何使用:
當 實線 (Standard) 與 虛線 (Fib) 重疊或非常接近時,該區域通常具有更強的支撐或阻力效力。
適用於 15分鐘、1小時或 4小時圖表操作日內交易。
Introduction: This indicator is designed for intraday traders who need precise Support & Resistance levels. It combines the two most popular Pivot Point calculation methods—Standard (Traditional) and Fibonacci—into a single chart, allowing you to easily identify key areas of confluence.
Key Features:
Dual System Strategy:
Standard Pivots: Displayed as Solid Lines. These represent the traditional structural levels used by most traders and institutions.
Fibonacci Pivots: Displayed as Dotted/Circle Lines. These use key Fibonacci ratios (0.382, 0.618) to identify potential reversal zones.
Visual Clarity: Different line styles and color groups allow you to distinguish between Standard and Fib levels instantly without chart clutter.
Extended Levels (Optional): By default, it shows P, R1-R3, and S1-S3. In highly volatile markets, you can enable "Show Extra Levels" in the settings to reveal S4/S5 and R4/R5.
Clean Chart: By default, it only shows levels for the current day. You can enable "Show History" in the settings if you need to backtest.
How to Use:
Look for Confluence: When a Solid Line (Standard) and a Dotted Line (Fib) overlap or are very close to each other, it indicates a very strong Support or Resistance zone.
Best used on 15m, 1H, or 4H charts for intraday analysis.

Bubbles + Clusters + SweepsIndicator For Bubbles + Clusters + Sweeps
✔ Volume bubbles
✔ Delta coloring (green/red intensity)
✔ Auto supply/demand zones
✔ Volume-profile style blocks inside zones
✔ Liquidity sweep markers
✔ Box drawings extending until filled
✔ Optional bubble filters (min-volume threshold)

N-Consecutive Candle Marker (SMA Filter & Consolidated Alert)Certainly, here is the English version of the Pine Script description for posting on TradingView.
---
## 📈 N-Consecutive Candle Marker (SMA Filter & Consolidated Alert)
### 📝 Overview
This indicator automatically displays a **signal mark** on the chart when a user-defined number ($N$) of **consecutive bullish or bearish candles** occurs.
It includes an optional **SMA (Simple Moving Average) filter** to restrict signals to conditions favoring a **short-term counter-trend (reversal) trade**. It also consolidates both bullish and bearish signals into a **single alert mechanism** for simplified management.
### ⚙️ Key Features
#### 1. N-Consecutive Candle Detection
* **Consecutive Count (N)**: The indicator detects continuous candles of the same color based on the `Consecutive Candle Count (N)` input setting.
* **Bullish Signal (Red Marker)**: A mark is placed above the high of the closing candle after the bullish sequence is complete.
* **Bearish Signal (Blue Marker)**: A mark is placed below the low of the closing candle after the bearish sequence is complete.
#### 2. SMA Filter (Counter-Trend Logic)
When **`Use SMA Filter`** is enabled, the signal conditions are filtered against the SMA, which focuses on potential **short-term bounces or pullbacks** against the broader trend.
* **Bullish Signal Condition**: The consecutive bullish candles must close **below** the SMA (`close < sma_value`). This typically targets a bounce in a downtrend.
* **Bearish Signal Condition**: The consecutive bearish candles must close **above** the SMA (`close > sma_value`). This typically targets a pullback/dip in an uptrend.
#### 3. Performance & Alert Consolidation
* **Display Limit**: Enabling **`Use Display Limit`** restricts the plotted marks to the **last N bars** defined by `Limit Display to Last N Bars`. This automatically deletes old labels, helping to **maintain chart performance**.
* **Consolidated Alert**: Both bullish and bearish signals trigger the same **single `alert()` function**, simplifying the process of setting up notifications in TradingView.
### 💡 How to Use
1. Add the indicator to your chart.
2. Set the **`Consecutive Candle Count (N)`** to your desired number of consecutive bars (e.g., 3, 4, etc.).
3. If you want to use the reversal filter, switch **`Use SMA Filter (On/Off)`** to **On**. Adjust the `SMA Period` as needed.
4. In the TradingView alert creation menu, select this indicator and choose **"Any function call"** or **"N-Consecutive Candle Marker (SMA Filter & Consolidated Alert)"** to set up your consolidated alert.
> ⚠️ **Disclaimer**: This indicator detects specific candle patterns. Always combine this signal with other forms of technical analysis and context for making trading decisions.
ご要望いただいたTradingViewに投稿する際のインジケーターの説明文として、機能、使い方、フィルターロジックに焦点を当てた文章を作成しました。
この説明文は、Pine Scriptの公開ライブラリの投稿テンプレートに合わせて、**概要、使い方、主要機能**を明確に伝える構造にしています。
---
## 📈 N-Consecutive Candle Marker (SMA Filter & Consolidated Alert)
### 📝 概要 (Overview)
このインジケーターは、設定した本数($N$)の**連続した陽線または陰線**が出現した際に、チャート上に**サイン(マーク)**を自動で表示します。
オプションで**SMA(単純移動平均線)フィルター**を適用することができ、トレンドの状況に応じた**短期的な逆張りサイン**に限定することが可能です。また、陽線サインと陰線サインを**一つのアラート**で統合して通知できるため、管理が容易です。
### ⚙️ 主要機能 (Key Features)
#### 1. N連続ローソク足の検出
* **連続本数の設定 (N)**: `Consecutive Candle Count (N)` の設定値に基づき、連続した同色ローソク足を検出します。
* **陽線サイン (Red Marker)**: 連続陽線が完了した足の高値の上にマークを表示します。
* **陰線サイン (Blue Marker)**: 連続陰線が完了した足の安値の下にマークを表示します。
#### 2. SMAフィルター (逆張りロジック)
`Use SMA Filter` を **オン** にすることで、サインの出現条件にトレンドフィルターを追加します。これは、トレンド方向に対する**一時的な反発・押し目**を狙う、**逆張り的なロジック**を採用しています。
* **陽線サインの出現条件**: 終値がSMAの**下**にある状態で、連続陽線が出現した場合。
* **陰線サインの出現条件**: 終値がSMAの**上**にある状態で、連続陰線が出現した場合。
#### 3. パフォーマンス最適化とアラート統合
* **表示制限**: `Use Display Limit` をオンにすると、描画されるマークの数を**直近のN本**に制限し、古いマークを自動で削除することで、チャート描画の**パフォーマンスを維持**します。
* **統合アラート**: 陽線・陰線どちらのサインが出た場合でも、**単一の `alert()` 関数**でメッセージを出し分けます。これにより、アラート設定をシンプルに保てます。
### 💡 使い方 (How to Use)
1. インジケーターをチャートに追加します。
2. **`Consecutive Candle Count (N)`** を希望する連続本数に設定します(例: 3本連続、4本連続など)。
3. トレンドフィルターを使用したい場合は、**`Use SMA Filter (On/Off)`** をオンに切り替えます。
4. TradingViewのアラート設定画面で、このインジケーターを選択し、**「どんな関数呼び出しでも」**または**「N-Consecutive Candle Marker (SMA Filter & Consolidated Alert)」**を選んでアラートを設定してください。
> ⚠️ **注意点**: このインジケーターは、連続足という特定のパターンのみを検出するものです。トレード判断を行う際は、他のテクニカル分析や環境認識と組み合わせてご利用ください。

Compression / ExpansionI created this Indicator to warn of compression and expansion so I could find the best area to trade I use it In conjunction with VWAP works on any timeframe and any asset where there is Volume
The Indicator produces a Letter C at the Start of Compression and a Letter E at the Start of Expansion you can change the settings to your liking On the chart my Expansion is in Red and compression is is Blue use In Conjunction with your favorite Indicators for Confluence

NeuroSwarm ETH — Crowd vs Experts Forecast TrackerEnglish:
NeuroSwarm — Crowd vs Experts Forecast Tracker (ETH)
This indicator visualizes monthly forecast data collected from two independent groups:
Crowd – a large sample of retail participants
Experts – a curated group of analysts and experienced market participants
For each month, the indicator plots the following values as horizontal levels on the price chart:
Median forecast (Crowd)
Average forecast (Crowd)
Median forecast (Experts)
Average forecast (Experts)
Shaded zones highlighting the difference between median and mean
All values are fixed for each month and stay unchanged historically.
This allows traders to analyze sentiment dynamics and compare how expectations from both groups align or diverge from actual price action.
Purpose:
This tool is intended for sentiment visualization and analytical insight — it does not generate trading signals.
Its main goal is to compare collective expectations of retail traders vs experts across time.
Data source:
All forecasts come from monthly surveys conducted within the NeuroSwarm project between the 1st and 5th day of each month.
Interface notice:
The script's UI may contain non-English labels for convenience, but a full English documentation is provided here in compliance with TradingView rules.
Русская версия:
NeuroSwarm — Мудрость Толпы vs Эксперты (ETH)
Индикатор отображает ежемесячные прогнозы двух групп:
Толпа: медиана и средняя прогнозов
Эксперты: медиана и средняя прогнозов
Значения фиксируются для каждого месяца и показываются горизонтальными уровнями.
Заливка отображает диапазон между медианой и средней, что упрощает визуальное сравнение настроений.
Это аналитический инструмент для визуализации настроений — не торговая стратегия.
Все данные берутся из ежемесячных опросов проекта NeuroSwarm.

Bayesian Liquidity Pain & Gain [Instit. Vol Weighted]Bayesian Liquidity Pain & Gain Indicator
Stop guessing where support and resistance are.
The Bayesian Liquidity Pain & Gain indicator moves beyond arbitrary lines and raw price action. It quantifies Institutional Intent by calculating the exact price levels where large volume has been accumulated and visualizes the "Pain" (stress) those participants feel when the market moves against them.
The Logic: Quantified Institutional Stress
Institutions don't trade single candles; they accumulate positions over time. This indicator tracks their Volume-Weighted Average Cost Basis to answer two critical questions:
Where did they enter? (The Cost Basis Lines)
Are they underwater? (The Pain Clouds)
By normalizing price distance using volatility (ATR) and statistical deviation (Z-Score), we filter out noise and only highlight zones where "Smart Money" is statistically forced to defend their positions or capitulate.
How to Read the Chart
1. The Cost Basis Lines (Anchors)
• 🟢 Green Line (Buyer Cost Basis): The average price where institutions accumulated long positions. This acts as dynamic Support.
• 🔴 Red Line (Seller Cost Basis): The average price where institutions accumulated short positions. This acts as dynamic Resistance.
2. The Pain Clouds (Signals)
When price moves significantly away from the cost basis (Z-Score > 2.0), "Clouds" appear to visualize the PnL status of the participants:
• 🔴 Red Cloud (Buyer Pain): Price is below the buyer's entry. Buyers are losing money (in the red). This creates a "Discount" zone where they may defend support.
• 🟢 Green Cloud (Seller Pain): Price is above the seller's entry. Sellers are losing money (shorts are squeezed). This indicates strong bullish momentum.
3. The Multi-Timeframe Dashboard
A real-time HUD showing the Z-Score status across 4 timeframes (1m, 5m, 15m, 1h):
• 🟢 Green: Profitable/Neutral (Trend Continuation)
• 🟠 Orange: Warning (Pressure Building)
• 🔴 Red: Critical Pain (High Probability Reversal)
Trading Strategies
Setup 1: The Defensive Bounce (Long)
• Context: Price drops into a 🔴 Red Cloud (Buyer Pain).
• Trigger: Price touches the 🟢 Green Line (Buyer Cost Basis) and shows a rejection wick.
• Logic: Institutional buyers defend their cost basis to avoid realizing losses.
Setup 2: The Short Squeeze (Momentum)
• Context: Price rallies into a 🟢 Green Cloud (Seller Pain).
• Trigger: Price holds above the 🔴 Red Line (Seller Cost Basis).
• Logic: Short sellers are trapped and forced to buy back (cover), fueling the rally.
Fractal Alignment:
For high-conviction trades, wait for the Dashboard to show "Pain" signals on both the 1h (Anchor) and 5m (Trigger) timeframes simultaneously.
Settings
• Memory Length (Default 144): The lookback period for the institutional cost basis. Increase for swing trading, decrease for scalping.
• Sigma Threshold (Default 2.0): The statistical confidence level for "Pain". Higher values = fewer, stronger signals.
• Volume Amp: When enabled, high volume amplifies the pain signal, giving more weight to institutional footprints.

Multi EMA (10)Allows you to add and configure up to 10 EMAs to your chart with a single indicator. Enjoy.

DarkPool FlowDarkPool Flow is a professional-grade technical analysis tool designed to align retail traders with the dominant "smart money" flow. Unlike standard moving average crossovers that often generate false signals during consolidation, this script employs a multi-layered filtering engine to isolate high-probability trends.
The core philosophy of this indicator is that Trends are fractal. A sustainable move on a lower timeframe must be supported by momentum on a higher timeframe. By comparing a "Fast Signal Trend" against a "Slow Anchor Trend" (e.g., Daily vs. Weekly), the script identifies the market bias used by institutional algorithms.
This edition features a Smart Recovery Engine, ensuring that valid trends are not missed simply because momentum started slowly, and a Dynamic Cloud that visually represents the strength of the trend spread.
Key Features
1. Auto-Adaptive Timeframe Logic
The script eliminates the guesswork of Multi-Timeframe (MTF) selection. By enabling "Auto-Adapt," the indicator detects your current chart timeframe and automatically maps it to the mathematically correct institutional pairings:
Scalping (<15m): Uses 15-Minute Trend vs. 1-Hour Anchor.
Day Trading (15m - 1H): Uses 4-Hour Trend vs. Daily Anchor.
Swing Trading (4H - Daily): Uses Daily Trend vs. Weekly Anchor (The classic "Golden" setup).
Investing (Weekly): Uses 21-Week EMA vs. 50-Week SMA (Bull Market Support Band logic).
2. Smart Recovery Signal Engine
Standard crossover scripts often miss major moves if the specific breakout candle has low volume or weak ADX. This script utilizes a state-machine logic that "remembers" the trend direction. If a trend begins during low volatility (gray candles), the script waits. The moment volatility and momentum confirm the move, a Smart Recovery Signal is triggered, allowing you to enter an existing trend safely.
3. Chop Protection (Gray Candles)
Preservation of capital is the priority. The script analyzes the Average Directional Index (ADX) and Volatility (ATR).
Colored Candles (Green/Red): The market is trending with sufficient strength. Trading is permitted.
Gray Candles: The market is in a low-energy chop or consolidation (ADX < 20). Trading is discouraged.
4. Dynamic Trend Cloud
The space between the Fast and Slow trends is filled with a dynamic cloud.
Darker/Opaque Cloud: Indicates a widening spread, suggesting accelerating momentum.
Lighter/Transparent Cloud: Indicates a narrowing spread, suggesting the trend may be weakening or consolidating.
5. Pullback & Retest Signals (+)
While triangles mark the start of a trend, the Plus (+) signs mark low-risk opportunities to add to a position. These appear when price dips into the cloud, finds support at the "Fair Value" zone, and closes back in the direction of the trend with confirmed momentum.
User Guide & Strategy
Setup
Add the indicator to your chart.
For Beginners: Enable "Auto-Adaptive Timeframes" in the settings.
For Advanced Users: Disable Auto-Adapt and manually configure your Fast/Slow pairings (Default is Daily 50 EMA / Weekly 50 EMA).
Signal Mode: Choose "First Breakout Only" for a cleaner chart, or "All Signals" if you wish to see re-entry points during choppy starts.
Long Entry Criteria (Buy)
Trend: The Cloud must be Green (Fast Trend > Slow Trend).
Signal: A Green Triangle appears below the bar.
Confirmation: The signal candle must not be Gray.
Re-Entry: A small Green (+) sign appears, indicating a successful test of the cloud support.
Short Entry Criteria (Sell)
Trend: The Cloud must be Red (Fast Trend < Slow Trend).
Signal: A Red Triangle appears above the bar.
Confirmation: The signal candle must not be Gray.
Re-Entry: A small Red (+) sign appears, indicating a successful test of the cloud resistance.
Stop Loss & Risk Management
Stop Loss: A standard institutional stop loss is placed just beyond the Slow Trend Line (the outer edge of the cloud). If price closes beyond the Slow Trend, the macro thesis is invalid.
Take Profit: Target liquidity pools or use a trailing stop based on the Fast Trend line.
Settings Overview
Mode Selection: Toggle between Auto-Adaptive logic or Manual control.
Manual Configuration: Define the specific Timeframe, Length, and Type (EMA, SMA, WMA) for both Fast and Slow trends.
Signal Logic: Toggle "Show Pullback Signals" on/off. Switch between "First Breakout" or "All Signals."
Quality Filters: Toggle individual filters (ATR, RSI, ADX) to adjust sensitivity. Turning these off makes the script more responsive but increases false signals.
Visual Style: Customize colors for Bullish, Bearish, and Neutral (Gray) states. Adjust cloud transparency.
Disclaimer
Risk Warning: Trading financial markets involves a high degree of risk and is not suitable for all investors. You could lose some or all of your initial investment.
Educational Use Only: This script and the information provided herein are for educational and informational purposes only. They do not constitute financial advice, investment advice, trading advice, or any other recommendation.
No Guarantee: Past performance of any trading system or methodology is not necessarily indicative of future results. The "Institutional Trend" indicator is a tool to assist in technical analysis, not a crystal ball. The creators of this script assume no responsibility or liability for any trading losses or damages incurred as a result of using this tool. Always perform your own due diligence and consult with a qualified financial advisor before making investment decisions.

Momentum Permission + Pivot Entry + Exit (v1.4 FULL)//@version=5
indicator("Momentum Permission + Pivot Entry + Exit (v1.4 FULL)", overlay=true)
// ──────────────────────────────────────────────
// Inputs
// ──────────────────────────────────────────────
smaLength = input.int(50, "SMA Length")
relVolThresh = input.float(1.3, "Relative Volume Threshold")
pivotLookback = input.int(3, "Pivot Lookback Bars")
// ──────────────────────────────────────────────
// Core Calculations
// ──────────────────────────────────────────────
sma50 = ta.sma(close, smaLength)
vwap = ta.vwap(close)
relVol = volume / ta.sma(volume, 10)
aboveSMA = close > sma50
aboveVWAP = close > vwap
relStrong = relVol > relVolThresh
greenCandle = close > open
crossUp = ta.crossover(close, sma50)
// ──────────────────────────────────────────────
// One-Time Daily Permission
// ──────────────────────────────────────────────
var bool permission = false
if ta.change(time("D"))
permission := false
permitSignal = crossUp and aboveVWAP and relStrong and not permission
if permitSignal
permission := true
// ──────────────────────────────────────────────
// Entry: Pivot Break Continuation
// ──────────────────────────────────────────────
pivotHighBreak = close > ta.highest(high , pivotLookback)
entrySignal = (
permission and
aboveSMA and
aboveVWAP and
relStrong and
greenCandle and
pivotHighBreak
)
// ──────────────────────────────────────────────
// Exit: Trend Exhaustion / VWAP Breakdown
// ──────────────────────────────────────────────
smaChange = sma50 - sma50
exitSignal = (
permission and
close < vwap and
close < open and
relStrong and
smaChange < 0
)
// ──────────────────────────────────────────────
// VISUAL PLOTS (same as before)
// ──────────────────────────────────────────────
plot(sma50, title="SMA50", color=color.orange, linewidth=2)
plot(vwap, title="VWAP", color=color.new(color.blue, 0), linewidth=2)
plotshape(
permitSignal,
title="Trend Permission",
style=shape.triangleup,
location=location.belowbar,
color=color.new(color.green, 0),
size=size.large,
text="PERMIT"
)
plotshape(
entrySignal,
title="Entry Trigger",
style=shape.triangleup,
location=location.abovebar,
color=color.new(color.aqua, 0),
size=size.normal,
text="ENTRY"
)
plotshape(
exitSignal,
title="Exit Signal",
style=shape.triangledown,
location=location.abovebar,
color=color.new(color.red, 0),
size=size.large,
text="EXIT"
)
// ──────────────────────────────────────────────
// SCREENER OUTPUT (persistent 0/1 for the day)
// ──────────────────────────────────────────────
var bool permitToday = false
var bool entryToday = false
var bool exitToday = false
if ta.change(time("D"))
permitToday := false
entryToday := false
exitToday := false
if permitSignal
permitToday := true
if entrySignal
entryToday := true
if exitSignal
exitToday := true
// Hidden plots for screener columns
plot(permitToday ? 1 : 0, title="PERMIT", display=display.none)
plot(entryToday ? 1 : 0, title="ENTRY", display=display.none)
plot(exitToday ? 1 : 0, title="EXIT", display=display.none)
// Alerts
alertcondition(permitSignal, title="PERMIT", message="Momentum PERMISSION fired")
alertcondition(entrySignal, title="ENTRY", message="Momentum ENTRY fired")
alertcondition(exitSignal, title="EXIT", message="Momentum EXIT fired")

Obsidian Flux Matrix# Obsidian Flux Matrix | JackOfAllTrades
Made with my Senior Level AI Pine Script v6 coding bot for the community!
Narrative Overview
Obsidian Flux Matrix (OFM) is an open-source Pine Script v6 study that fuses social sentiment, higher timeframe trend bias, fair-value-gap detection, liquidity raids, VWAP gravitation, session profiling, and a diagnostic HUD. The layout keeps the obsidian palette so critical overlays stay readable without overwhelming a price chart.
Purpose & Scope
OFM focuses on actionable structure rather than marketing claims. It documents every driver that powers its confluence engine so reviewers understand what triggers each visual.
Core Analytical Pillars
1. Social Pulse Engine
Sentiment Webhook Feed: Accepts normalized scores (-1 to +1). Signals only arm when the EMA-smoothed value exceeds the `sentimentMin` input (0.35 by default).
Volume Confirmation: Requires local volume > 30-bar average × `volSpikeMult` (default 2.0) before sentiment flags.
EMA Cross Validation: Fast EMA 8 crossing above/below slow EMA 21 keeps momentum aligned with flow.
Momentum Alignment: Multi-timeframe momentum composite must agree (positive for longs, negative for shorts).
2. Peer Momentum Heatmap
Multi-Timeframe Blend: RSI + Stoch RSI fetched via request.security() on 1H/4H/1D by default.
Composite Scoring: Each timeframe votes +1/-1/0; totals are clamped between -3 and +3.
Intraday Readability: Configurable band thickness (1-5) so scalpers see context without losing space.
Dynamic Opacity: Stronger agreement boosts column opacity for quick bias checks.
3. Trend & Displacement Framework
Dual EMA Ribbon: Cyan/magenta ribbon highlights immediate posture.
HTF Bias: A higher-timeframe EMA (default 55 on 4H) sets macro direction.
Displacement Score: Body-to-ATR ratio (>1.4 default) detects impulses that seed FVGs or VWAP raids.
ATR Normalization: All thresholds float with volatility so the study adapts to assets and regimes.
4. Intelligent Fair Value Gap (FVG) System
Gap Detection: Three-candle logic (bullish: low > high ; bearish: high < low ) with ATR-sized minimums (0.15 × ATR default).
Overlap Prevention: Price-range checks stop redundant boxes.
Spacing Control: `fvgMinSpacing` (default 5) avoids stacking from the same impulse.
Storage Caps: Max three FVGs per side unless the user widens the limit.
Session Awareness: Kill zone filters keep taps focused on London/NY if desired.
Auto Cleanup: Boxes delete when price closes beyond their invalidation level.
5. VWAP Magnet + Liquidity Raid Engine
Session or Rolling VWAP: Toggle resets to match intraday or rolling preferences.
Equal High/Low Scanner: Looks back 20 bars by default for liquidity pools.
Displacement Filter: ATR multiplier ensures raids represent genuine liquidity sweeps.
Mean Reversion Focus: Signals fire when price displaces back toward VWAP following a raid.
6. Session Range Breakout System
Initial Balance Tracking: First N bars (15 default) define the session box.
Breakout Logic: Requires simultaneous liquidity spikes, nearby FVG activity, and supportive momentum.
Z-Score Volume Filter: >1.5σ by default to filter noisy moves.
7. Lifestyle Liquidity Scanner
Volume Z-Scores: 50-bar baseline highlights statistically significant spikes.
Smart Money Footprints: Bottom-of-chart squares color-code buy vs sell participation.
Panel Memory: HUD logs the last five raid timestamps, direction, and normalized size.
8. Risk Matrix & Diagnostic HUD
HUD Structure: Table in the top-right summarizes HTF bias, sentiment, momentum, range state, liquidity memory, and current risk references.
Signal Tags: Aggregates SPS, FVG, VWAP, Range, and Liquidity states into a compact string.
Risk Metrics: Swing-based stops (5-bar lookback) + ATR targets (1.5× default) keep risk transparent.
Signal Families & Alerts
Social Pulse (SPS): Volume-confirmed sentiment alignment; triangle markers with “SPS”.
Kill-Zone FVG: Session + HTF alignment + FVG tap; arrow markers plus SL/TP labels.
Local FVG: Captures local reversals when HTF bias has not flipped yet.
VWAP Raid: Equal-high/low raids that snap toward VWAP; “VWAP” label markers.
Range Breakout: Initial balance violations with liquidity and imbalance confirmation; circle markers.
Liquidity Spike: Z-score spikes ≥ threshold; square markers along the baseline.
Visual Design & Customization
Theme Palette: Primary background RGB (12,6,24). Accent shading RGB (26,10,48). Long accents RGB (88,174,255). Short accents RGB (219,109,255).
Stylized Candles: Optional overlay using theme colors.
Signal Toggles: Independently enable markers, heatmap, and diagnostics.
Label Spacing: Auto-spacing enforces ≥4-bar gaps to prevent text overlap.
Customization & Workflow Notes
Adjust ATR/FVG thresholds when volatility shifts.
Re-anchor sentiment to your webhook cadence; EMA smoothing (default 5) dampens noise.
Reposition the HUD by editing the `table.new` coordinates.
Use multiples of the chart timeframe for HTF requests to minimize load.
Session inputs accept exchange-local time; align them to your market.
Performance & Compliance
Pure Pine v6: Single-line statements, no `lookahead_on`.
Resource Safe: Arrays trimmed, boxes limited, `request.security` cached.
Repaint Awareness: Signals confirm on close; alerts mirror on-chart logic.
Runtime Safety: Arrays/loops guard against `na`.
Use Cases
Measure when social sentiment aligns with structure.
Plan ICT-style intraday rebalances around session-specific FVG taps.
Fade VWAP raids when displacement shows exhaustion.
Watch initial balance breaks backed by statistical volume.
Keep risk/target references anchored in ATR logic.
Signal Logic Snapshot
Social Pulse Long/Short: `sentimentEMA` gated by `sentimentMin`, `volSpike`, EMA 8/21 cross, and `momoComposite` sign agreement. Keeps hype tied to structural follow-through.
Kill-Zone FVG Long/Short: Requires session filter, HTF EMA bias alignment, and an active FVG tap (`bullFvgTap` / `bearFvgTap`). Labels include swing stops + ATR targets pulled from `swingLookback` and `liqTargetMultiple`.
Local FVG Long/Short: Uses `localBullish` / `localBearish` heuristics (EMA slope, displacement, sequential closes) to surface intraday reversals even when HTF bias has not flipped.
VWAP Raids: Detect equal-high/equal-low sweeps (`raidHigh`, `raidLow`) that revert toward `sessionVwap` or rolling VWAP when displacement exceeds `vwapAlertDisplace`.
Range Breakouts: Combine `rangeComplete`, breakout confirmation, liquidity spikes, and nearby FVG activity for statistically backed initial balance breaks.
Liquidity Spikes: Volume Z-score > `zScoreThreshold` logs direction, size, and timestamp for the HUD and optional review workflows.
Session Logic & VWAP Handling
Kill zone + NY session inputs use TradingView’s session strings; `f_inSession()` drives both visual shading and whether FVG taps are tradeable when `killZoneOnly` is true.
Session VWAP resets using cumulative price × volume sums that restart when the daily timestamp changes; rolling VWAP falls back to `ta.vwap(hlc3)` for instruments where daily resets are less relevant.
Initial balance box (`rangeBars` input) locks once complete, extends forward, and stays on chart to contextualize later liquidity raids or breakouts.
Parameter Reference
Trend: `emaFastLen`, `emaSlowLen`, `htfResolution`, `htfEmaLen`, `showEmaRibbon`, `showHtfBiasLine`.
Momentum: `tf1`, `tf2`, `tf3`, `rsiLen`, `stochLen`, `stochSmooth`, `heatmapHeight`.
Volume/Liquidity: `volLookback`, `volSpikeMult`, `zScoreLen`, `zScoreThreshold`, `equalLookback`.
VWAP & Sessions: `vwapMode`, `showVwapLine`, `vwapAlertDisplace`, `killSession`, `nySession`, `showSessionShade`, `rangeBars`.
FVG/Risk: `fvgMinTicks`, `fvgLookback`, `fvgMinSpacing`, `killZoneOnly`, `liqTargetMultiple`, `swingLookback`.
Visualization Toggles: `showSignalMarkers`, `showHeatmapBand`, `showInfoPanel`, `showStylizedCandles`.
Workflow Recipes
Kill-Zone Continuation: During the defined kill session, look for `killFvgLong` or `killFvgShort` arrows that line up with `sentimentValid` and positive `momoComposite`. Use the HUD’s risk readout to confirm SL/TP distances before entering.
VWAP Raid Fade: Outside kill zone, track `raidToVwapLong/Short`. Confirm the candle body exceeds the displacement multiplier, and price crosses back toward VWAP before considering reversions.
Range Break Monitor: After the initial balance locks, mark `rangeBreakLong/Short` circles only when the momentum band is >0 or <0 respectively and a fresh FVG box sits near price.
Liquidity Spike Review: When the HUD shows “Liquidity” timestamps, hover the plotted squares at chart bottom to see whether spikes were buy/sell oriented and if local FVGs formed immediately after.
Metadata
Author: officialjackofalltrades
Platform: TradingView (Pine Script v6)
Category: Sentiment + Liquidity Intelligence
Hope you Enjoy!

Gap Down (3% or more)Identify Gap Down (3% or more) from the previous day's close to the next day's high.

VV Moving Average Convergence Divergence # VMACDv3 - Volume-Weighted MACD with A/D Divergence Detection
## Overview
**VMACDv3** (Volume-Weighted Moving Average Convergence Divergence Version 3) is a momentum indicator that applies volume-weighting to traditional MACD calculations on price, while using the Accumulation/Distribution (A/D) line for divergence detection. This hybrid approach combines volume-weighted price momentum with volume distribution analysis for comprehensive market insight.
## Key Features
- **Volume-Weighted Price MACD**: Traditional MACD calculation on price but weighted by volume for earlier signals
- **A/D Divergence Detection**: Identifies when A/D trend diverges from MACD momentum
- **Volume Strength Filtering**: Distinguishes high-volume confirmations from low-volume noise
- **Color-Coded Histogram**: 4-color system showing momentum direction and volume strength
- **Real-Time Alerts**: Background colors and alert conditions for bullish/bearish divergences
## Difference from ACCDv3
| Aspect | VMACDv3 | ACCDv3 |
|--------|---------|---------|
| **MACD Input** | **Price (Close)** | **A/D Line** |
| **Volume Weighting** | Applied to price | Applied to A/D line |
| **Primary Signal** | Volume-weighted price momentum | Volume distribution momentum |
| **Use Case** | Price momentum with volume confirmation | Volume flow and accumulation/distribution |
| **Sensitivity** | More responsive to price changes | More responsive to volume patterns |
| **Best For** | Trend following, breakouts | Volume analysis, smart money tracking |
**Key Insight**: VMACDv3 shows *where price is going* with volume weight, while ACCDv3 shows *where volume is accumulating/distributing*.
## Components
### 1. Volume-Weighted MACD on Price
Unlike standard MACD that uses simple price EMAs, VMACDv3 weights each price by its corresponding volume:
```
Fast Line = EMA(Price × Volume, 12) / EMA(Volume, 12)
Slow Line = EMA(Price × Volume, 26) / EMA(Volume, 26)
MACD = Fast Line - Slow Line
```
**Benefits of Volume Weighting**:
- High-volume price movements have greater impact
- Filters out low-volume noise and false moves
- Provides earlier trend change signals
- Better reflects institutional activity
### 2. Accumulation/Distribution (A/D) Line
Used for divergence detection, measuring buying/selling pressure:
```
A/D = Σ ((2 × Close - Low - High) / (High - Low)) × Volume
```
- **Rising A/D**: Accumulation (buying pressure)
- **Falling A/D**: Distribution (selling pressure)
- **Doji Handling**: When High = Low, contribution is zero
### 3. Signal Lines
- **MACD Line** (Blue, #2962FF): The fast-slow difference showing momentum
- **Signal Line** (Orange, #FF6D00): EMA or SMA smoothing of MACD
- **Zero Line**: Reference for bullish (above) vs bearish (below) bias
### 4. Histogram Color System
The histogram uses 4 distinct colors based on **direction** and **volume strength**:
| Condition | Color | Meaning |
|-----------|-------|---------|
| Rising + High Volume | **Dark Green** (#1B5E20) | Strong bullish momentum with volume confirmation |
| Rising + Low Volume | **Light Teal** (#26A69A) | Bullish momentum but weak volume (less reliable) |
| Falling + High Volume | **Dark Red** (#B71C1C) | Strong bearish momentum with volume confirmation |
| Falling + Low Volume | **Light Pink** (#FFCDD2) | Bearish momentum but weak volume (less reliable) |
Additional shading:
- **Light Cyan** (#B2DFDB): Positive but not rising (momentum stalling)
- **Bright Red** (#FF5252): Negative and accelerating down
### 5. Divergence Detection
VMACDv3 compares A/D trend against volume-weighted price MACD:
#### Bullish Divergence (Green Background)
- **Condition**: A/D is trending up BUT MACD is negative and trending down
- **Interpretation**: Volume is accumulating while price momentum appears weak
- **Signal**: Smart money accumulation, potential bullish reversal
- **Action**: Look for long entries, especially at support levels
#### Bearish Divergence (Red Background)
- **Condition**: A/D is trending down BUT MACD is positive and trending up
- **Interpretation**: Volume is distributing while price momentum appears strong
- **Signal**: Smart money distribution, potential bearish reversal
- **Action**: Consider exits, avoid new longs, watch for breakdown
## Parameters
| Parameter | Default | Range | Description |
|-----------|---------|-------|-------------|
| **Source** | Close | OHLC/HLC3/etc | Price source for MACD calculation |
| **Fast Length** | 12 | 1-50 | Period for fast EMA (shorter = more sensitive) |
| **Slow Length** | 26 | 1-100 | Period for slow EMA (longer = smoother) |
| **Signal Smoothing** | 9 | 1-50 | Period for signal line (MACD smoothing) |
| **Signal Line MA Type** | EMA | SMA/EMA | Moving average type for signal calculation |
| **Volume MA Length** | 20 | 5-100 | Period for volume average (strength filter) |
## Usage Guide
### Reading the Indicator
1. **MACD Lines (Blue & Orange)**
- **Blue Line (MACD)**: Volume-weighted price momentum
- **Orange Line (Signal)**: Smoothed trend of MACD
- **Crossovers**: Blue crosses above orange = bullish, below = bearish
- **Distance**: Wider gap = stronger momentum
- **Zero Line Position**: Above = bullish bias, below = bearish bias
2. **Histogram Colors**
- **Dark Green (#1B5E20)**: Strong bullish move with high volume - **most reliable buy signal**
- **Light Teal (#26A69A)**: Bullish but low volume - wait for confirmation
- **Dark Red (#B71C1C)**: Strong bearish move with high volume - **most reliable sell signal**
- **Light Pink (#FFCDD2)**: Bearish but low volume - may be temporary dip
3. **Background Divergence Alerts**
- **Green Background**: A/D accumulating while price weak - potential bottom
- **Red Background**: A/D distributing while price strong - potential top
- Most powerful at key support/resistance levels
### Trading Strategies
#### Strategy 1: Volume-Confirmed Trend Following
1. Wait for MACD to cross above zero line
2. Look for **dark green** histogram bars (high volume confirmation)
3. Enter long on second consecutive dark green bar
4. Hold while histogram remains green
5. Exit when histogram turns light green or red appears
6. Set stop below recent swing low
**Example**:
```
Price: 26,400 → 26,450 (rising)
MACD: -50 → +20 (crosses zero)
Histogram: Light teal → Dark green → Dark green
Volume: 50k → 75k → 90k (increasing)
```
#### Strategy 2: Divergence Reversal Trading
1. Identify divergence background (green = bullish, red = bearish)
2. Confirm with price structure (support/resistance, chart patterns)
3. Wait for MACD to cross signal line in divergence direction
4. Enter on first **dark colored** histogram bar after divergence
5. Set stop beyond divergence area
6. Target previous swing high/low
**Example - Bullish Divergence**:
```
Price: Making lower lows (26,350 → 26,300 → 26,250)
A/D: Rising (accumulation)
MACD: Below zero but starting to curve up
Background: Green shading appears
Entry: MACD crosses signal line + dark green bar
Stop: Below 26,230
Target: 26,450 (previous high)
```
#### Strategy 3: Momentum Scalping
1. Trade only in direction of MACD zero line (above = long, below = short)
2. Enter on dark colored bars only
3. Exit on first light colored bar or opposite color
4. Quick in and out (1-5 minute holds)
5. Tight stops (0.2-0.5% depending on instrument)
#### Strategy 4: Histogram Pattern Trading
**V-Bottom Reversal (Bullish)**:
- Red histogram bars start rising (becoming less negative)
- Forms "V" shape at the bottom
- Transitions to light red → light teal → **dark green**
- Entry: First dark green bar
- Signal: Momentum reversal with volume
**Λ-Top Reversal (Bearish)**:
- Green histogram bars start falling (becoming less positive)
- Forms inverted "V" at the top
- Transitions to light green → light pink → **dark red**
- Entry: First dark red bar
- Signal: Momentum exhaustion with volume
### Multi-Timeframe Analysis
**Recommended Approach**:
1. **Higher Timeframe (15m/1h)**: Identify overall trend direction
2. **Trading Timeframe (5m)**: Time entries using VMACDv3 signals
3. **Lower Timeframe (1m)**: Fine-tune entry prices
**Example Setup**:
```
15-minute: MACD above zero (bullish bias)
5-minute: Dark green histogram appears after pullback
1-minute: Enter on break of recent high with volume
```
### Volume Strength Interpretation
The volume filter compares current volume to 20-period average:
- **Volume > Average**: Dark colors (green/red) - high confidence signals
- **Volume < Average**: Light colors (teal/pink) - lower confidence signals
**Trading Rules**:
- ✓ **Aggressive**: Take all dark colored signals
- ✓ **Conservative**: Only take dark colors that follow 2+ light colors of same type
- ✗ **Avoid**: Trading light colored signals during high volatility
- ✗ **Avoid**: Ignoring volume context during news events
## Technical Details
### Volume-Weighted Calculation
```pine
// Volume-weighted fast EMA
fast_ma = ta.ema(src * volume, fast_length) / ta.ema(volume, fast_length)
// Volume-weighted slow EMA
slow_ma = ta.ema(src * volume, slow_length) / ta.ema(volume, slow_length)
// MACD is the difference
macd = fast_ma - slow_ma
// Signal line smoothing
signal = ta.ema(macd, signal_length) // or ta.sma() if SMA selected
// Histogram
hist = macd - signal
```
### Divergence Detection Logic
```pine
// A/D trending up if above its 5-period SMA
ad_trend = ad > ta.sma(ad, 5)
// MACD trending up if above zero
macd_trend = macd > 0
// Divergence when trends oppose each other
divergence = ad_trend != macd_trend
// Specific conditions for alerts
bullish_divergence = ad_trend and not macd_trend and macd < 0
bearish_divergence = not ad_trend and macd_trend and macd > 0
```
### Histogram Coloring Logic
```pine
hist_color = (hist >= 0
? (hist < hist
? (vol_strength ? #1B5E20 : #26A69A) // Rising: dark/light green
: #B2DFDB) // Positive but falling: cyan
: (hist < hist
? (vol_strength ? #B71C1C : #FFCDD2) // Rising (less negative): dark/light red
: #FF5252)) // Falling more: bright red
```
## Alerts
Built-in alert conditions for divergence detection:
### Bullish Divergence Alert
- **Trigger**: A/D trending up, MACD negative and trending down
- **Message**: "Bullish Divergence: A/D trending up but MACD trending down"
- **Use Case**: Potential reversal or continuation after pullback
- **Action**: Look for long entry setups
### Bearish Divergence Alert
- **Trigger**: A/D trending down, MACD positive and trending up
- **Message**: "Bearish Divergence: A/D trending down but MACD trending up"
- **Use Case**: Potential top or trend reversal
- **Action**: Consider exits or short entries
### Setting Up Alerts
1. Click "Create Alert" in TradingView
2. Condition: Select "VMACDv3"
3. Choose alert type: "Bullish Divergence" or "Bearish Divergence"
4. Configure: Email, SMS, webhook, or popup
5. Set frequency: "Once Per Bar Close" recommended
## Comparison Tables
### VMACDv3 vs Standard MACD
| Feature | Standard MACD | VMACDv3 |
|---------|---------------|---------|
| **Price Weighting** | Equal weight all bars | Volume-weighted |
| **Sensitivity** | Fixed | Adaptive to volume |
| **False Signals** | More during low volume | Fewer (volume filter) |
| **Divergence** | Price vs MACD | A/D vs MACD |
| **Volume Analysis** | None | Built-in |
| **Color System** | 2 colors | 4+ colors |
| **Best For** | Simple trend following | Volume-confirmed trading |
### VMACDv3 vs ACCDv3
| Aspect | VMACDv3 | ACCDv3 |
|--------|---------|--------|
| **Focus** | Price momentum | Volume distribution |
| **Reactivity** | Faster to price moves | Faster to volume shifts |
| **Best Markets** | Trending, breakouts | Accumulation/distribution phases |
| **Signal Type** | Where price + volume going | Where smart money positioning |
| **Divergence Meaning** | Volume vs price disagreement | A/D vs momentum disagreement |
| **Use Together?** | ✓ Yes, complementary | ✓ Yes, different perspectives |
## Example Trading Scenarios
### Scenario 1: Strong Bullish Breakout
```
Time: 9:30 AM (market open)
Price: Breaks above 26,400 resistance
MACD: Crosses above zero line
Histogram: Dark green bars (#1B5E20)
Volume: 2x average (150k vs 75k avg)
A/D: Rising (no divergence)
Action: Enter long at 26,405
Stop: 26,380 (below breakout)
Target 1: 26,450 (risk:reward 1:2)
Target 2: 26,500 (risk:reward 1:4)
Result: High probability setup with volume confirmation
```
### Scenario 2: False Breakout (Avoided)
```
Time: 2:30 PM (slow period)
Price: Breaks above 26,400 resistance
MACD: Slightly positive
Histogram: Light teal bars (#26A69A)
Volume: 0.5x average (40k vs 75k avg)
A/D: Flat/declining
Action: Avoid trade
Reason: Low volume, no conviction, potential false breakout
Outcome: Price reverses back below 26,400 within 10 minutes
Saved: Avoided losing trade due to volume filter
```
### Scenario 3: Bullish Divergence Bottom
```
Time: 11:00 AM
Price: Making lower lows (26,350 → 26,300 → 26,280)
MACD: Below zero but curving upward
Histogram: Red bars getting shorter (V-bottom forming)
Background: Green shading (divergence alert)
A/D: Rising despite price falling
Volume: Increasing on down bars
Setup:
1. Divergence appears at 26,280 (green background)
2. Wait for MACD to cross signal line
3. First dark green bar appears at 26,290
4. Enter long: 26,295 (next bar open)
5. Stop: 26,265 (below divergence low)
6. Target: 26,350 (previous swing high)
Result: +55 points (30 point risk, 1.8:1 reward)
Key: Divergence + volume confirmation = high probability reversal
```
### Scenario 4: Bearish Divergence Top
```
Time: 1:45 PM
Price: Making higher highs (26,500 → 26,520 → 26,540)
MACD: Positive but flattening
Histogram: Green bars getting shorter (Λ-top forming)
Background: Red shading (bearish divergence)
A/D: Declining despite rising price
Volume: Decreasing on up bars
Setup:
1. Bearish divergence at 26,540 (red background)
2. MACD crosses below signal line
3. First dark red bar appears at 26,535
4. Enter short: 26,530
5. Stop: 26,555 (above divergence high)
6. Target: 26,475 (support level)
Result: +55 points (25 point risk, 2.2:1 reward)
Key: Distribution while price rising = smart money exiting
```
### Scenario 5: V-Bottom Reversal
```
Downtrend in progress
MACD: Deep below zero (-150)
Histogram: Series of dark red bars
Pattern Development:
Bar 1: Dark red, hist = -80, falling
Bar 2: Dark red, hist = -95, falling
Bar 3: Dark red, hist = -100, falling (extreme)
Bar 4: Light pink, hist = -98, rising!
Bar 5: Light pink, hist = -90, rising
Bar 6: Light teal, hist = -75, rising (crosses to positive momentum)
Bar 7: Dark green, hist = -55, rising + volume
Action: Enter long on Bar 7
Reason: V-bottom confirmed with volume
Stop: Below Bar 3 low
Target: Zero line on histogram (mean reversion)
```
## Best Practices
### Entry Rules
✓ **Wait for dark colors**: High-volume confirmation is key
✓ **Confirm divergences**: Use with price support/resistance
✓ **Trade with zero line**: Long above, short below for best odds
✓ **Multiple timeframes**: Align 1m, 5m, 15m signals
✓ **Watch for patterns**: V-bottoms and Λ-tops are reliable
### Exit Rules
✓ **Partial profits**: Take 50% at first target
✓ **Trail stops**: Use histogram color changes
✓ **Respect signals**: Exit on opposite dark color
✓ **Time stops**: Close positions before major news
✓ **End of day**: Square up before close
### Avoid
✗ **Don't chase light colors**: Low volume = low confidence
✗ **Don't ignore divergence**: Early warning system
✗ **Don't overtrade**: Wait for clear setups
✗ **Don't fight the trend**: Zero line dictates bias
✗ **Don't skip stops**: Always use risk management
## Risk Management
### Position Sizing
- **Dark green/red signals**: 1-2% account risk
- **Light signals**: 0.5% account risk or skip
- **Divergence plays**: 1% account risk (higher uncertainty)
- **Multiple confirmations**: Up to 2% account risk
### Stop Loss Placement
- **Trend trades**: Below/above recent swing (20-30 points typical)
- **Breakout trades**: Below/above breakout level (15-25 points)
- **Divergence trades**: Beyond divergence extreme (25-40 points)
- **Scalp trades**: Tight stops at 10-15 points
### Profit Targets
- **Minimum**: 1.5:1 reward to risk ratio
- **Scalps**: 15-25 points (quick in/out)
- **Swing**: 50-100 points (hold through pullbacks)
- **Runners**: Trail with histogram color changes
## Timeframe Recommendations
| Timeframe | Trading Style | Typical Hold | Advantages | Challenges |
|-----------|---------------|--------------|------------|------------|
| **1-minute** | Scalping | 1-5 minutes | Fast profits, many setups | Noisy, high false signals |
| **5-minute** | Intraday | 15-60 minutes | Balance of speed/clarity | Still requires quick decisions |
| **15-minute** | Swing | 1-4 hours | Clearer trends, less noise | Fewer opportunities |
| **1-hour** | Position | 4-24 hours | Strong signals, less monitoring | Wider stops required |
**Recommendation**: Start with 5-minute for best balance of signal quality and opportunity frequency.
## Combining with Other Indicators
### VMACDv3 + ACCDv3
- **Use**: Confirm volume flow with price momentum
- **Signal**: Both showing dark green = highest conviction long
- **Divergence**: VMACDv3 bullish + ACCDv3 bearish = examine price action
### VMACDv3 + RSI
- **Use**: Overbought/oversold with momentum confirmation
- **Signal**: RSI < 30 + dark green VMACD = strong reversal
- **Caution**: RSI > 70 + light green VMACD = potential false breakout
### VMACDv3 + Elder Impulse
- **Use**: Bar coloring + histogram confirmation
- **Signal**: Green Elder bars + dark green VMACD = aligned momentum
- **Exit**: Blue Elder bars + light colors = momentum stalling
## Limitations
- **Requires volume data**: Will not work on instruments without volume feed
- **Lagging indicator**: MACD inherently follows price (2-3 bar delay)
- **Consolidation noise**: Generates false signals in tight ranges
- **Gap handling**: Large gaps can distort volume-weighted values
- **Not standalone**: Should combine with price action and support/resistance
## Troubleshooting
**Problem**: Too many light colored signals
**Solution**: Increase Volume MA Length to 30-40 for stricter filtering
**Problem**: Missing entries due to waiting for dark colors
**Solution**: Lower Volume MA Length to 10-15 for more signals (accept lower quality)
**Problem**: Divergences not appearing
**Solution**: Verify volume data available; check if A/D line is calculating
**Problem**: Histogram colors not changing
**Solution**: Ensure real-time data feed; refresh indicator
## Version History
- **v3**: Removed traditional MACD, using volume-weighted MACD on price with A/D divergence
- **v2**: Added A/D divergence detection, volume strength filtering, enhanced histogram colors
- **v1**: Basic volume-weighted MACD on price
## Related Indicators
**Companion Tools**:
- **ACCDv3**: Volume-weighted MACD on A/D line (distribution focus)
- **RSIv2**: RSI with A/D divergence detection
- **DMI**: Directional Movement Index with A/D divergence
- **Elder Impulse**: Bar coloring system using volume-weighted MACD
**Use Together**: VMACDv3 (momentum) + ACCDv3 (distribution) + Elder Impulse (bar colors) = complete volume-based trading system
---
*This indicator is for educational purposes. Past performance does not guarantee future results. Always practice proper risk management and never risk more than you can afford to lose.*

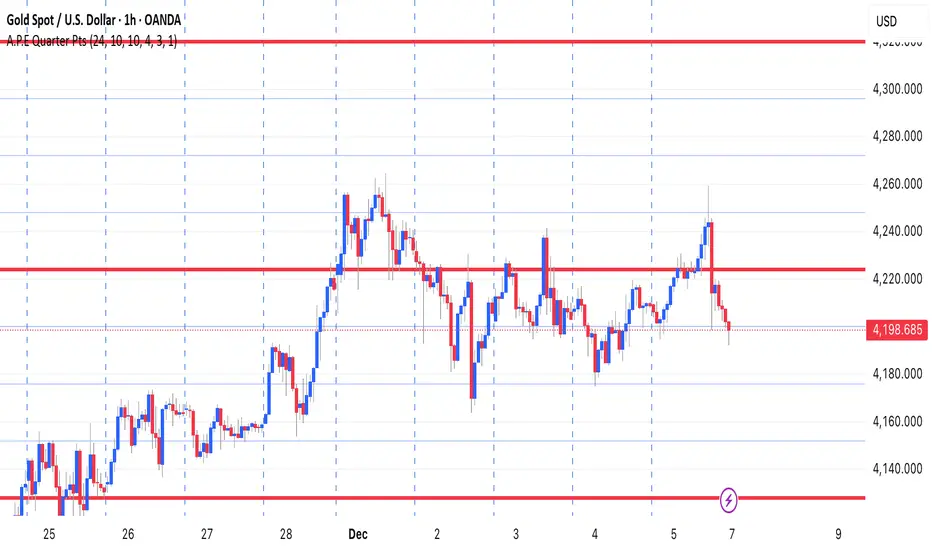
A.P.E Quarter PtsThis indicator draws a set of straight horizontal price levels on your chart.
Each line is spaced evenly apart at a distance you choose — these are called quarter-points.
As price moves, the grid of lines stays centered around the current price, so you always see the nearest support and resistance levels. The lines above price show possible resistance, and the lines below price show possible support.
Some of the lines can be drawn thicker or in a stronger color to show more important levels.
Overall, the indicator gives you a clean, easy-to-read structure of evenly spaced levels that help you see where price may react, stall, bounce, or reverse.
Smart Non-Overlapping S/R How to Interpret This Chart
The "Cluster" Effect: Look for areas where lines from different timeframes are close together (e.g., a Daily Support line is right next to a 4-Hour Support line). These "clusters" are very strong zones where price is highly likely to bounce.
Breakouts:
Bullish Breakout: If a candle closes above a Resistance line (e.g., "Daily Res"), that line often turns into new Support.
Bearish Breakout: If a candle closes below a Support line (e.g., "Daily Sup"), that line often turns into new Resistance.
Color Coding:
Orange (Daily): Major levels. Expect big reactions here.
Purple (4H): Medium trend levels. Good for swing trades.
Blue (1H): Minor levels. Good for day trading entries.

Buy Sell ProfileThis indicator attempts to count the up down movement for each price interval and color the interval by the imbalance. Works best on lower timeframes, 30 seconds or less. Set the row size to 500 and if it runs out of rows (too many price points) and breaks you can increase the row size and aggregate it.

ProCrypto OI Candles (auto symbol) — by ruben_procryptoProCrypto OI Candles (Auto Symbol) visualizes Open Interest in a clear and intuitive way by converting OI data into candles and a smooth trendline.
The script automatically detects the correct OI symbol based on the chart you are viewing, so there is no need to manually change OI tickers when switching between assets.
🔹 Key Features
Automatic Symbol Detection
The indicator automatically selects the appropriate Open Interest data source for the asset on your chart (BTC, SOL, ADA, DOGE, etc.).
OI Candles
Open Interest is displayed as candles to show whether market participation is increasing or decreasing on each bar.
Multi-exchange Support
Users can choose OI data from Binance, Bybit, or OKX. Any combination is supported.
Smooth OI Trendline
An optional EMA-based OI line provides a clear view of the underlying trend in trader activity.
Delta Bars (optional)
Highlights whether Open Interest expanded or contracted within the candle.
🔹 How to Interpret OI
Typical relationships between price and OI:
Price ↑ + OI ↑ → Trend continuation likely
New positions entering the market.
Price ↑ + OI ↓ → Short squeeze / weak move
Shorts closing, not new longs opening.
Price ↓ + OI ↑ → New shorts entering
Often signals bearish pressure.
Price ↓ + OI ↓ → Longs closing
Can indicate capitulation or consolidation.
These concepts help traders understand the strength or weakness behind a price move.
🔹 Inputs
Choose exchange(s) for OI data
Adjust candle opacity
Enable/disable OI line
Smoothing length for OI line
Optional delta bars
Range lookback for line offset
All settings are customizable to suit different styles of analysis.
🔹 Notes
Some assets may not have Open Interest data available on all exchanges.
The indicator uses standard TradingView data sources via request.security().
No trading signals are generated; this script is a visualization tool only.
🔹 Author
Created by ruben_procrypto for traders who analyze liquidity, Open Interest, and market participation.

Momentum Reversal / Dip Buyer [Score Based]Strategy Overview
Momentum Reversal / Dip Buyer is a quantitative reversal engine designed to fade stretched moves and buy dips / sell rallies when multiple momentum and context factors line up. It’s built for liquid instruments especially for ticker CME_MINI:ES1! and works best on intraday timeframes like the 5-minute or 1-minute chart.
Core Logic
This strategy builds a composite Momentum Score by combining:
Price Location: Relative to 100 SMA, 1000 EMA, and VWAP (trend / regime filter).
RSI: Overbought/oversold and mid-zone strength.
VWMO (Volume-Weighted Momentum): Direction and strength of volume-weighted price drift.
ADX: Trend strength filter (high vs low trend environment).
Full Stoch (%K): Short-term exhaustion and mean-reversion context.
CCI: Overbought/oversold turns (key trigger).
MFI: Volume-confirmed buying/selling pressure.
ATR Regime: High vs low volatility environment.
Cumulative Delta: Whether net aggressor flow is rising or falling.
From this, a single Momentum Score is computed each bar:
Longs: Taken when the score is depressed (scoreLow) and CCI crosses up from oversold.
Shorts: Taken when the score is elevated (scoreHigh) and CCI crosses down from overbought.
Risk Management & Trade Logic
Max Daily Trades: Hard cap on entries per day.
Hard Stop: Fixed % stop based on entry price.
Profit Target: Target ATR Multiplier × main ATR from entry.
Breakeven Logic: Optional; moves stop to breakeven (plus optional offset) after price moves a configurable multiple of the main ATR in your favor.
Trailing Stop (Separate ATR): Optional; uses its own ATR length and ATR-based trigger and distance. This lets you run slower ATR for targets while using a tighter, more reactive ATR for the trail.
Session Control
Trading Window: Optional session filter (e.g., 09:30–16:00). Entries are only allowed inside the defined window.
Force Flat at Session End: Option to automatically close all open positions when the session ends.
Visuals
The script plots entry arrows and a compact dashboard displaying: current Momentum Score, daily trade usage, and CCI status.
Disclaimer:
This script is for educational and research purposes only and is not financial advice. Past performance does not guarantee future results. Always forward-test and adjust parameters to your own risk tolerance and market.
Shoutout and all credit goes to AuclairsCapital for building the base foundation of this strategy on ThinkScript

Advanced Breakout SystemAdvanced Breakout System
Developed by: Mohammed Bedaiwi
This script hunts for high-probability breakouts by combining price consolidation zones, volume spikes vs. average volume, smart money flow (OBV), and a Momentum Override for explosive moves that skip consolidation. Additionally, it automatically identifies and plots Support and Resistance levels with price labels to help you visualize market structure.
The system follows a "Watch & Confirm" logic: it first prints a WATCH setup, then a BUY only if price confirms strength.
🔑 Color Legend (Visual Guide)
🟡 WATCH – Setup (Yellow Arrow Down) :
Potential breakout setup detected. Monitor the stock and do not enter yet. Triggered when price breaks out of a recent consolidation with strong volume or makes a big momentum move (e.g. >5%) in a single bar.
🟢 BUY – Confirmation (Green Arrow Up) :
Confirmed breakout. Consider entering a long position according to your own rules. Triggered when price trades above the high of the WATCH candle.
🟠 SELL – Break (Orange Arrow) :
Short-term trend weakness. Triggered when price closes below the Fast EMA (9). Used as a protective exit or partial profit-taking.
🔴 SELL – Dump (Dark Red Arrow) :
Distribution / volume dump. Triggered by a bearish candle with abnormally high volume compared to the average (e.g. ≥ Dump Volume Multiplier × average volume).
🟣 SELL – Pattern (Purple Arrow) :
Bearish price-action pattern (such as a bearish engulfing). Indicates a possible top or reversal.
🔴/🟢 Support & Resistance Lines :
Small horizontal lines plotted at key swing points. Red Line: Resistance (Swing High). Green Line: Support (Swing Low). Both include exact price labels for quick reference.
⚙️ Inputs
Entry settings: Consolidation Lookback (default 20) = bars used to detect consolidation. Consolidation Range % (default 12%) = max allowed range size; higher values make the script more sensitive. Volume Spike Multiplier (default 1.2) = factor above average volume to count as a spike. Force Signal on Big Moves (default ON) = forces a WATCH signal if price jumps more than a set % (e.g. 5%) even without consolidation/OBV confirmation.
Exit settings: Enable Fast Exit (EMA 9) toggles the SELL – Break signal. Dump Volume Multiplier defines what counts as “dump” volume (e.g. 2× average).
Support & Resistance: Adjustable Pivot Left/Right bars allow you to control the sensitivity of the support and resistance lines.
⚠️ Disclaimer
Trading involves significant risk of loss. This script is for educational and informational purposes only and is not financial advice or a recommendation to buy or sell any asset. BUY and SELL signals are rule-based and derived from historical behavior and do not guarantee future performance. Always use your own analysis and risk management.

HL/2 Fast & Slow - Cloud Signals + Backtest + Exit AlarmsDescription:
This indicator plots two HL/2 moving averages—a fast and a slow line—on the chart, along with dynamic upper and lower bands based on the slow line and ATR. It features a colored cloud between the two averages to visualize trend direction, and it provides buy/sell signals based on the alignment of the two lines.
Key Features:
Fast & Slow HL/2 Averages
Fast and slow HL/2 lines calculated as simple moving averages.
Lines change color based on direction (up/down), configurable via style settings.
Dynamic Upper and Lower Bands
Bands calculated from the slow line using ATR to capture volatility.
Trend Cloud
Fills the area between fast and slow lines.
Green if both lines are rising, red if both are falling, gray if lines disagree.
Transparency adjustable for better visual clarity.
Buy/Sell Signals
Signals appear only when both lines align in the same direction.
Two modes available:
Series Signals: generates a signal whenever the cloud color changes.
Single Signal: generates a signal only when the slow line changes direction.
Signals are plotted as small triangles above/below bars.
Alerts can be set for both buy/sell signals.
Exit Modes and Alerts
Exit positions either on a reverse signal or when the cloud enters a neutral gray zone.
Exit alerts are available for both conditions.
Integrated Backtest Panel
Shows total trades, win rate, and cumulative profit in USD.
Considers position size and commission (configurable).
Panel color indicates profit (green) or loss (red).
Fixed position on chart for easy reference.
Inputs:
Fast and slow periods, ATR length, ATR multiplier.
Position size, commission percentage.
Signal mode (Series or Single).
Exit mode (Reverse Signal or Gray Area).
Style options for line colors and cloud colors.
Time window for backtesting (daily, weekly, monthly, or custom date range).
Usage:
Ideal for identifying trend direction and potential entry points.
Can be used for manual trading or as part of an automated strategy with alerts.
Provides a visual and statistical overview of trading performance via the backtest panel.

CRT with sessions (by Simonezzi)original version is by Flux Charts. I just added sessions, so it was easier to trade on demand and not get signals at the wrong time.
Sessions added - Asian, London and NY.

Ashok 07 Dec 25 updated scriptTried to fix the bugs in previous script. Even now improvements are needed, but for now it looks reasonably profiting.

CPR + EMA(20/50/200) Strategy (5m) - NIFTY styleindicator best suited for nifty for 5 minute time frame.
