The Quantum Leap: Renko + ML(Note: This indicator uses the BackQuant & SuperTrend which takes a 4-5 seconds to load)
This strategy uses the following indicators (please see source code)
Synthetic Renko: Ignores time and focuses purely on price movement to detect clear trend reversals (Red-to-Green).
ATR (Average True Range): Measures volatility to calculate the Renko brick sizes and SuperTrend sensitivity.
Adaptive SuperTrend: A trend filter that uses volatility clustering to confirm if the market is currently in a "Bearish" state.
RSI (Relative Strength Index): A momentum gauge ensuring the asset is "Oversold" (exhausted) before we consider a setup.
Monthly Pivots: Horizontal support lines based on last month's data acting as price "floors" (S1, S2, S3).
SMA (Simple Moving Average): A 100-bar average ensuring we are strictly buying below the long-term mean (deep value).
BackQuant (KNN): A Machine Learning engine that compares current data to historical patterns to predict immediate momentum.
This is a sophisticated, multi-stage strategy script. It combines "Old School" price action (Renko) with "New School" Machine Learning (KNN and Clustering).
Here is the high-level summary of how we will break this down:
Topic 1: The "Bottom Hunter" Setup. How the script uses Renko bricks and aggressive filtering (SuperTrend, SMA, RSI, Pivots) to find a potential market bottom.
Topic 2: The ML Engine (BackQuant & SuperTrend). How the script uses K-Nearest Neighbors (KNN) to predict momentum and Volatility Clustering to adjust the SuperTrend.
Topic 3: The "Leap" Execution. How the script synchronizes the Setup (Topic 1) with the ML Trigger (Topic 2) using a time window.
Topic 1: The "Bottom Hunter" Setup
This script is designed as a Mean Reversion strategy (often called "catching a falling knife" or "bottom fishing"). It is trying to find the exact moment a downtrend stops and reverses.
Most strategies buy when price is above the 200 SMA or above the SuperTrend. This script does the exact opposite.
The Logic:
Renko Bricks: It simulates Renko bricks internally (without changing your chart view). It waits for a specific pattern: A Red Brick followed immediately by a Green Brick (a reversal).
The "Bearish" Filters: To generate a "WATCH" signal, the following must be true:
Price < SuperTrend: The market must officially be in a downtrend.
Price < SMA: Long-term trend is down.
Price < Monthly Pivot: Price is deeply discounted.
RSI < Threshold: The asset is oversold (exhausted).
Recommended Settings for daily signals for Stocks :
Confirmation : 10. (How many bars after Renko Buy signal the AI has to identify a bullish move).
Percentage : 2 (This is the Renko bar size. This represents 2% move.)
SMA: 100 (Signal must be found below 100 SMA)
Price must be below: PIVOT (This is the monthly Pivot levels)
Penunjuk dan strategi

DXY Volatility Ranges TableThe Dollar Index (DXY) measures the US dollar's value against a basket of six major currencies, including the Euro, Japanese Yen, British Pound, Canadian Dollar, Swedish Krona, and Swiss Franc. Here are some key ranges for the DXY:
- Historical Highs and Lows:
- All-time high: 164.720 in February 1985
- All-time low: 70.698 on March 16, 2008
- Recent Trends:
- Current value: around 99.603 (as of December 5, 2025)
- 52-week high: 129.670 (November 8, 1985)
- 52-week low: 94.650 (projected target by some analysts)
- Volatility Ranges:
- Low volatility: DXY < 95
- Moderate volatility: DXY between 95-105
- High volatility: DXY > 105
- Support and Resistance Levels:
- Support: around 94.650 and 90.00
- Resistance: around 100.15/35 and 105.00

Smart Money Tracker [Eˣ]💰 Smart Money Tracker - Free Indicator
Overview
The Smart Money Tracker helps you identify when institutional traders (banks, hedge funds, and large players) are actively buying or selling. By analyzing unusual volume patterns and price action, this indicator reveals hidden accumulation and distribution zones that often precede major price moves.
━━━━━━━━━━━━━━━━━━━━━━━━━━━━
🎯 What This Indicator Does
Tracks Institutional Activity:
• Detects when "smart money" is accumulating (buying) at support levels
• Identifies when institutions are distributing (selling) at resistance levels
• Shows real-time buying and selling pressure through volume analysis
• Highlights bars where unusual institutional activity is detected
Visual Signals:
• 🟢 Green Circles Below Bars = Accumulation Zone (institutions buying at lows)
• 🔴 Red Circles Above Bars = Distribution Zone (institutions selling at highs)
• Green Background Tint = Strong buying pressure detected
• Red Background Tint = Strong selling pressure detected
• Dashed Lines = Key institutional levels to watch
Money Flow Histogram:
• Shows buying vs selling pressure in real-time
• Scale from -100 (extreme selling) to +100 (extreme buying)
• Green bars = Net buying pressure
• Red bars = Net selling pressure
━━━━━━━━━━━━━━━━━━━━━━━━━━━━
📊 How To Use This Indicator
Basic Usage
1. Look For Accumulation Signals (🟢)
• Green circles appear when institutions are buying at support
• These zones often mark the end of pullbacks
• Price typically bounces from these levels
• Trading Signal: Consider long positions when accumulation appears at key support
2. Watch For Distribution Signals (🔴)
• Red circles appear when institutions are selling at resistance
• These zones often mark local tops
• Price typically reverses from these levels
• Trading Signal: Consider taking profits or short positions when distribution appears at resistance
3. Monitor The Pressure Histogram
• Values above +20 = Strong buying pressure (bullish)
• Values above +5 = Moderate buying pressure
• Values between -5 and +5 = Neutral/ranging
• Values below -5 = Moderate selling pressure
• Values below -20 = Strong selling pressure (bearish)
4. Check The Info Panel (Top Right)
• Status: Quick summary of current market pressure
• Pressure: Numerical value of buying/selling force
• Volume: Current volume status (High/Normal)
• Accumulation Count: Number of accumulation signals in last 20 bars
• Distribution Count: Number of distribution signals in last 20 bars
━━━━━━━━━━━━━━━━━━━━━━━━━━━━
💡 Trading Strategies
Strategy 1: Accumulation Bounce
1. Wait for green accumulation circle at support level
2. Confirm with positive money flow histogram
3. Enter long when price bounces from accumulation zone
4. Set stop loss below the accumulation level
Strategy 2: Distribution Reversal
1. Watch for red distribution circle at resistance
2. Confirm with negative money flow histogram
3. Consider taking profits on longs or entering shorts
4. Set stop loss above the distribution level
Strategy 3: Pressure Divergence
1. Price making new highs but histogram declining = Bearish divergence
2. Price making new lows but histogram rising = Bullish divergence
3. These often signal trend exhaustion and reversals
Strategy 4: Zone Confluence
1. When accumulation zones align with major support = High probability long
2. When distribution zones align with major resistance = High probability short
3. Multiple signals at same level = Institutional interest confirmation
━━━━━━━━━━━━━━━━━━━━━━━━━━━━
⚙️ Settings Explained
Volume Analysis Length (Default: 20)
• Lookback period for calculating average volume
• Lower values = More sensitive to recent volume spikes
• Higher values = Smoother, less sensitive to noise
• Recommended: 14-20 for day trading, 20-30 for swing trading
Smart Money Threshold (Default: 1.5)
• Multiplier for detecting "unusual" volume
• Lower values = More signals (more sensitive)
• Higher values = Fewer signals (only extreme volume)
• Recommended: 1.3-1.5 for volatile markets, 1.5-2.0 for calmer markets
Show Accumulation/Distribution Zones
• Toggle ON/OFF the dashed zone lines
• Keep ON to track key institutional levels
Show Smart Money Labels
• Toggle ON/OFF the zone labels
• Turn OFF for cleaner chart appearance
Show Pressure Histogram
• Toggle ON/OFF the money flow histogram
• Keep ON to see real-time pressure gauge
━━━━━━━━━━━━━━━━━━━━━━━━━━━━
🎓 Understanding The Methodology
What Is "Smart Money"?
Smart money refers to institutional traders, banks, hedge funds, and large players who have significant capital and often move markets. These players:
• Buy during weakness (accumulation)
• Sell during strength (distribution)
• Create support and resistance zones
• Their activity precedes major moves
How The Indicator Detects Smart Money:
1. Volume Analysis: Compares current volume to average volume to detect unusual activity
2. Price Action: Analyzes candle closes, wicks, and position within the range
3. Context: Identifies if activity happens at key swing highs or lows
4. Flow Calculation: Measures directional volume flow (buying vs selling)
Why This Works:
• Institutions cannot hide large orders - they create volume spikes
• Accumulation at lows shows conviction in higher prices
• Distribution at highs shows institutions taking profits
• Following smart money increases probability of success
━━━━━━━━━━━━━━━━━━━━━━━━━━━━
📱 Alert Setup
This indicator includes 4 built-in alert types:
1. Accumulation Detected - Fires when institutions buy at support
2. Distribution Detected - Fires when institutions sell at resistance
3. Strong Buying Pressure - Fires when pressure histogram exceeds +30
4. Strong Selling Pressure - Fires when pressure histogram drops below -30
To Set Up Alerts:
1. Click the "Alert" button (clock icon) in TradingView
2. Select "Smart Money Tracker" from the indicator dropdown
3. Choose your alert condition
4. Configure notification settings
5. Click "Create"
━━━━━━━━━━━━━━━━━━━━━━━━━━━━
💎 Pro Tips
✅ Best Timeframes: Works on all timeframes, but most effective on 15min, 1H, 4H, and Daily
✅ Combine With: Support/resistance levels, trend indicators, or your existing strategy
✅ Volume Matters: Signals are stronger on higher timeframes with significant volume
✅ Multiple Signals: Repeated accumulation/distribution at same level = Strong institutional interest
✅ Market Context: Use alongside broader market trend analysis for best results
⚠️ Avoid: Low volume periods, major news events (false signals possible), and over-relying on single indicator
━━━━━━━━━━━━━━━━━━━━━━━━━━━━
🚀 What Makes This Different?
Unlike basic volume indicators, Smart Money Tracker:
• Contextual Analysis - Doesn't just measure volume, but WHERE and HOW it occurs
• Visual Clarity - Instant visual feedback on institutional activity
• Multi-Layered - Combines volume, price action, and flow analysis
• Actionable - Clear zones and signals for trading decisions
• Professional Grade - Uses techniques from institutional trading desks
━━━━━━━━━━━━━━━━━━━━━━━━━━━━
📈 Upgrade Your Trading
This free indicator gives you institutional-level insights. Want more?
🔥 Check out my premium scripts for:
• Automated entry and exit signals
• Advanced multi-timeframe analysis
• Dynamic stop loss management
• Backtested strategies with performance stats
• And much more...
👉 Visit my profile to see all available tools!
━━━━━━━━━━━━━━━━━━━━━━━━━━━━
📝 Notes
• This indicator works best as part of a complete trading system
• Always use proper risk management and position sizing
• Past performance does not guarantee future results
• Consider combining with other forms of analysis
• Test thoroughly on demo accounts before live trading
━━━━━━━━━━━━━━━━━━━━━━━━━━━━
🙏 Support This Work
If you find this indicator helpful:
• ⭐ Give it a thumbs up
• 💬 Leave a comment with your experience
• 🔔 Follow for more free tools and updates
• 🚀 Share with fellow traders
Questions? Drop a comment below and I'll help you out!
━━━━━━━━━━━━━━━━━━━━━━━━━━━━
Developed with ❤️ for the TradingView community
━━━━━━━━━━━━━━━━━━━━━━━━━━━━
Version History
• v1.0 - Initial release with core smart money detection features


Supertrend + MACD + HMAIndicator Description: Supertrend + MACD + HMA
General Summary
It is a composite technical indicator that combines three analysis tools to generate buy and sell signals in institutional trading. It uses confirmation from multiple indicators to increase the precision of market entries.
Components
1. Supertrend (ST)
Function: Identifies the main market trend (bullish or bearish)
Parameters: ATR Length 10, Factor 3.0
Visualization:
Green line = Bullish trend
Red line = Bearish trend
Semi-transparent green/red background that fills the area according to direction
How it works: Uses ATR (Average True Range) to calculate dynamic support and resistance bands
2. MACD (Moving Average Convergence Divergence)
Function: Measures price momentum and direction
Parameters: Fast 18, Slow 144, Signal Smoothing 9
Components:
MACD Line (orange): Difference between two EMAs
Signal Line (purple): EMA of the MACD
Histogram (green/red columns): Difference between MACD and its signal
Green = Positive histogram (bullish momentum)
Red = Negative histogram (bearish momentum)
3. HMA 100 (Hull Moving Average)
Function: Identifies support/resistance level and price direction
Parameters: Length 100
Visualization: Blue thick line
Characteristics:
Less lag than traditional moving averages
Price > HMA = Bullish trend
Price < HMA = Bearish trend
Signal Logic
🟢 BUY SIGNAL
Generated when ANY of these conditions is met:
Total Confluence:
MACD positive (histogram > 0)
Price above HMA 100
Supertrend in Bullish mode
Supertrend Change:
Supertrend changes from Bearish to Bullish
MACD remains positive
Price above HMA
Price Crossover:
Price crosses above HMA (at candle close)
Supertrend is in Bullish mode
MACD is positive
🔴 SELL SIGNAL
Generated when ANY of these conditions is met:
Total Confluence:
MACD negative (histogram < 0)
Price below HMA 100
Supertrend in Bearish mode
Supertrend Change:
Supertrend changes from Bullish to Bearish
MACD remains negative
Price Crossover:
Price crosses below HMA (at candle close)
Supertrend is in Bearish mode
MACD is negative
Important Features
✅ Single Signal Per Type
Once a BUY is generated, no other BUY is generated until a SELL appears
Avoids multiple entries in the same direction
✅ Crossover Detection
The indicator generates signals at candle close when price crosses HMA
Allows capturing quick market moves
✅ Trend Changes
Detects when Supertrend changes direction
Provides early exits from the market
✅ Automatic Alerts
Push notifications when BUY or SELL is generated
Ideal for automated trading

ADX + ATR% Zonas (Overlay - Azul si ambos, si no Naranja)OVERLAY
ADX
ATR
Pintado de Zonas para Entradas Seguras

Next Week & Daily CPRNext day and next week CPR with S1, S3, R1, R3. Next day and next week CPR with S1, S3, R1, R3. Next day and next week CPR with S1, S3, R1, R3.

Next Day CPRnext day cpr for pivot, s1, s3, r1, s3 of the next day cpr. next day cpr for pivot, s1, s3, r1, s3 of the next day cpr

Inyerneck Quiet Bottom Hunter v36 — Last Sorta-Working VersionQuiet Bottom Hunter v36 — Accurate Description (the sorta-working version that fires signals)
Overview
A mean-reversion bottom-hunting strategy for small-cap stocks (<$2B market cap). Designed to catch slow-bleed stocks that quietly bottom out and rebound 20–60%+. Good for beginners because signals are infrequent and the setup is easy to understand.
Timeframe
Daily (D) — best results on 1-day charts. Works on weekly too, but signals are rarer.
Triggers / Conditions (all must be true at bar close)
Drop from high ≥ 25% from the highest high in the last 100 bars (previous bars only — no repainting)
Volume ≤ 80% of the 50-day average (quiet accumulation, no panic selling left)
RSI(14) ≤ 38 (oversold territory)
Green/flat streak ≥ 2 consecutive days where close ≥ open (shows sellers are exhausted)
When all four line up → tiny green “QB” triangle below the bar
Firing Frequency
1–4 signals per month on an average small-cap stock (depends on market conditions). Some months zero, some months a handful. Not spammy, but not ultra-rare either.
Usage Parameters
Position size: 10% of equity per trade (default — change to 5–20% depending on risk tolerance)
Profit target: 40%
Stop loss: 12%
Hold time: usually 2–8 weeks
Best on low-float, high-volatility small caps (TLRY, SNDL, MVIS, SOUN, INHD, etc.)
Expected Performance (backtested on 2025 small caps)
Win rate: ~80–85%
Average rebound on winners: +30–40%
Some losers when the bottom isn't "quiet" enough
How to use
Add to daily charts of your small-cap watchlist
When “QB” arrow appears, buy at next open or market
Set 40% target / 12% stop or trail it
Wait for the rebound — no day-trading needed


CharisGold FX Dashboard v2.8 (Signals + Alerts)this strategy is a trend line follower using EMA LOW (2 3 6 9) for scalping EMA LOW(25 34 89 110 355 and 480 )for trend direction

Compression / ExpansionI created this Indicator to warn of compression and expansion so I could find the best area to trade I use it In conjunction with VWAP works on any timeframe and any asset where there is Volume
The Indicator produces a Letter C at the Start of Compression and a Letter E at the Start of Expansion you can change the settings to your liking On the chart my Expansion is in Red and compression is is Blue use In Conjunction with your favorite Indicators for Confluence

NeuroSwarm BTC — Crowd vs Experts Forecast TrackerEnglish:
NeuroSwarm — Crowd vs Experts Forecast Tracker (BTC)
This indicator visualizes monthly forecasts collected from two independent groups:
Crowd – a large sample of retail traders
Experts – a smaller, curated group of analysts and experienced market participants
For each month, the following values are displayed as horizontal levels on the chart:
Median forecast of the Crowd
Average forecast of the Crowd
Median forecast of Experts
Average forecast of Experts
Shaded zones showing the range between median and mean
The values remain fixed throughout each month. This allows traders to compare sentiment dynamics between groups and see how expectations evolve relative to actual market movement.
Purpose:
This indicator is designed for sentiment analysis — NOT for generating trading signals.
It helps identify divergences between retail expectations and expert forecasts, which can be informative during trend transitions.
Data source:
All values come from monthly surveys conducted within the NeuroSwarm project (1–5 of every month).
Crowd and Expert groups are collected separately to avoid bias and to preserve independent aggregation.
Interface language note:
The indicator’s interface may contain non-English labels for ease of use, but full English documentation is provided here in compliance with TradingView House Rules.
Русская версия (optional, allowed only AFTER English):
NeuroSwarm — Мудрость Толпы vs Эксперты (BTC)
Индикатор показывает ежемесячные прогнозы двух групп:
Толпа: медиана и средняя прогнозов
Эксперты: медиана и средняя прогнозов
Значения фиксируются на весь месяц и отображаются на графике горизонтальными уровнями.
Заливка показывает диапазон между медианой и средней.
Цель индикатора — визуализировать настроение толпы и экспертов и сравнить его с реальным движением цены.
Это аналитический инструмент, а не торговая стратегия.
Данные берутся из ежемесячных опросов (1–5 числа), проводимых в рамках проекта NeuroSwarm.


Instant Volume Flow1. Volume Bars (Green/Red)
Shows instantly whether buyers or sellers are dominant.
2. Delta Volume Histogram
Green = net buying pressure
Red = net selling pressure
This lets you spot:
Big sell dumps
Sudden buy absorption
Volume momentum shifts
3. Spike Alerts
You get alerts when volume is more than 2× the 20-MA average volume.

Key Support and ResistanceKEY SUPPORT AND RESISTANCE - USER GUIDE
========================================
OVERVIEW
This indicator automatically identifies and displays key support and resistance levels based on swing highs and swing lows. It uses pivot point detection to mark significant price levels where the market has previously shown reactions, helping traders identify potential entry/exit points and key decision zones.
KEY FEATURES
• Automatic Level Detection: Identifies swing highs (resistance) and swing lows (support) using pivot point analysis
• Dynamic Line Management: Displays only recent levels within a specified lookback period to keep charts clean
• Auto-Extending Lines: Projects support/resistance levels forward to anticipate future price interactions
• Color-Coded Levels: Red lines for resistance, green lines for support for easy visual identification
========================================
PARAMETERS
========================================
Left Bars (Default: 10)
• Minimum: 5 bars
• Number of bars to the left of the pivot point
• Higher values = more significant levels but fewer signals
• Lower values = more sensitive detection but may include minor swings
Right Bars (Default: 10)
• Minimum: 5 bars
• Number of bars to the right of the pivot point
• Must be confirmed by price action before the level is drawn
• Balances between confirmation delay and signal accuracy
Show Last N Bars (Default: 200)
• Minimum: 10 bars
• Only displays support/resistance levels detected within the most recent N bars
• Keeps your chart clean by removing outdated levels
• Adjust based on your trading timeframe and style
Line Extension Length (Default: 48)
• Minimum: 1 bar
• How many bars forward the support/resistance lines extend
• Helps visualize potential future price interactions
• Longer extensions useful for swing trading, shorter for day trading
========================================
HOW TO USE
========================================
FOR SWING TRADERS
1. Use default settings (10/10) or increase to 15/15 for more significant levels
2. Set "Show Last N Bars" to 300-500 to capture longer-term levels
3. Look for price reactions when approaching these levels
4. Combine with volume analysis for confirmation
FOR DAY TRADERS
1. Consider reducing Left/Right Bars to 7-8 for more frequent signals
2. Set "Show Last N Bars" to 100-150 to focus on recent action
3. Reduce "Line Extension Length" to 20-30 bars
4. Watch for intraday bounces or breakouts at these levels
TRADING STRATEGIES
Bounce Trading (Mean Reversion)
• Enter long when price approaches green support lines
• Enter short when price approaches red resistance lines
• Use stop loss just beyond the support/resistance level
• Best in ranging or consolidating markets
Breakout Trading (Trend Following)
• Wait for price to break through resistance (bullish) or support (bearish)
• Confirm with increased volume
• Previous resistance becomes new support (and vice versa)
• Best in trending markets
Multi-Timeframe Analysis
• Check higher timeframe levels for major support/resistance zones
• Use lower timeframe levels for precise entry/exit timing
• Confluence of multiple timeframe levels creates strong zones
========================================
IMPORTANT NOTES
========================================
Line Confirmation Delay
• Lines appear with a delay equal to "Right Bars" parameter
• This delay ensures the pivot point is confirmed
• Real-time level detection requires price action confirmation
Chart Clarity
• Maximum 500 lines can be displayed (TradingView limitation)
• Adjust "Show Last N Bars" if chart becomes too cluttered
• Old lines automatically delete when outside the lookback period
False Signals
• Not all support/resistance levels will hold
• Use additional confirmation (volume, candlestick patterns, other indicators)
• Markets can break through levels, especially during high-impact news
BEST PRACTICES
1. Combine with Other Analysis: Use alongside trend indicators, volume, and price action patterns
2. Context Matters: Consider overall market trend and structure
3. Risk Management: Always use stop losses; don't rely solely on S/R levels
4. Market Conditions: More effective in liquid, actively traded markets
5. Backtesting: Test settings on your specific instrument and timeframe before live trading
TROUBLESHOOTING
Too Many Lines?
• Increase "Left Bars" and "Right Bars" values
• Decrease "Show Last N Bars" value
Too Few Lines?
• Decrease "Left Bars" and "Right Bars" values
• Increase "Show Last N Bars" value
Lines Not Appearing?
• Ensure sufficient price data is loaded on your chart
• Check that "Right Bars" have passed since the last swing point
• Verify indicator is properly loaded (refresh if needed)
TECHNICAL DETAILS
• Uses ta.pivothigh() and ta.pivotlow() functions for level detection
• Implements array-based line management for efficient rendering
• Automatic cleanup of outdated lines to maintain performance
• Overlay indicator - displays directly on price chart
Disclaimer: This indicator is for educational and informational purposes only. It does not constitute financial advice. Always conduct your own research and risk assessment before making trading decisions.
========================================
中文使用指南
========================================
概述
本指標自動識別並顯示基於波段高點和低點的關鍵支撐阻力位。使用樞軸點檢測標記市場先前反應的重要價格水平,幫助交易者識別潛在的進出場點和關鍵決策區域。
主要功能
• 自動水平檢測:使用樞軸點分析識別波段高點(阻力)和波段低點(支撐)
• 動態線條管理:僅顯示指定回看期內的近期水平,保持圖表清晰
• 自動延伸線條:將支撐阻力水平向前投影,預測未來價格互動
• 顏色編碼:紅線表示阻力,綠線表示支撐,便於視覺識別
========================================
參數說明
========================================
左側K棒數(預設:10)
• 最小值:5根K棒
• 樞軸點左側的K棒數量
• 數值越高 = 水平越重要但訊號越少
• 數值越低 = 檢測更敏感但可能包含次要波動
右側K棒數(預設:10)
• 最小值:5根K棒
• 樞軸點右側的K棒數量
• 必須經過價格行為確認後才繪製水平
• 在確認延遲和訊號準確性之間取得平衡
顯示最近N根K棒內的點(預設:200)
• 最小值:10根K棒
• 僅顯示最近N根K棒內檢測到的支撐阻力水平
• 透過移除過時水平保持圖表清晰
• 根據您的交易時間框架和風格調整
線條延伸長度(預設:48)
• 最小值:1根K棒
• 支撐阻力線向前延伸的K棒數
• 幫助視覺化潛在的未來價格互動
• 較長延伸適合波段交易,較短適合當沖交易
========================================
使用方法
========================================
波段交易者
1. 使用預設設定(10/10)或增加至15/15以獲得更重要的水平
2. 將「顯示最近N根K棒」設為300-500以捕捉長期水平
3. 觀察價格接近這些水平時的反應
4. 結合成交量分析進行確認
當沖交易者
1. 考慮將左右側K棒減少至7-8以獲得更頻繁的訊號
2. 將「顯示最近N根K棒」設為100-150以專注於近期行情
3. 將「線條延伸長度」減少至20-30根K棒
4. 觀察日內在這些水平的反彈或突破
交易策略
反彈交易(均值回歸)
• 當價格接近綠色支撐線時做多
• 當價格接近紅色阻力線時做空
• 在支撐阻力水平之外設置止損
• 在區間或盤整市場中效果最佳
突破交易(趨勢跟隨)
• 等待價格突破阻力(看漲)或支撐(看跌)
• 以增加的成交量確認
• 先前的阻力成為新的支撐(反之亦然)
• 在趨勢市場中效果最佳
多時間框架分析
• 檢查更高時間框架的主要支撐阻力區域
• 使用較低時間框架進行精確的進出場時機
• 多個時間框架水平的匯合創造強大區域
========================================
重要注意事項
========================================
線條確認延遲
• 線條出現時會有等於「右側K棒數」參數的延遲
• 此延遲確保樞軸點被確認
• 實時水平檢測需要價格行為確認
圖表清晰度
• 最多可顯示500條線(TradingView限制)
• 如果圖表變得太雜亂,請調整「顯示最近N根K棒」
• 超出回看期的舊線會自動刪除
假訊號
• 並非所有支撐阻力水平都會守住
• 使用額外確認(成交量、K棒型態、其他指標)
• 市場可能突破水平,特別是在重大新聞期間
最佳實踐
1. 結合其他分析:與趨勢指標、成交量和價格行為型態一起使用
2. 背景很重要:考慮整體市場趨勢和結構
3. 風險管理:始終使用止損;不要僅依賴支撐阻力水平
4. 市場條件:在流動性高、活躍交易的市場中更有效
5. 回測:在實盤交易前,在您的特定商品和時間框架上測試設定
故障排除
線條太多?
• 增加「左側K棒數」和「右側K棒數」數值
• 減少「顯示最近N根K棒」數值
線條太少?
• 減少「左側K棒數」和「右側K棒數」數值
• 增加「顯示最近N根K棒」數值
線條未出現?
• 確保圖表上載入了足夠的價格數據
• 檢查自上次波動點以來是否已過「右側K棒數」
• 驗證指標是否正確載入(如需要請刷新)
技術細節
• 使用 ta.pivothigh() 和 ta.pivotlow() 函數進行水平檢測
• 實施基於陣列的線條管理以實現高效渲染
• 自動清理過時線條以保持性能
• 疊加指標 - 直接顯示在價格圖表上
免責聲明:本指標僅供教育和資訊目的。不構成財務建議。在做出交易決策前,請務必進行自己的研究和風險評估。

Ichimoku Multi-Timeframe Heatmap 12/5/2025
Multi-Timeframe Ichimoku Heatmap - Scan Your Watchlist in Seconds
This indicator displays all 5 critical Ichimoku signals (Cloud Angle, Lagging Line, Price vs Cloud, Kijun Slope, and Tenkan/Kijun Cross) across 10 timeframes (15s, 1m, 3m, 5m, 15m, 30m, 1h, 4h, Daily, Weekly) in one compact heatmap table. Instantly spot multi-timeframe trend alignment with color-coded cells: green for bullish, red for bearish, and gray for neutral. Perfect for quickly scanning through your entire watchlist to identify the strongest setups with confluent signals across all timeframes.

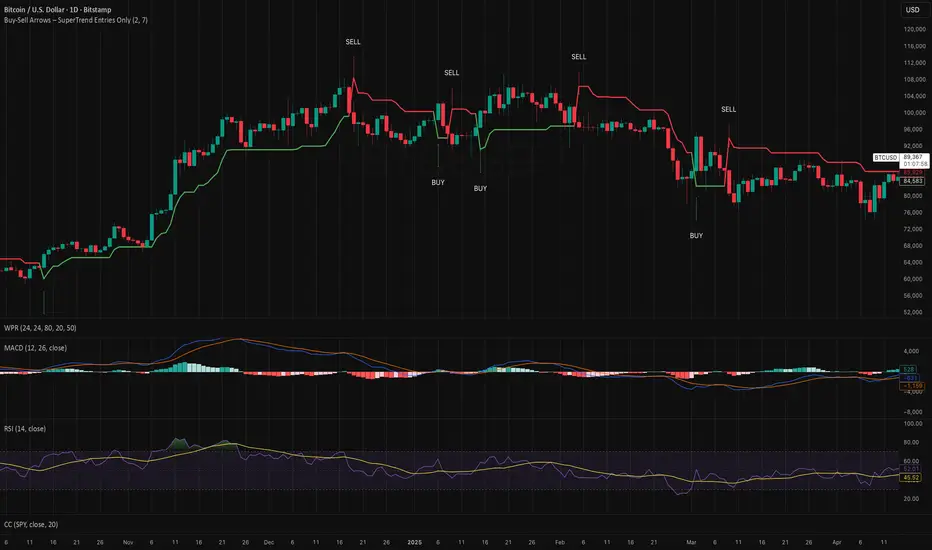
Buy-Sell Arrows – SuperTrend Entries OnlyRecommended Rules for "Buy Calls Only + Exit Fast on Downtrend"
Signal from SuperTrend Script Your Action (Calls Only)
Green BUY arrow → Enter calls (ATM or slightly OTM, 21–45 DTE)
Red SELL arrow → Immediately exit the call (market order or tight stop) — do NOT wait
No position between signals Stay in cash — no calls open during red SuperTrend phases
HH HL LH LL + BOS / CHoCHHH HL LH LL + BOS / CHoCH Structure Indicator (ATR Adaptive)
This indicator provides a complete market structure framework using swing-based pivots, real-time trend detection, BOS (Break of Structure), CHoCH (Change of Character), and optional ATR-adaptive swing sensitivity.
🔹 Core Features
1. Market Structure Labels
The script detects and labels:
HH – Higher High
LH – Lower High
HL – Higher Low
LL – Lower Low
These labels help visualize trend continuation or weakness in structure.
Each label type can be individually toggled ON/OFF in settings.
2. ATR-Based Adaptive Swing Length (Optional)
Swing pivots can be calculated using:
A fixed manual swing length, or
A dynamic ATR-based swing length that adjusts automatically to volatility.
Increasing volatility → longer swings
Decreasing volatility → tighter swings
This makes structure detection more stable and timeframe-adaptive.
3. Close-Based Break of Structure (BOS)
The indicator identifies a BOS when:
Price closes above the previous swing high (Bullish BOS↑)
Price closes below the previous swing low (Bearish BOS↓)
BOS labels can be turned ON/OFF without affecting internal calculations.
4. CHoCH (Change of Character)
CHoCH is triggered when a BOS occurs against the current trend, indicating a potential trend reversal:
CHoCH↑ – Bearish → Bullish reversal
CHoCH↓ – Bullish → Bearish reversal
CHoCH remains active even when BOS labels are turned off.
5. Alerts
The indicator provides alert conditions for:
CHoCH↑ (Bullish Trend Shift)
CHoCH↓ (Bearish Trend Shift)
This allows traders to automate notifications for significant trend changes.
6. Trend State Tracking
The script internally tracks the current structure-based trend:
Uptrend
Downtrend
Undefined
The trend updates dynamically based on real BOS events.
7. Fully Backwards Compatible
The indicator generates structure, BOS, and CHoCH even when scrolling back deep in chart history, thanks to extended max_bars_back handling.
Summary
This tool provides a complete, flexible, and non-repainting framework for market structure analysis, suitable for:
SMC/ICT traders
Swing & intraday traders
Trend traders
Price action analysts
With adaptive swing detection, clean structure labeling, BOS/CHoCH logic, and alert integration, the indicator helps traders understand market transitions with clarity and precision.

Estrategia Trend Following: 52w/26w BreakoutThis is a classic long-term Trend Following strategy, heavily inspired by the Donchian Channel system and the legendary "Turtle Trading" rules. It is designed to capture major market moves (bull runs) while filtering out short-term market noise and volatility.
This script is ideal for investors and swing traders who prefer a "hands-off" approach, looking to catch large trends rather than day-trading small fluctuations.
How it Works:
1. Entry Condition (The Breakout):
52-Week High: The strategy enters a Long position when the price breaks above the highest high of the last 252 trading days (approx. 1 year).
SuperTrend Filter: An additional filter using the SuperTrend indicator ensures that the breakout is supported by positive momentum, helping to reduce false signals during choppy lateral markets.
2. Exit Condition (The Trailing Stop):
26-Week Low: The strategy ignores short-term corrections. It only closes the position if the price closes below the lowest low of the last 126 trading days (approx. 6 months).
This wide stop allows the trade to "breathe" and stay open during significant pullbacks, ensuring you stay in the trend for as long as possible.
Features & Settings:
Customizable Lookback Periods: You can adjust the Entry (default 252 days) and Exit (default 126 days) periods in the settings menu.
Visual Aids:
Blue Line: Represents the 1-Year High (Entry Threshold).
Red Line: Represents the 6-Month Low (Dynamic Stop Loss).
Channel Shading: Visualizes the trading range between the high and low.
Labels: Clearly marks "BUY" and "EXIT" points on the chart.
Recommended Usage:
Timeframe: Daily (1D). This logic is designed for daily candles.
Assets: Works best on assets with strong trending characteristics (e.g., Bitcoin/Crypto, Tech Stocks, Indices like SPX/NDX, and Commodities).
Patience Required: This strategy generates very few signals. It may stay quiet for months and then hold a position for over a year.

ART Customizable Overbought Oversold indicatorThis toolkit will help you identify RSI levels on either extremes, you can customize them.

Minho Index | SETUP+@TraderMinho//@version=5
// By: Trader Minho — Analista Gráfico desde 2022
indicator("Minho Index | SETUP+@TraderMinho", shorttitle="Minho Index (Classic)", overlay=false)
//--------------------------------------------------------
// PARAMETERS
//--------------------------------------------------------
shortPeriod = input.int(3, "Short Period")
mediumPeriod = input.int(8, "Medium Period")
longPeriod = input.int(20, "Long Period")
intensityFactor = input.float(3.0, "Intensity Factor", step = 0.1)
shortSmoothing = input.int(2, "Short Smoothing (EMA)")
mediumSmoothing = input.int(5, "Medium Smoothing (EMA)")
shortColor = input.color(color.new(#00CED1, 0), "Short Line Color (Aqua Blue)")
mediumColor = input.color(color.new(#FFD700, 0), "Medium Line Color (Yellow)")
zeroColor = input.color(color.new(color.white, 0), "Zero Line Color")
lineWidth = input.int(1, "Line Thickness")
//--------------------------------------------------------
// MOVING AVERAGE CALCULATIONS
//--------------------------------------------------------
smaShort = ta.sma(close, shortPeriod)
smaMedium = ta.sma(close, mediumPeriod)
smaLong = ta.sma(close, longPeriod)
//--------------------------------------------------------
// CLASSIC DIDI NORMALIZATION
//--------------------------------------------------------
priceBase = ta.sma(close, longPeriod)
didiShort = ((smaShort - smaLong) / priceBase) * intensityFactor
didiMedium = ((smaMedium - smaLong) / priceBase) * intensityFactor
//--------------------------------------------------------
// FINAL SMOOTHING (CLASSIC NEEDLE EFFECT)
//--------------------------------------------------------
aquaSmooth = ta.ema(didiShort, shortSmoothing)
yellowSmooth = ta.ema(didiMedium, mediumSmoothing)
//--------------------------------------------------------
// PLOTS
//--------------------------------------------------------
hline(0, "Zero Line", color = zeroColor, linewidth = 1)
plot(aquaSmooth, "Short (Aqua)", color = shortColor, linewidth = lineWidth)
plot(yellowSmooth, "Medium (Yellow)", color = mediumColor, linewidth = lineWidth)

alertable spaceman v2slight modification to Key Levels SpacemanBTC IDWM script
credit: spacemanbtc
this is a new version to fix a bug that would pop unwanted alerts on certain levels. I realised the issue was how tradingview handles time. in tradingview,1D paints a new candle at 7pm NY time, but in low timeframe, the "next" day doesn't officially start until 12a.m, like a military clock would. this would cause some repainting issues.
implemented some changes by using stable values that would hopefully circumvent that. script is open sourced in case anyone wants to use it to make changes in case there are other issues
