@Unwind Pressure Detector - AUDITED v3.0SQUEEZE → UNWIND PRESSURE DETECTOR v3.0
The first indicator that not only finds oversold squeezes… but tells you exactly when the move is exhausting and it’s time to take profits.
Fully audited, clean Pine Script v6, zero repainting, zero lag tricks.
WHAT IT DOES
• Detects high-probability squeeze setups (RSI + Volume + VIX + Trend confluence)
• Scores pressure from 0–115 with dynamic sensitivity (Low to Extreme)
• Identifies CRITICAL zones where explosive moves are most likely
• Most importantly → flags the UNWIND when trapped shorts are finally covering and the rally is running out of fuel (perfect profit-taking signal)
FEATURES
• Real-time pressure dashboard (top-right)
• Color-coded background zones (Critical = red, High = orange)
• Smart anti-spam labels with ATR offset
• Three alert conditions:
→ Squeeze Setup
→ Critical Squeeze
→ Unwind / Take Profit
• Works on all markets & timeframes (stocks, forex, crypto, futures)
WHY THIS VERSION IS DIFFERENT
- v3.0 completely rewrote the unwind logic (now requires rally + sharp pressure drop)
- No false unwinds during strong trends
- Built for real trading, not just pretty screenshots
100% Open Source • Fully commented • Free to modify & rep, I want this in the public library forever.
Created with love for the TradingView community
Drop a ♥ and follow if you find it useful!
#squeeze #ttmsqueeze #unwind #volatility #vix #takeprofits #smartmoney
Penunjuk dan strategi

Candlestick PatternsWhat It Does:
Automatically identifies and displays:
🟢 16+ Bullish patterns (Hammer, Engulfing ↑, Morning Star, etc.)
🔴 Bearish patterns (Shooting Star, Engulfing ↓, Evening Star, etc.)
🔵 Break & Retest signals (70-80% win rate setups)
⚪ Neutral patterns (Doji, Spinning Top - indecision)
🎯 Automatic alerts for all major patterns
Purpose: Shows you exactly when reversals are likely and identifies the highest-probability entry points (Break & Retest).Key Patterns:Bullish (Green labels above/below):
HAMMER - Long lower wick, small body (reversal from bottom)
ENGULF ↑ - Big green candle swallows previous red (strong reversal)
MORNING★ - Three candles: red, doji, green (major bottom)
3 BULLS - Three consecutive green candles (strong momentum)
PIERCE - Green closes above 50% of previous red
RETEST ↑ (BEST!) - Price broke resistance, pulled back, bounced (cyan circle)
Bearish (Red labels above/below):
SHOOT★ - Long upper wick, small body (reversal from top)
ENGULF ↓ - Big red candle swallows previous green (strong reversal)
EVENING★ - Three candles: green, doji, red (major top)
3 BEARS - Three consecutive red candles (strong momentum)
DARK☁ - Red closes below 50% of previous green
RETEST ↓ (BEST!) - Price broke support, bounced back, rejected (orange circle)
Neutral:
DOJI - Indecision, potential reversal coming
SPINNING TOP - Small body, long wicks (indecision)
Best Practices:✅ Wait for confirmation - Don't trade pattern alone, check context
✅ Combine patterns - Retest + Candlestick = 80%+ win rate
✅ Check trend - Bullish patterns in uptrend work best
✅ Volume matters - Larger patterns with volume = stronger
✅ Fresh retests - First retest after break = highest probability
✅ Use alerts - Set alerts for Engulfing, Retest, Morning/Evening Star
✅ Size matters - Bigger candles = stronger signals❌ Don't trade every pattern - Quality over quantity
❌ Don't ignore context - Hammer at resistance = weak signal
❌ Don't trade against trend - Bearish in strong uptrend = risky
❌ Don't skip stop loss - Always protect your trades
❌ Don't trade small patterns - Need clear, visible patterns

Support Line [by rukich]🟠 OVERVIEW
The indicator displays a floating line that acts as a support level. It's important to remember that any support level can be broken.
🟠 COMPONENTS
The indicator is based on the percentage difference between the closes of the n-th bar back and the current bar. The resulting percentage is smoothed to remove noise.
The indicator is displayed as a green-red line (the colors don’t carry meaning — they are used just for visual variety). When the price touches the support level, the bar background turns green.
For convenience, there is a label on the right side of the indicator showing the current value of the line.
🟠 HOW TO USE
The indicator includes several settings that can be adjusted, though optimal defaults are provided.
Settings:
Timeframe — specifies which timeframe’s data is used to calculate the line.
Candles back — specifies how many bars back from the current one are used.
The indicator should be used according to general support-zone logic. Since no support zone guarantees a price bounce, the optimal approach is to confirm the reaction after the price touches the line.
Example of use:
In the current example, the Timeframe in the indicator settings is set to 1 hour, and the currently open chart is 5 minutes. This means that on the 5-minute chart we see a 1-hour line. After the price touches the support line, you need to see a confirmation of the reaction to understand whether the support zone is holding the price.
In the examples, reaction confirmation is shown through: the formation of an M5 shift and the invalidation of an FVG M5- (the latter is more risky than the M5 shift):
🟠 CONCLUSION
The indicator shows a floating support zone, and when tested, you should confirm the reaction on a lower timeframe.

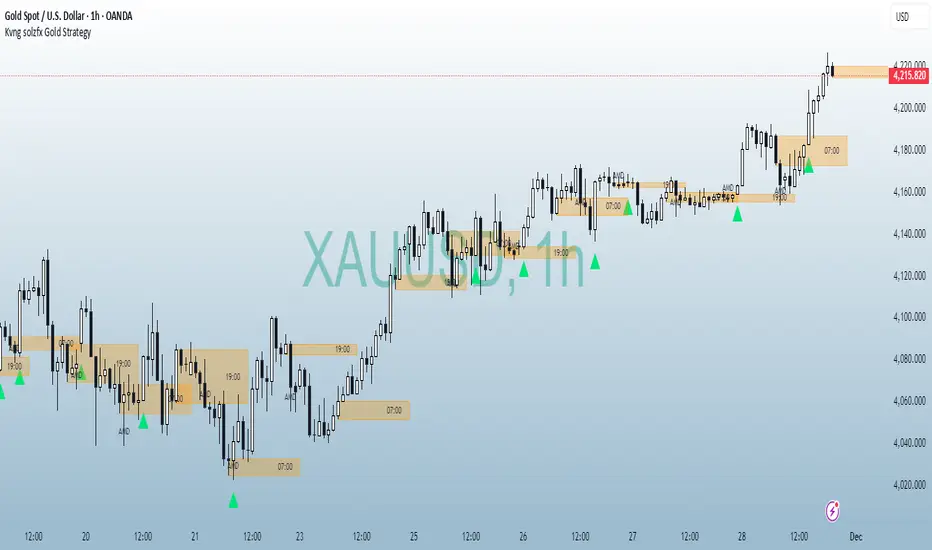
Kvng solzfx Gold StrategyThis indicator helps to find gold setups using kvng solz fx buy only strategy on gold
ES-VIX Daily Price Bands - Inner bands (80% and 50%)ES-VIX Daily Price Bands
This indicator plots dynamic intraday price bands for ES futures based on real-time volatility levels measured by the VIX (CBOE Volatility Index). The bands evolve throughout the trading day, providing volatility-adjusted price targets.
Formulas:
Upper Band = Daily Low + (ES Price × VIX ÷ √252 ÷ 100)
Lower Band = Daily High - (ES Price × VIX ÷ √252 ÷ 100)
The calculation uses the square root of 252 (trading days per year) to convert annualized VIX volatility into an expected daily move, then scales it as a percentage adjustment from the current day's extremes.
Features:
Real-time band calculation that updates throughout the trading session
Upper band (green) extends from the current day's low
Lower band (red) contracts from the current day's high
Inner upper band (green) at 50% of expected move
Inner lower band (red) at 50% of expected move
Middle Inner upper band (green) at 80% of expected move
Middle Inner lower band (red) at 80% of expected move
Shaded zone between bands for visual clarity
Information table displaying:
Current ES price and VIX level
Running daily high and low
Current upper and lower band values

Tomo's Pivots // last W, last M, last Q, last30d, last90d.These are pivots that you can use to look back at various time periods to find magnetic Price points of support and resistance. There are: weekly, last 30 days, last month, last 90 days, and last quarter. You can change the color and style of every indicator and its label. So if it happens to be November 29 today, you will see the last 90 days representing 90 days before November 29. But you will also see last quarter which represents from July 1 to September 30. These values are fair value equilibrium price point by averaging the high low and close of that time period. Weekly is great for intraday trading and the last 30 is great for momentum. Consider using the monthly for swing trading. Stay in the green.

ES-VIX Daily Price Bands - Inner bandsES-VIX Daily Price Bands
This indicator plots dynamic intraday price bands for ES futures based on real-time volatility levels measured by the VIX (CBOE Volatility Index). The bands evolve throughout the trading day, providing volatility-adjusted price targets.
Formulas:
Upper Band = Daily Low + (ES Price × VIX ÷ √252 ÷ 100)
Lower Band = Daily High - (ES Price × VIX ÷ √252 ÷ 100)
The calculation uses the square root of 252 (trading days per year) to convert annualized VIX volatility into an expected daily move, then scales it as a percentage adjustment from the current day's extremes.
Features:
Real-time band calculation that updates throughout the trading session
Upper band (green) extends from the current day's low
Lower band (red) contracts from the current day's high
Inner upper band (green) at 50% of expected move
Inner lower band (red) at 50% of expected move
Shaded zone between bands for visual clarity
Information table displaying:
Current ES price and VIX level
Running daily high and low
Current upper and lower band values

DANCE WITH WOLVES VN ALL TO 1DANCE WITH WOLVES VN is a smart-money volume indicator designed for stocks and crypto.
Main features:
• logic to detect Distribution, No Demand, Absorption and Exhaustion.
• Automatically builds smart Support/Resistance zones from high-volume price leaders.
• Regression trend channel to see the short-term trend and trading range.
• Dashboard table that shows the top high/low price bars with buy/sell volume and group labels.
• Alert conditions for Breakout above resistance and At Support Area so you don’t need to watch the chart all the time.
You can use it on any symbol and timeframe. Just add the script to your chart and follow the zones (red = resistance, green = support) together with the P/L labels and the status line.
Smart Money Volume + Support/Resistance + Trend Channel.
Tự động vẽ vùng hỗ trợ/kháng cự theo volume mạnh/yếu, label (Distribution, No Demand, Absorption, Exhaustion) và kênh xu hướng.
Cách dùng:
Uptrend: ưu tiên mua ở gần cạnh dưới kênh hoặc vùng hỗ trợ.
Downtrend: ưu tiên bán/short ở gần cạnh trên kênh hoặc vùng kháng cự.
Sideway: đánh range – mua gần support, bán gần resistance, cẩn thận false break.
P… = vùng giá cao → nhìn kiếm setup chốt lời / short / tránh FOMO.
L… = vùng giá thấp → nhìn kiếm setup bắt nhịp hồi / entry buy an toàn hơn.

kira 3 mins scalp3-min Strict Scalping HA + PSAR + RSI + 1:2 RR
Purpose: 3-minute scalping using Heikin Ashi candles, Parabolic SAR, and RSI with strict entry rules and automatic 1:2 risk:reward.
Logic:
Entry: 3rd consecutive HA candle with no wick (bullish for buy, bearish for sell)
Filters:
Buy: PSAR below candle + RSI > 50
Sell: PSAR above candle + RSI < 50
SL & TP:
Buy SL: lowest low of last 3 candles
Buy TP: entry + 2×(entry−SL)
Sell SL: highest high of last 3 candles
Sell TP: entry − 2×(SL−entry)
Signals: Triangles plotted on chart; alerts available
Use: Apply on 3-min chart. Enter on 3rd candle meeting conditions; follow SL/TP for 1:2 RR.

ES-VIX Daily Price BandsES-VIX Daily Price Bands
This indicator plots dynamic intraday price bands for ES futures based on real-time volatility levels measured by the VIX (CBOE Volatility Index). The bands evolve throughout the trading day, providing volatility-adjusted price targets.
Formulas:
Upper Band = Daily Low + (ES Price × VIX ÷ √252 ÷ 100)
Lower Band = Daily High - (ES Price × VIX ÷ √252 ÷ 100)
The calculation uses the square root of 252 (trading days per year) to convert annualized VIX volatility into an expected daily move, then scales it as a percentage adjustment from the current day's extremes.
Features:
Real-time band calculation that updates throughout the trading session
Upper band (green) extends from the current day's low
Lower band (red) contracts from the current day's high
Shaded zone between bands for visual clarity
Information table displaying:
Current ES price and VIX level
Running daily high and low
Current upper and lower band values

DANCE WITH WOLVES VN ALL TO 1DANCE WITH WOLVES VN is a smart-money volume indicator designed for stocks and crypto.
Main features:
• logic to detect Distribution, No Demand, Absorption and Exhaustion.
• Automatically builds smart Support/Resistance zones from high-volume price leaders.
• Regression trend channel to see the short-term trend and trading range.
• Dashboard table that shows the top high/low price bars with buy/sell volume and group labels.
• Alert conditions for Breakout above resistance and At Support Area so you don’t need to watch the chart all the time.
You can use it on any symbol and timeframe. Just add the script to your chart and follow the zones (red = resistance, green = support) together with the P/L labels and the status line.
Vietnamese note: Indicator dùng volume + để vẽ vùng hỗ trợ/kháng cự thông minh, label phân phối / hấp thụ / cạn lực bán và kênh xu hướng. Dùng được cho cả stock và crypto. tot nhat dung khung 5 den 15 phut

Cycle Forecast + MACD Divergence (Kombi v6 FULL)This indicator merges two powerful analytical models:
🔮 1. Dominant Cycle Forecasting
The script automatically identifies major structural market cycles by detecting significant swing highs and lows.
It then fits a sinusoidal wave (amplitude, phase, and period) to the dominant cycle and projects it into the future.
Features:
Automatically extracts large, dominant cycles (no noise, no small swings)
Smooth sinusoidal historical cycle visualization
Future cycle projection for 1–2 upcoming cycle periods
Dynamic amplitude and phase alignment based on market structure
Helps anticipate cycle tops and bottoms for long-term timing
📉 2. MACD Divergence Detection
Full divergence detection engine using MACD or MACD Histogram.
Detects:
Bullish Divergence
Price ↓ while MACD (or Histogram) ↑
→ Possible trend reversal upward
Bearish Divergence
Price ↑ while MACD (or Histogram) ↓
→ Possible trend reversal downward
Features:
Pivot-based divergence confirmation (no repaint)
Choice of MACD Line or Histogram as divergence source
Labels + connecting divergence lines
Works across all markets and timeframes
⚙️ Smart Auto-Pivot System
The indicator optionally adjusts pivot sensitivity based on timeframe:
Weekly → tighter pivots
Daily → medium pivots
Intraday → wider pivots
Ensures stable, meaningful divergence signals even on higher timeframes.
🎯 Use cases
Identify upcoming cycle highs/lows
Spot major trend reversals early
Improve swing entries with MACD divergences near cycle turns
Combine forecasting with momentum exhaustion
Suitable for crypto, stocks, indices, forex & commodities
🧠 Why this indicator is powerful
This tool blends time-based cycle forecasting with momentum-based divergence signals, giving you a unique perspective of where the market is likely to turn.
Cycles reveal when a move may occur.
Divergences reveal why a move may occur.
Combined, they offer highly effective market timing.

Renko + PnF Bias Overlay v6Description:
The Renko + PnF Bias Overlay indicator provides a synthesized directional bias derived from manual implementations of both Renko and Point & Figure charting methodologies applied to standard time-based price data.
The indicator calculates Renko brick movements based on ATR-derived brick sizes, creating a noise-filtered representation that only registers significant price movements exceeding the specified brick size threshold. Renko direction changes occur only when price moves a full brick size beyond the previous brick.
Simultaneously, the indicator implements Point & Figure box counting logic with reversal requirements, where directional changes require a minimum of three boxes in the opposite direction, providing additional filtering of minor price fluctuations.
By combining these two price transformation methodologies, the indicator generates a composite directional bias that emphasizes sustained price movements while filtering out minor fluctuations and noise. The resulting bias reflects the underlying trend direction as determined by both the brick-based momentum filtering of Renko charts and the reversal confirmation requirements of Point & Figure charting.
This approach provides a robust trend-following signal that requires both significant price displacement and sustained directional commitment before registering a change in bias.

@Complete Squeeze Cycle Detector v2.0 FINALDescription:
The Complete Squeeze Cycle Detector identifies and tracks the full lifecycle of squeeze formations, from pre-squeeze consolidation through active squeeze periods to squeeze completion. The indicator systematically detects the characteristic conditions that precede and accompany squeeze events.
The indicator monitors multiple factors associated with squeeze development including:
• Volatility compression relative to recent volume activity
• Elevated market stress conditions as measured by VIX levels
• Momentum compression through rate of change measurements across multiple time periods
• Alignment of multiple exponential moving averages indicating consolidation
The squeeze cycle is classified into three distinct phases: Pre-Squeeze Setup, Active Squeeze, and Squeeze Complete. Each phase is identified based on threshold levels of multiple compression metrics, with adjustable sensitivity settings to control the strictness of detection.
The indicator provides visual identification of each phase through labels, background coloring, and an optional dashboard, allowing users to distinguish between the preparation phase where volatility contracts, the active squeeze phase where compression reaches critical levels, and the completion phase where the squeeze releases and directional movement resumes.
This systematic approach enables users to identify squeeze formations throughout their complete development cycle rather than focusing only on the breakout phase.

@DARKPOOL Magnet - MEMEDescription:
The @DARKPOOL Magnet indicator identifies and displays significant price levels where institutional buying and selling activity has created persistent support and resistance zones. The indicator focuses on three primary types of institutional footprints:
Pin Zone Detection: Identifies price levels where multiple pin bars (high volume, narrow range candles) have clustered within a specified tolerance, indicating repeated institutional defense of those levels.
Whale Footprint Detection: Detects absorption events where significant volume occurs with minimal net price movement, suggesting large institutional orders being filled without allowing substantial directional movement.
Dark Pool Detection: Identifies potential dark pool prints characterized by unexplained price gaps that occur without visible tape activity, indicating off-exchange institutional transactions.
The indicator draws horizontal lines at these identified institutional price levels and highlights areas where multiple detection methods converge, creating confluence zones that represent higher probability support and resistance levels.
Confluence lines are displayed when multiple independently identified institutional levels occur within a user-specified proximity, providing visual emphasis on price levels with the strongest institutional interest.

Santhosh Zero lag Trend change AlertThis indicator alert whenever these is a change in trend direction. Change input to match with your Asset/Index. This works well in all time frame, I recommend this for Scalping and Position trading

PALUTLA BUY SELL✅ BUY Signal Logic
A BUY label appears when:
EMA 9 crosses ABOVE EMA 21
AND
Price is trading ABOVE VWAP
This confirms that short-term momentum has turned bullish and price is aligned with the day’s average value — a strong intraday uptrend setup.
🔻 SELL Signal Logic
A SELL label appears when:
EMA 9 crosses BELOW EMA 21
AND
Price is trading BELOW VWAP
This confirms bearish momentum and trade alignment below value, indicating downward continuation potential.
🎯 Visual Features
• Green background / BUY labels → Bullish zone
• Red background / SELL labels → Bearish zone
• Grey background → No-trade zone
• EMA 9 and EMA 21 plotted on the price chart
• VWAP plotted as the session trend reference line
• Clear BUY/SELL labels on crossover candles
⏱ Best Timeframes
➡ Works best on intraday charts:
1m – 15m
VWAP is session-based, so daily/weekly timeframes are not recommended.
⚠️ Disclaimer
This indicator provides technical trade signals only.
Not financial advice.
Always use proper risk management and confirmation before trading.

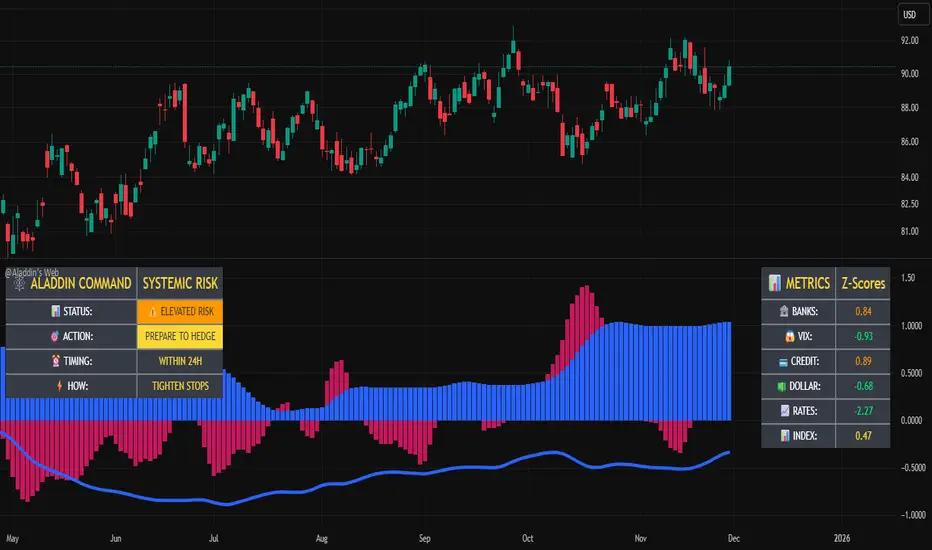
@Aladdin's Trading Web – Command CenterThe indicator uses standard Pine Script functionality including z-score normalization, standard deviation calculations, percentage change measurements, and request.security calls for multiple predefined symbols. There are no proprietary algorithms, external data feeds, or restricted calculation methods that would require protecting the source code.
Description:
The @Aladdin's Trading Web – Command Center indicator provides a composite market regime assessment through a weighted combination of multiple intermarket relationships. The indicator calculates normalized z-scores across several key market components including banks, volatility, the US dollar, credit spreads, interest rates, and alternative assets.
Each component is standardized using z-score methodology over a user-defined lookback period and combined according to configurable weighting parameters. The resulting composite measure provides a normalized assessment of the prevailing market environment, with the option to invert rate relationships for specific market regime conditions.
The indicator focuses on capturing the synchronized behavior across these interconnected market segments to provide a unified view of systemic market conditions.
ES-VIX Expected Daily MoveThis indicator calculates the expected daily price movement for ES futures based on current volatility levels as measured by the VIX (CBOE Volatility Index).
Formula:
Expected Daily Move = (ES Price × VIX Price) / √252 / 100
The calculation converts the annualized VIX volatility into an expected daily move by dividing by the square root of 252 (the approximate number of trading days per year).
Features:
Real-time calculation using current ES futures price and VIX level
Histogram visualization in a separate pane for easy trend analysis
Information table displaying:
Current ES futures price
Current VIX level
Expected daily move in points
Expected daily move as a percentage

Elite Energy Alpha MatrixThe Elite Energy Alpha Matrix indicator provides comprehensive analysis of the energy sector, focusing on the complex relationships between crude oil benchmarks, natural gas, energy-related ETFs, and the performance dynamics across various energy sub-sectors.
The indicator tracks multiple energy price data sources including WTI crude oil, Brent crude, natural gas, and oil ETFs, enabling detailed monitoring of price relationships and divergences within the energy complex.
Key analytical components include:
• Correlation analysis between major energy benchmarks
• Multi-timeframe examination of energy price relationships
• Sector rotation detection within energy sub-sectors including integrated oil majors, exploration and production companies, oilfield services, refiners, pipelines, and renewable energy
• Performance monitoring across different energy market segments
The indicator provides a structured framework for analyzing the internal dynamics of the energy sector, identifying periods of alignment or divergence between different energy price instruments, and monitoring relative performance across energy sub-sectors.
This approach enables users to assess the consistency of price movements across the energy complex and identify situations where different components of the energy market are exhibiting divergent behavior, which can provide insight into the underlying drivers affecting the sector.2.6s

sabaribuysellThe KIRA EMA 9–21 + VWAP indicator is a simple, clean intraday trading tool designed to capture high-probability trend entries using a fast EMA crossover confirmed by VWAP direction.
BUY CONDITION:
EMA 9 crosses above EMA 21 AND price trades above VWAP.
SELL CONDITION:
EMA 9 crosses below EMA 21 AND price trades below VWAP.
Signals are shown directly on the chart with clear BUY and SELL labels.
Background colors highlight trade zones:
• Green = Buy Zone
• Red = Sell Zone
• Grey = No-Trade Zone
This strategy works best on intraday timeframes:
1 minute to 15 minute charts.

Elite Federal Reserve AIThe Elite Federal Reserve AI indicator provides an analytical framework focused on monitoring economic and market conditions that influence Federal Reserve policy decisions. The indicator examines key relationships and rate-of-change metrics across multiple proxies for monetary policy drivers.
The indicator tracks and analyzes:
• Yield curve dynamics through rate-of-change measurements in short and intermediate-term Treasury yields
• Inflation expectations via TIPS breakeven rate momentum
• Dollar strength and its rate of change over specified periods
• Financial market stress indicators including volatility and sector performance metrics
• Breadth measures through small capitalization stock performance
The indicator calculates momentum and rate-of-change values across these variables to identify shifts in the economic and financial conditions that serve as primary inputs to Federal Reserve decision-making. By monitoring the velocity of change in these key relationships, the indicator provides insight into the changing balance between inflationary pressures, growth expectations, financial stability concerns, and currency dynamics.
This approach focuses on the observable market-based indicators that reflect the underlying economic conditions the Federal Reserve considers in its policy formulation, enabling users to assess the prevailing policy environment through the lens of these critical market relationships and their momentum characteristics.

Classic Wave: The Easy WayClassic Wave is a simple strategy with few rules and no over-optimization. Despite its simplicity, it is backed by a nearly century-long historical track record, delivering excellent returns on the weekly chart of the SPX (TVC).
I also recommend observing its strong performance on the SPY (weekly), which is the perfect instrument for executing this strategy with futures in the future.
Strategy Rules and Parameters
When a bullish candle closes above the 20-period EMA, we place the stop-loss below the low of that candle and target a risk-reward ratio of 1:1.
A second, more profitable variant is to change the risk-reward ratio in the code to 2:1.
-Total capital: $10,000
-We use 10% of the total capital per trade.
-Commissions: 0.1% per trade.
The code construction is simple and very well detailed within the script itself.
Risk-Reward Ratio 2:1
Using a 2:1 risk-reward ratio reduces the win rate but significantly increases profitability.
Across the full historical data of the SPX index (weekly), the system would have generated 236 trades, with a win rate of 51.27% and a profit factor of 2.53.
From January 1, 2023, to November 28, 2025, the system would have generated 5 trades, with an 80% win rate and a profit factor of 9.244.
What makes this system so good?
-It takes advantage of the long-term bullish bias of U.S. stock indices and traditional markets.
-It filters out a lot of noise thanks to the weekly timeframe.
-It uses simple parameters with no over-optimization.
Final Notes:
This strategy has consistently outperformed the returns offered by most traditional funds over time, with fewer drawdowns and significantly less stress. I hope you like it.
