Cari dalam skrip untuk "trend"
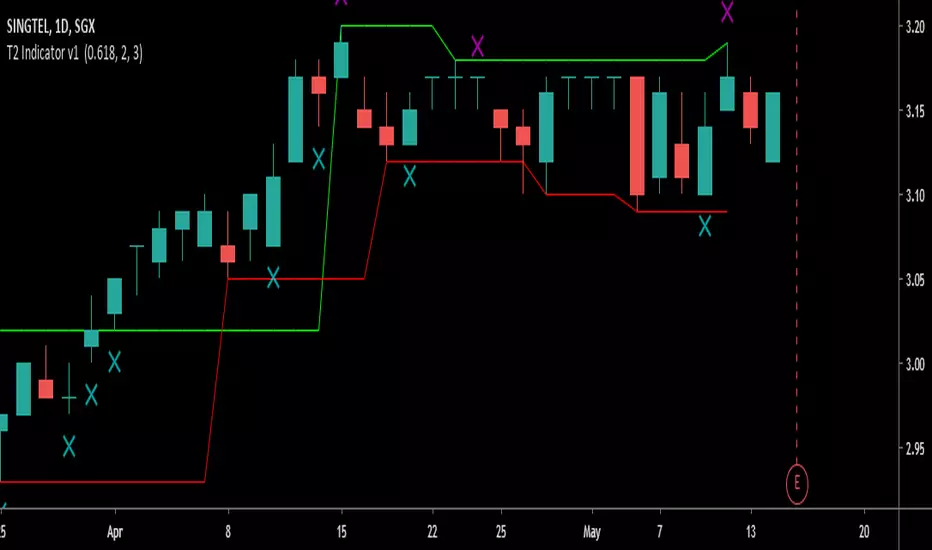
Trend Tracking Indicator v1The Purpose of this Script is to help the user track the trend by
1) Defining clearly Entry and Exit levels
2) Profit Protection Levels
3) Stay in a trend as long as possible
It automatically draws and updates the boxes dynamically as the trend progresses in Stair Stepping Behaviour in uptrend or downtrend
a) Darvas Box (5 Bar System)
b) Fractal Boxes (5 bar System)
There is a switch at the indicator interface for user to choose between Fractal or Darvas boxes to better represent the stock/Crypto/Commodity/Forex
pair the user is trading.
In the event that the trend gears up and runs up in a parabolic behaviour
Alternate Profit Protection Levels based on 2 Bar System is there to provide an alternative to tracking the trend and protecting profits.
In general being a price action indicator, it can apply to any assets or timeframe.
by Crypto DanX.

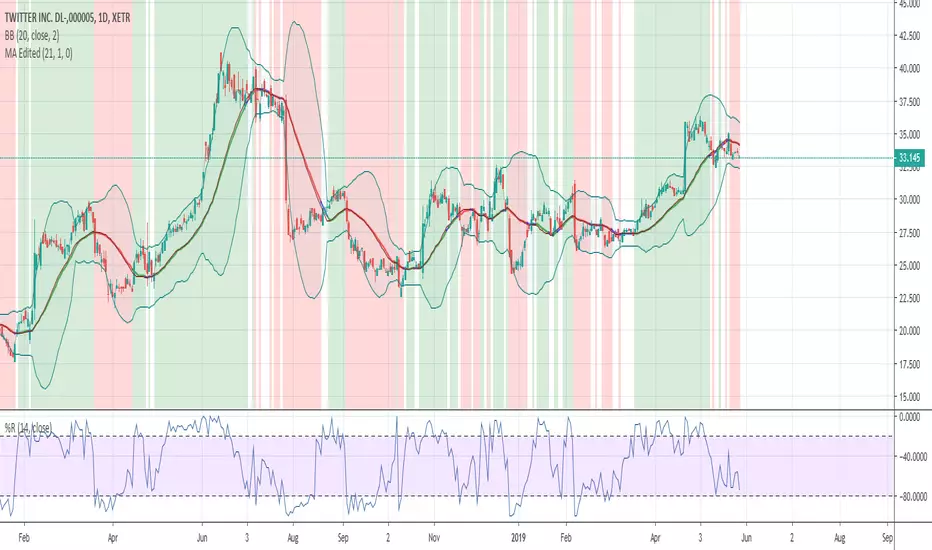
Trend TraderSummary:
Based on the script by Chris Moody. Using HLC3 candles and a default of 50EMA, changes candle colours to determine buy or sell signals.
How it works:
- When the candle closes above the 50EMA, the candle will turn green, open a long (close a short).
- When the candle closes below the 50EMA, the candle will turn red, open a short (close a long).
Quite a conservative strategy, not for day trading. Comes into it's own in trending markets as long as you stick to the signals. Is definitely not for knife catching.
Trade with momentum and set take profits.
I've used it with success on 1D and 4H timeframes.
Use the green and red crossover lines to set alerts when the candle closes (can be automated pretty easily with AutoView).

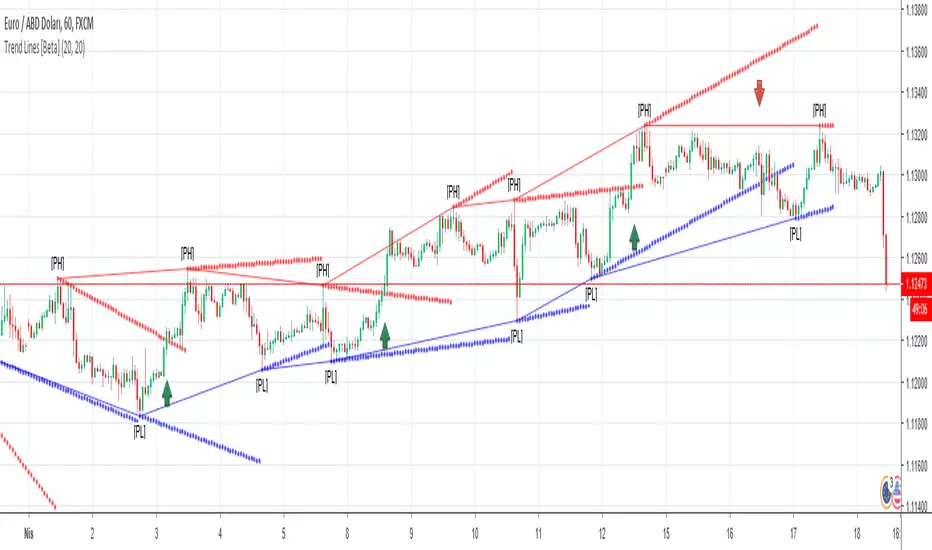
Trend Lines [Beta version]This script finds Pivot high and Pivot low points according to parameters left bar and right bar and then draws trend lines. with this you can see the trend and trend reversals.
This is beta version, please do not hesitate to add comments.
If you find my works useful, please consider a donation
BTC: 16XRqyS3Vgh1knAU1tCcruqhUrVm4QWWmR
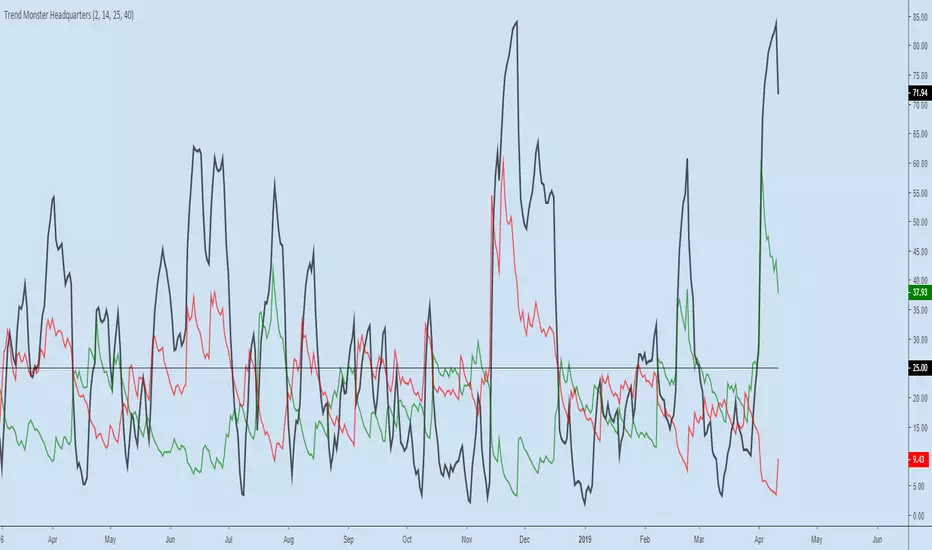
Trend Monster HeadquartersADX-DMI enhanced & modified for faster reaction
ADX (black line) above 80 = mega-trend peaked, reversal imminent, rare case scenario
ADX (black line) above 60 = trend topping out, reversal possible, depending on other indicators
ADX (black line) above 25 threshold = trend strenghening
DMI- (red line) - above 25 - bear trend strenghening
DMI+ (green line) - above 25 - bull trend strenghening
DMI- (red line) - coming off the bottom - bull trend weakening
DMI+ (green line) - coming off the bottom - bear trend weakening

Trend Validation | www.cryptoalphaindicators.comThis indicator is designed to run in the background and provide a bird's eye view of what the prevailing trend is currently (positive/negative).
The navy blue background color indicates a positive trend underway and conversely the red background color indicates a negative trend has been detected.
Formulated with Ehler's Force Index and the Exponential Moving average.
The areas absent of color indicate that no satisfiable correlation was found between price (ema) and the price-to-volume indicator Ehler's Force Index (EFI).
The Trend Validation indicator is available for purchase at www.cryptoalphaindicators.com

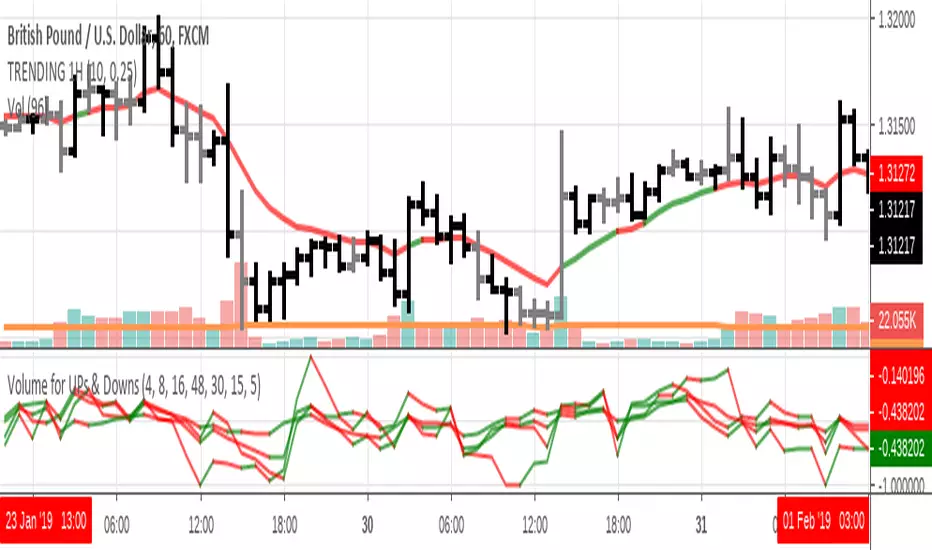
trending script it's trending script, when all the lines on the indicator on closed candle are higher than past value and volume is higher than volume average it's BUY order when all the lines on the indicator on closed value are lower than past value and volume is higher than average it's SELL order, have in mind this script was designed for closed value candles and it's trending script, it will not predict reversals or pivots. it will show you what's really happening on the chart.
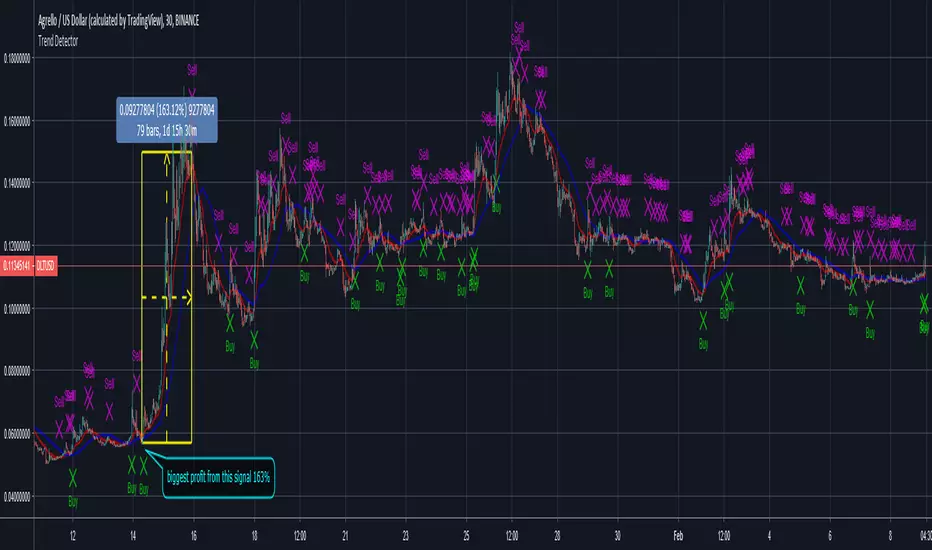
Trend Detector
New indicator for today called Trend Detector, follows the trend. It shows buy signals when coin is going up, sell signals when it is going down. Indicator showed plenty of Buy and Sell signals at the right times for buying and selling DLT . This indicator works on real time so you get the alerts on time so you can action it. Works on other cypto and stocks.
BG-Trend AnalysisTrend Analysis:
Settings for Source:
Chart Period: 1 Hour / 1 Day
Bar Style: Line with Break -
Source: HLC3

Trend Strength, Wyckoff Trend Tracking Trading SystemTrend Strength by Wyckoff Trend Tracking Trading System

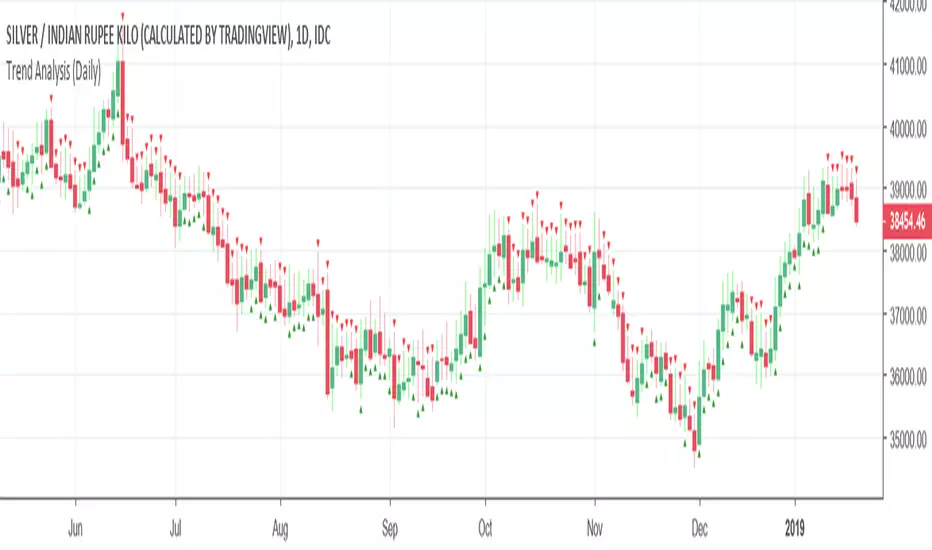
Trend Analysis (Daily)This indicator works for Daily Timeframe in gold and silver.
Users can test it in any other Pair or timeframe.
Used to determine trend from moving average which changes its calculation by the closing of previous close.

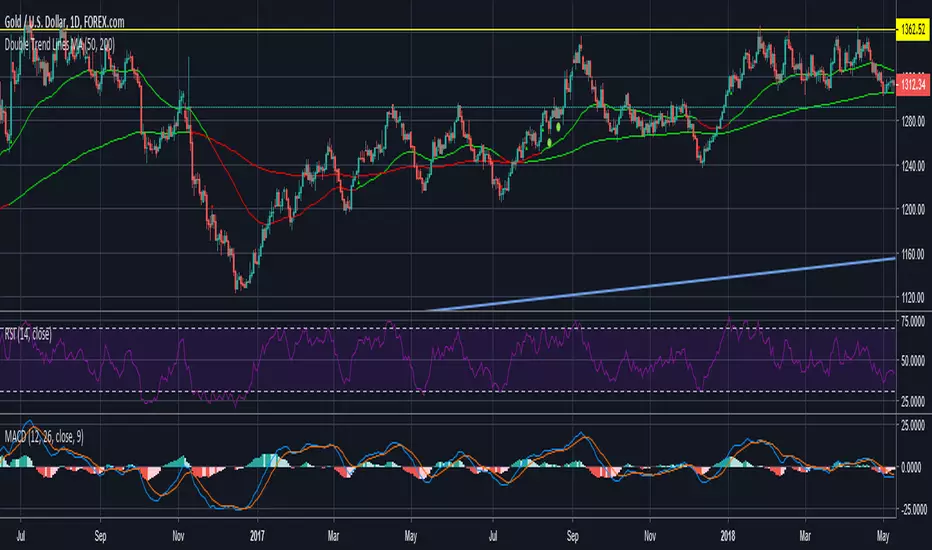
Double Trend Lines MA-ATRTrend indicator using double MA and ATR channel breakout. No repaint and a lot faster than waiting for MA cross.
Trend Follower With Help of Donchian Channels - TFWHDCThis is a simple Day Trade indicator, but can be used for swing and long term trades.
It is based on Donchian Channels to detect trend and point out resistance or support breakouts using arrows.
The bars ared colored when a breakout occurs. When a resistance breakout occurs the current and the next bars are colored green (default) and when a support breakout occurs the current and the next bars are colored red (default). This way this indicator can show if its an uptrend or a downtrend.
I hope this indicator will be useful for many traders!
Thank you!

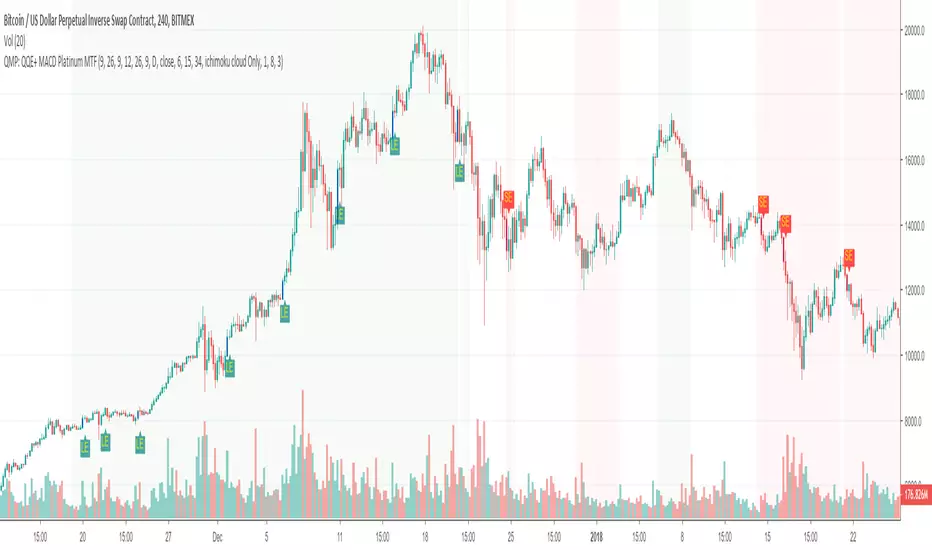
Trend following and reversal strategy for cryptoThe idea of this indicator comes from Jim Brown's book.
using the "MACD Platinum" and "QQE advanced" and multi-timeframe.
The difference to the original idea is that I use Ichimoku cloud for trend detection.
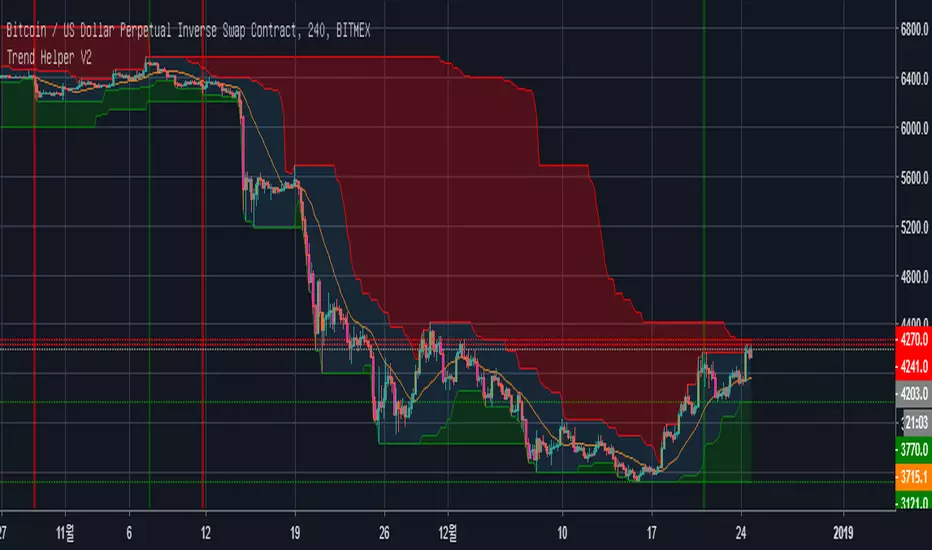
Trend Helper트레이딩의 90%는 추세입니다.
추세에 반대되는 트레이딩은 실패 확률이 매우 높으며
추세에 반대되는 물타기의 끝은 청산입니다.
Swing High/Swing Low 를 통해 만들어지는 구름입니다.
초록색 구름(양운)이 두껍다면 상승추세.
빨간색 구름(음운)이 두껍다면 하락추세.
*일목구름 아닙니다.
--------------------------------------------------------------------
Trading is all about TREND.
Trading against the trend always has high risks, and averaging down against the trend often leads to liquidation.
The script has clouds based on Swing High/Swing Low
If green cloud is thicker than red, it's uptrend.
If red cloud is thicker than green, it's downtrend.
*this is not Ichimoku Cloud.
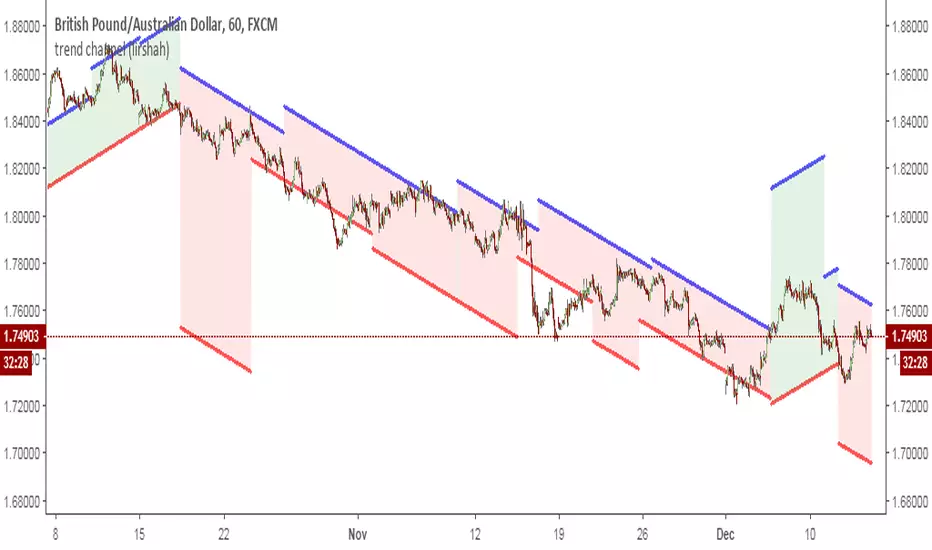
trend channel (lirshah)this indicator shows the trend lines and the channel which price fluctuate within, according to highest and lowest prices (historical data)
every line is calculated according to present bar and no repaint occurs.
trend show strategy(lirshah)this strategy has been created according to trend show(lirshah) indicator.
simplicity, sensitivity to trend change and the lowest repainting has made this strategy unique.
it has good results on almost all markets and is one of the best for manual trading.

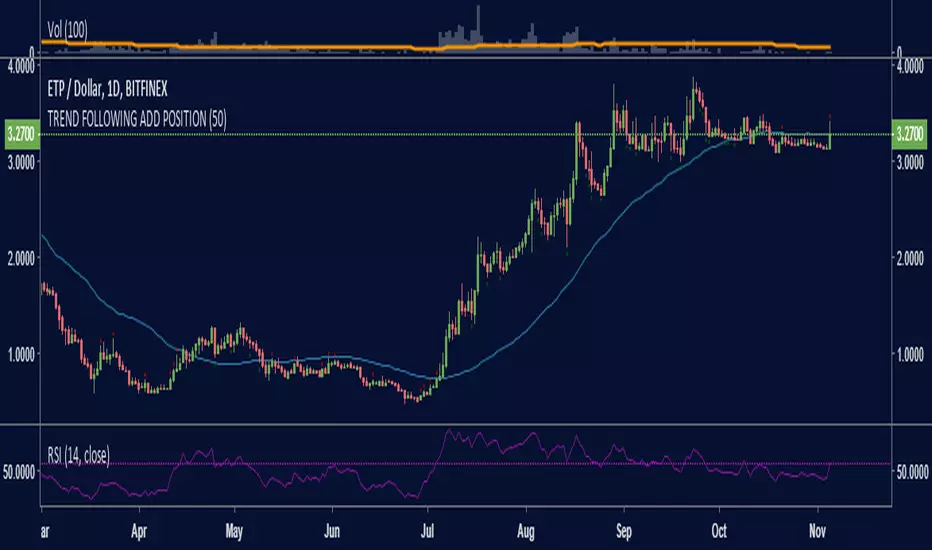
TREND FOLLOWING ADD POSITIONComplimentary to my trend following system, I am trying to easily spot the best points to add positions.
I'm using the same concept of HHHC and LLLC but when they go agains the trend withouth breaking it, in other words just a corrections with momentum which may be a good indication of oversold in and uptrend or overbought in a downtrend.
Trend Trader Bands Backtest This is plots the indicator developed by Andrew Abraham
in the Trading the Trend article of TASC September 1998
It was modified, result values wass averages.
And draw two bands above and below TT line.
