Trend Catcher BotTrend analysis strategy with entry filters such as MACD and Tilson T3. It will look at possible entry points and it can use MACD or TilsonT3 filters to decide whether or not enter in a new trade.
Notes:
- Results include a 0.075% Fee.
- Simulated leverage of 5x.
- Initial Capital of $1000.
- Uses a max order size of $200k per trade (Leverage included).
- Stop loss of 1.15%.
- The stop loss is moved to 0.4% Profit once the Trade reaches 1.15% profit.
- All settings adjustable.
- Non Repainting.
Cari dalam skrip untuk "trend"

Trend MVery simple script where all you need is to put the time frame you are, just put min number
for example 5 min = 5 at Min
1 hour =60
4 hour =240 etc
green are bullish trend
red is bearish
the trend is based on weekly combination of High and Low with no security MTF ,at this way I attempt to put the possible weekly support and resistance to a much lower TF
so it just idea . let me know what you think:)

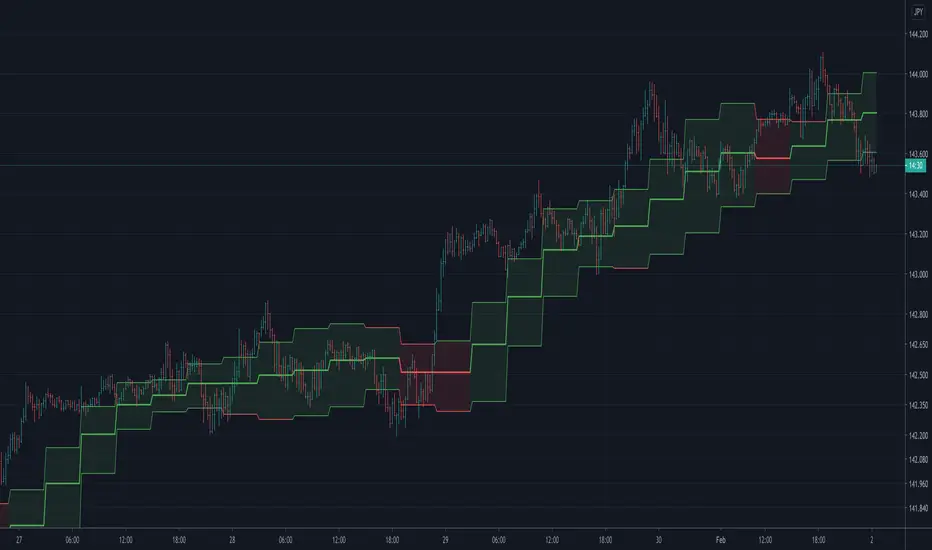
Trend StepTrend Follow Indicator
HTF "Auto" setting is:
< 4Hour : "240"
>= 4Hour and Intraday : "D"
D: Weekly
W: Monthly
M: Yearly
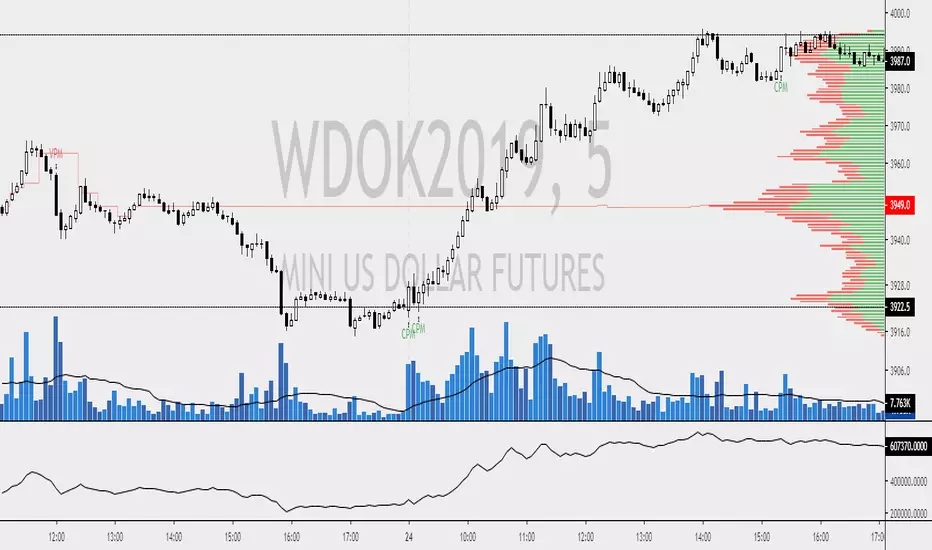
Trend former ver stockTrend Former's stock version service indicator.
It is designed to be printed on daily and three-day bars.
Market characteristics require longer breathing than coin in position.
For further details, we will gradually increase the upload.
트랜드 포머의 주식버전 서비스 지표입니다.
일봉과 3일봉에서 출력되도록 설계 되어 있습니다.
마켓 특성상 포지션에서 코인보다는 더 긴 호흡을 요구합니다.
추가적인 자세한 설명은 점차 업로드를 늘려가도록 하겠습니다.


Trend Strength Indicator, Wyckoff Trend Tracking Trading SystemTrend Strength Indicator by Wyckoff Trend Tracking Trading System

Trend Score by KIVANÇ fr3762Trend Score compares close prices between last close with previous closes by a certain period of time.
It's like momentum but gives a score +1 when close price is equal to or above (defaultly) 10 bars ago and gives a score of -1 when below.
calculation continues from default length to the 2 times of length.
Defaultly (for 10 bars length)
If Trend Score converges to 10; that means there's a strong uptrend
conversely if Trend Score converges to -10; that means a strong downtrend market is on.


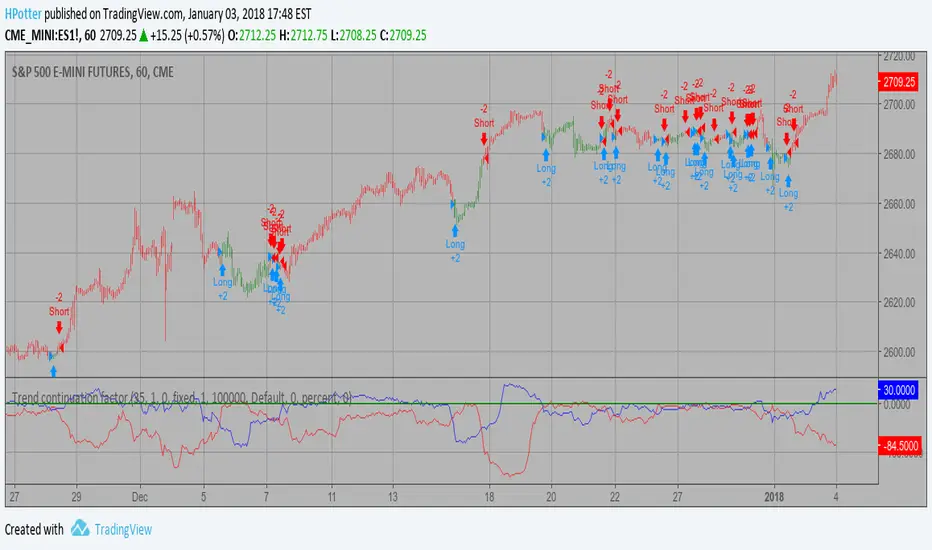
Trend continuation factor Backtest Trend continuation factor, by M.H. Pee
The related article is copyrighted material from Stocks & Commodities.
You can change long to short in the Input Settings
WARNING:
- For purpose educate only
- This script to change bars colors.
Trend continuation factor Strategy Trend continuation factor, by M.H. Pee
The related article is copyrighted material from Stocks & Commodities.
WARNING:
- This script to change bars colors.


Trend continuation factor, by M.H. PeeTrend continuation factor, by M.H. Pee
The related article is copyrighted material from Stocks & Commodities.

Trend Quality IndicatorDescription
This indicator is my interpretation in Pinescript of the "Trend-Quality Indicator" by David Sepiashvili.
The Trend Quality indicator (Q-indicator) is an attempt to estimate trend in relation to noise. It answers the long-standing question of whether a trend change qualifies as significant and promising, or insignificant and better ignored. In terms of noise, trend estimation not only determines whether the trend is reliable, but also allows you to measure its strength gradually. Thus, regardless of their prices, trends of various securities can easily be compared to each other or against any index.
The Trend Quality indicator (or Q-indicator) is a trend detection and estimation tool that is based on a two-step filtering technique. It measures cumulative price changes over term-oriented semi-cycles and relates them to “noise.” The approach reveals congestion and trending periods of the price movement and focuses on the most important trends, evaluating their strength in the process. The indicator is presented in a centered oscillator and banded oscillator format.
Calculation and Logic
To estimate the price dynamics, the cumulative price change (CPC) indicator is used, which measures the amount that the price has changed from a fixed starting point within a given semi-cycle. The CPC indicator is calculated as a cumulative sum of differences between the current and previous prices over the period from the fixed starting point t0. The trend within the given semi cycle can be found by calculating the moving average of the cumulative price change:
Trend = MA (CPC, m, t => t0)
Segmenting the price time series and constructing trends within the extracted semi-cycles offers the smallest average gap between actual and averaged data points. This results in a better fit of the real price dynamics.
Estimating Trend Performance
A basic criterion for estimating trend performance is the amount the trend changes over up or down semi-cycles. If there is little or no visible progress in the trend, it may be considered as nonefficient. Further, significant changes in trend may be considered as promising trading opportunities, but the term “significant” is relative and subject to interpretation.
The Q-indicator is calculated by dividing trend by noise with an appropriate correction factor.
The denominator of the Q-indicator — noise — can be defined as the average deviation of the cumulative price change from the trend. To determine linear noise, first we calculate
the absolute value of the difference between CPC and trend, and then smooth it over the n-point period:
Noise1 = MA(I CPC Trend I,n)
High positive values suggest strong uptrend, low negative values signify strong downtrend, and values fluctuating around the zero level indicate that trend and noise are in equilibrium, i.e., non-trending conditions might be present.
The root mean square noise, similar to the conventional standard deviation, can be derived by summing the squares of the difference between CPC and trend over each of the preceding n-point periods, dividing the sum by n, and calculating the square root of the result.
The Q-indicator is intended to measure trend activity. Some benchmarks can be used to determine the strength of a trend. In the range of Q-indicator values from -1 to +1, the trend is buried beneath noise. It is preferable to stay out of this zone. The greater the Q, the less the risk of trading exceeds this level (absolute value of Q>2), it can be qualified as promising.
Readings in the range from +2 to +5, or from -2 to -5, can indicate moderate trending, and readings above Q=+5 or below Q=-5 indicate strong trending. Strong upward trending often leads to the security’s overvaluing, and strong downward trending often results in the security’s undervaluing. Readings exceeding strong trending benchmarks can indicate overbought or oversold conditions and signal that price action should be monitored closely.
Input Parameters’ Description
Fast Length - the number of bars used in calculation of fast SMA of Trending Periods.
Slow Length - the number of bars used in calculation of slow SMA of Trending Periods.
Trend Length - the number of bars upon which the trend is defined.
Noise Type - defines mechanism of defining noise: linear or root mean square.
Noise Length - the number of bars upon which noise is determined.
Correction Factor - multiplier used in noise calculation.
Threshold Value - In the range of Q-indicator values from -1 to +1, the trend is buried beneath noise. It is preferable to stay out of this zone. The greater the threshold Value of Q-Indicator, the less the risk of trading exceeds this level, it can be qualified as promising. Readings in the range from +2 to +5, or from -2 to -5, can indicate moderate trending, and readings above Q=+5 or below Q=-5 indicate strong trending.
Plots
• Green = buying pressure
• Red = selling pressure
• Yellow = sideways
• ZeroLine = the zero level
In the provided script, multi-timeframe analysis is achieved using the request.security function, which retrieves data from a different timeframe than the one on which the script is running.
Explanation of Multi-Timeframe Logic in Multi-Timeframe selection
• This option retrieves the Trend Quality (TQ) from a higher timeframe if the current chart is intraday.
• The higher timeframe is specified in minutes by the user and converted to a Pine Script timeframe string.
• If the current chart is not intraday or no higher timeframe is specified, the TQ is taken from the current timeframe
Summary:
• Trend Quality Indicator measures established TREND,
• can be used on different timeframes,
• works well on different timeframes,
• the threshold of 2 to 5 should be appropriate for most instruments. It can be modified in chart settings to adapt to your strategy.
The Trend Quality Indicator doesn't predict the future. It is intended to help traders assess the strength of the current trend, giving them a better understanding of the market conditions to make more informed trading choices.
Further Reading
1. "Trend-Quality Indicator" by David Sepiashvili. Technical Analysis of Stocks & Commodities, April 2004.

Trend Strength Momentum Indicator (TSMI)Introducing the Trend Strength Momentum Indicator (TSMI)
With over two decades of experience, I've found that no single indicator can consistently predict market movements. The key lies in combining multiple indicators to capture different market dimensions—trend, momentum, and volume. With this in mind, I present the Trend Strength Momentum Indicator (TSMI), a comprehensive tool designed to spot emerging uptrends and downtrends in cryptocurrency and other asset markets.
1. Overview of TSMI
The TSMI amalgamates three critical market aspects:
Trend Direction and Strength: Utilizing Moving Averages (MA) and the Average Directional Index (ADX).
Momentum: Incorporating the Moving Average Convergence Divergence (MACD) and the Relative Strength Index (RSI).
Volume Confirmation: Employing the On-Balance Volume (OBV) indicator.
By combining these elements, TSMI aims to provide a robust signal that not only indicates the direction of the trend but also confirms its strength and sustainability through momentum and volume analysis.
2. Components and Calculations
A. Trend Component
Exponential Moving Averages (EMA):
50-day EMA: Captures the short to medium-term trend.
200-day EMA: Reflects the long-term trend.
Average Directional Index (ADX):
Measures the strength of the trend regardless of its direction.
A value above 25 indicates a strong trend, while below 20 suggests a weak or non-trending market.
B. Momentum Component
Moving Average Convergence Divergence (MACD):
Calculated by subtracting the 26-day EMA from the 12-day EMA.
The MACD line crossing above the signal line (9-day EMA of MACD) indicates bullish momentum; crossing below suggests bearish momentum.
Relative Strength Index (RSI):
Oscillates between 0 and 100.
Readings above 70 indicate overbought conditions; below 30 suggest oversold conditions.
C. Volume Component
On-Balance Volume (OBV):
Cumulatively adds volume on up days and subtracts volume on down days.
A rising OBV alongside rising prices confirms an uptrend; divergence may signal a reversal.
3. TSMI Calculation Steps
Step 1: Trend Analysis
EMA Crossover:
Identify if the 50-day EMA crosses above the 200-day EMA (Golden Cross), indicating a potential uptrend.
Conversely, if the 50-day EMA crosses below the 200-day EMA (Death Cross), it may signal a downtrend.
ADX Confirmation:
Confirm the strength of the trend. An ADX value above 25 supports the EMA crossover signal.
Step 2: Momentum Assessment
MACD Evaluation:
Look for MACD crossing above its signal line for bullish momentum or below for bearish momentum.
RSI Check:
Ensure RSI is not in overbought (>70) or oversold (<30) territory to avoid potential reversals against the trend.
Step 3: Volume Verification
OBV Direction:
Confirm that OBV is moving in the same direction as the price trend.
Rising OBV with rising prices strengthens the bullish signal; falling OBV with falling prices strengthens the bearish signal.
Step 4: Composite Signal Generation
Bullish Signal:
50-day EMA crosses above 200-day EMA (Golden Cross).
ADX above 25, indicating a strong trend.
MACD crosses above its signal line.
RSI is between 30 and 70, avoiding overbought conditions.
OBV is rising.
Bearish Signal:
50-day EMA crosses below 200-day EMA (Death Cross).
ADX above 25.
MACD crosses below its signal line.
RSI is between 30 and 70, avoiding oversold conditions.
OBV is falling.
4. How to Use the TSMI
A. Entry Points
Buying into an Uptrend:
Wait for the bullish signal criteria to align.
Enter the position after the 50-day EMA crosses above the 200-day EMA, supported by positive momentum (MACD and RSI) and volume (OBV).
Selling or Shorting into a Downtrend:
Look for the bearish signal criteria.
Initiate the position after the 50-day EMA crosses below the 200-day EMA, with confirming momentum and volume indicators.
B. Exit Strategies
Protecting Profits:
Monitor RSI for overbought or oversold conditions, which may indicate potential reversals.
Watch for MACD divergences or crossovers against your position.
Use trailing stops based on the ATR (Average True Range) to allow profits to run while protecting against sharp reversals.
C. Risk Management
Position Sizing:
Use the ADX value to adjust position sizes. A stronger trend (higher ADX) may justify a larger position, whereas a weaker trend suggests caution.
Avoiding False Signals:
Be cautious during sideways markets where EMAs may whipsaw.
Confirm signals with multiple indicators before acting.
5. Examples
Example 1: Spotting an Emerging Uptrend in Bitcoin
Date: Let's assume on March 1st.
Observations:
EMA Crossover: The 50-day EMA crosses above the 200-day EMA.
ADX: Reading is 28, indicating a strong trend.
MACD: Crosses above the signal line and moves into positive territory.
RSI: Reading is 55, comfortably away from overbought levels.
OBV: Shows a rising trend, confirming increasing buying pressure.
Action:
Enter a long position in Bitcoin.
Set a stop-loss below recent swing lows.
Outcome:
Over the next few weeks, Bitcoin's price continues to rise, validating the TSMI signal.
Example 2: Identifying a Downtrend in Ethereum
Date: Let's assume on July 15th.
Observations:
EMA Crossover: The 50-day EMA crosses below the 200-day EMA.
ADX: Reading is 30, confirming a strong trend.
MACD: Crosses below the signal line into negative territory.
RSI: Reading is 45, not yet oversold.
OBV: Declining, indicating selling pressure.
Action:
Initiate a short position or exit long positions in Ethereum.
Place a stop-loss above recent resistance levels.
Outcome:
Ethereum's price declines over the following weeks, confirming the downtrend.
6. When to Use the TSMI
Trending Markets: TSMI is most effective in markets exhibiting clear trends, whether bullish or bearish.
Avoiding Sideways Markets: In range-bound markets, EMAs and momentum indicators may provide false signals. ADX readings below 20 suggest it's best to stay on the sidelines.
Volatile Assets: Particularly useful in cryptocurrency markets, which are known for their volatility and extended trends.
7. Limitations and Considerations
Lagging Indicators: Moving averages and ADX are lagging by nature. Rapid reversals may not be immediately captured.
False Signals: No indicator is foolproof. Always confirm signals with multiple components of TSMI.
Market Conditions: External factors like news events can significantly impact prices. Consider combining TSMI with fundamental analysis.
8. Enhancing TSMI
Customization: Adjust EMA periods (e.g., 20-day and 100-day) based on the asset's volatility and your trading timeframe.
Additional Indicators: Incorporate Bollinger Bands to gauge volatility or Fibonacci retracement levels to identify potential support and resistance.
Conclusion
The Trend Strength Momentum Indicator (TSMI) offers a holistic approach to spotting emerging trends by combining trend direction, momentum, and volume. By synthesizing the strengths of various traditional indicators while mitigating their individual limitations, TSMI provides traders with a powerful tool to navigate the complex landscape of cryptocurrency and other asset markets.
Key Benefits of TSMI:
Comprehensive Analysis: Integrates multiple market dimensions for well-rounded insights.
Early Trend Identification: Aims to spot trends early for optimal entry points.
Risk Management: Helps in making informed decisions, thereby reducing exposure to false signals.
By applying TSMI diligently and complementing it with sound risk management practices, traders can enhance their ability to capitalize on market trends and improve their overall trading performance.

TrendMaster ProTrendMaster Equilibrium X
TrendMaster Equilibrium X is a composite of TrendMaster, MokuMaster and KishokuMaster in one indicator. It is designed to be a drop-in replacement of our flagship indicator, TrendMaster, allowing the user to examine all three indicators on a single chart. The purpose of TrendMaster Equilibrium X is to provide a sentiment filter when assessing possible Trendmaster entries. When all three indicators align, we have equilibrium and can feel confident to take the trade. The indicator is optimised for weekly, daily and 4-hour candlesticks and can be used for all trending markets. It is exclusively available to our Pro tier members.
MokuMaster
MokuMaster is based on Ichimoku and its colours are derived from Ichimoku's depiction of trend conditions. When examining charts for directional bias you can simply check the colour of MokuMaster.
Bright Green - Resolutely Bullish
Green - Bullish
Blue - Neutral
Pink - Bearish
Red - Resolutely Bearish
These categories represent the interactions between Price, the Tenkan-sen, the Kijun-sen, the Kumo and the Chikou Span. This can be overwhelming if you are not an accomplished Ichimoku trader. MokuMaster allows you to view these interactions without the difficulty of interpreting what they mean.
KishokuMaster
KishokuMaster is a very simple indicator designed to provide an immediate representation of the ‘mood’ of the market. It provides an optimal balance of lag and smoothing to help traders establish a Bullish or Bearish bias. The underlying logic is based on Alan Hull's weighting techniques. KishokuMaster generally gives an early warning of a trend reversal.
Confluence
When assessing a TrendMaster entry, you can use TrendMaster Equilibrium as a simple checklist as shown in the annotated chart below. By taking entries that satisfy all criteria, you increase your likelihood of a successful outcome.
How to get it?
If you would like to use TrendMaster Equilibrium or any of our other Indicators, please visit my site. Here you can purchase one of our packages which include indicators, market scanner bots and a large Discord community. You will also find educational content and how to guides for our indicators.
Our Story
Founded in 2018 by IchimokuScholar and C00kie, TrendMaster is a team that produces technical analysis indicators with an emphasis on simplicity and noise reduction. We support a large community with educational content, automated market scanners and mentoring in our private chat rooms. We produce technical analysis indicators geared primarily towards the emerging Cryptocurrency asset class. We provide educational material to assist trader development and host a large online trend following community. All of our products are designed to help traders distinguish relevant information from background noise. Our indicators encourage disciplined trade management to maximise the opportunity captured while minimising losses.
IchimokuScholar
IchimokuScholar – In 2017 I retired from a career in higher education to focus on Trading. I like to trade long term trends, focusing primarily on continuation setups. I am dedicated to sharing my knowledge of trading and take great pleasure in simplifying technical analysis for newer traders.
C00kie
I started trading crypto in 2017 and immediately started coding a bunch of tools to improve my quality of life. Some definitely worked out better than others. Like to trade the higher timeframes and drawing horizontal lines on charts. I am also pretty much obligated to like cookies. Indicators. Here you can purchase one of our packages which include indicators, market scanner bots and a large Discord community. You will also find educational content and how to guides for our indicators.

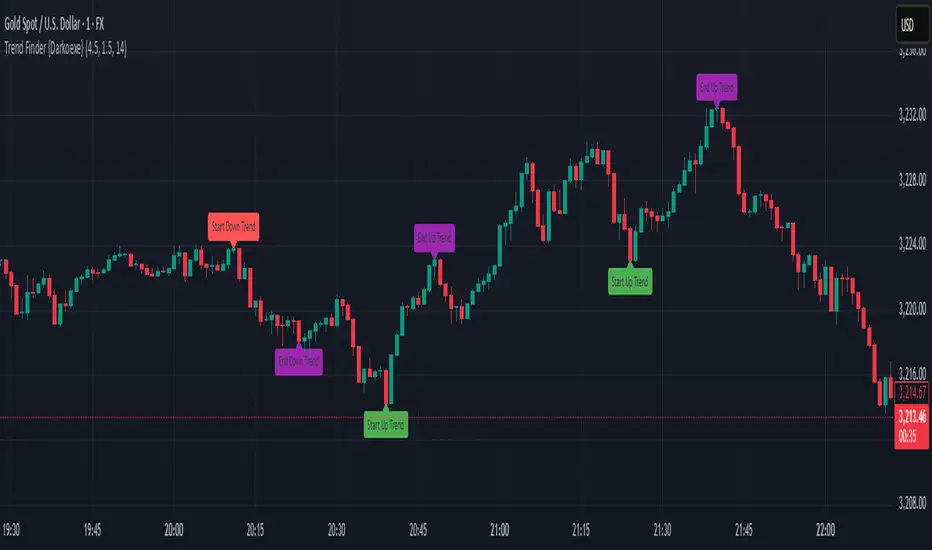
Trend Finder {Darkoexe}This indicator displays the end and start of trends using an ATR factor.
The ATR with trend factor is used to determine the minimum length for a trend to be considered a trend.
The ATR against trend factor is used to determine the minimum length price needs to move against a trend for it to break the trend.
The ATR factors are multiplied with the ATR to determine these lengths.
The labels indicate the starts and ends of trends;
The green label indicates the start of an up trend.
The red label indicates the start of a down trend.
The black/gray label indicates the start of a trend and the end of another trend at the same location.
The purple/pink label indicates the end of a trend.
All the label colors can be changed.
IMPORTANT NOTE: This is a repainting indicator, it should only be used to back test and analyze previous trends. Do not use this indicator for live trading.
Trend and Trendline DetectorTrend and Trendline Detector
Overview
The Trend and Trendline Detector indicator provides both major and minor trend analysis using Simple Moving Averages (SMA) and automatically plots dynamic support and resistance trendlines based on pivot highs and lows.
Key Features
Major Trend Detection: Uses a configurable SMA to determine primary market direction.
Minor Trend Visualization: Optional minor SMA with color-coded line segments to mark smaller trend fluctuations.
Dynamic Pivot Trendlines: Automatically detects pivot highs/lows and draws major (solid) and minor (dashed) trendlines, with user-controlled extension modes.
Customizable Inputs: User can adjust SMA lengths, pivot look back/look forward periods, line extend mode, and toggle features on/off.

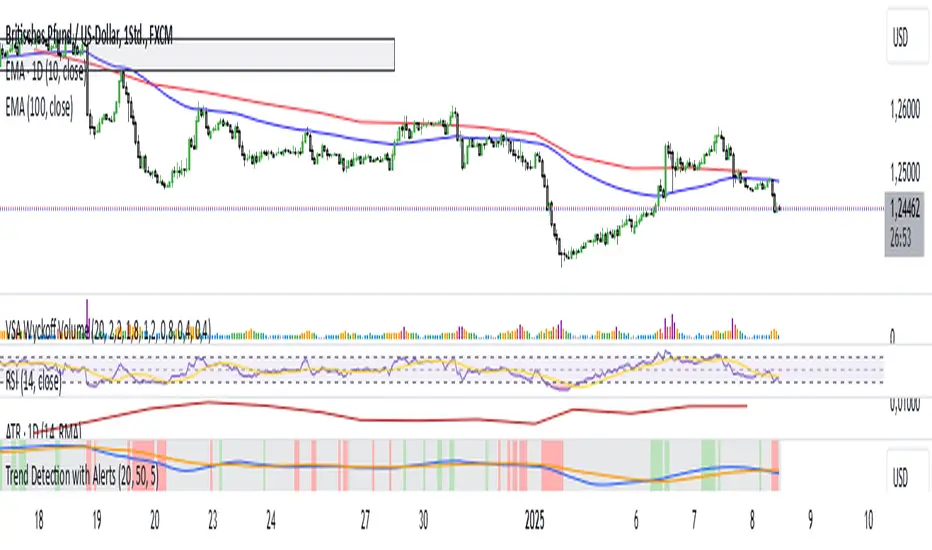
Trend Detection with AlertsPurpose of the Script
The script identifies trends on a chart (uptrend, downtrend, or sideways trend) and provides both visual cues and alerts when a trend changes. It uses two methods for trend detection:
Moving Averages (MA): It compares a short-term moving average (fast) with a long-term moving average (slow).
An uptrend occurs when the short-term MA is above the long-term MA.
A downtrend occurs when the short-term MA is below the long-term MA.
Price Action:
Higher highs (HH) indicate bullish momentum.
Lower lows (LL) indicate bearish momentum.
When these methods align, the script determines the trend and notifies the user of any trend changes.
Key Features
Moving Average Calculation:
A short-term moving average and a long-term moving average are calculated to determine the overall trend direction.
Trend Determination:
An uptrend is detected when the short-term MA is above the long-term MA and higher highs are present.
A downtrend is detected when the short-term MA is below the long-term MA and lower lows are present.
Otherwise, the trend is classified as sideways.
Alerts for Trend Changes:
Alerts are triggered when the trend changes from one state to another (e.g., sideways to uptrend).
Custom messages indicate the type of trend detected.
Background Colors:
The script changes the chart’s background color based on the current trend:
Green for uptrends.
Red for downtrends.
Gray for sideways trends.
Visualization of Moving Averages:
The moving averages are plotted on the chart for visual reference.
How It Works
Inputs for Flexibility:
The user can configure the lengths of the short-term and long-term moving averages.
A lookback period is used to determine higher highs or lower lows for additional confirmation.
Trend Logic:
The script checks the relationship between the moving averages to identify general trends.
It also evaluates price action to confirm trend strength (e.g., whether a higher high or lower low occurred).
Alert System:
When the detected trend changes (e.g., from sideways to uptrend), an alert is triggered. This ensures the user is notified of important market movements.
Dynamic Background Coloring:
The background color of the chart changes to reflect the current trend, making it easy to interpret the trend visually.
Use Cases
Trend Identification: Helps traders quickly identify market trends for decision-making.
Alerts for Trend Changes: Notifies traders when a new trend begins, ensuring they don’t miss key opportunities.
Visual Assistance: Makes it easier to interpret trends through color-coded backgrounds and moving average overlays.
Customization Options
Adjust Moving Average Lengths: Users can modify the short-term and long-term moving averages to suit their trading strategies.
Change Lookback Period: The sensitivity of higher highs and lower lows can be adjusted.
Personalized Alerts: Alerts can be customized for different trading scenarios.
Summary
This script provides an intuitive way to detect and visualize market trends while offering real-time alerts for trend changes. It’s an excellent tool for traders who want to stay informed about market conditions and make data-driven decisions.
Trend Candles Full ColorThe coloring over the candle sticks isn't showing up on the picture for some reason but when you click on the indicator the color coding will appear on the chart.
Trend Candles Full Color Indicator Explanation The "Trend Candles Full Color" indicator, designed for TradingView, visually enhances candlestick charts by coloring candles based on their position relative to a simple moving average (SMA). Here's how it works and how it can benefit traders: How It Works Input : Adjust the SMA period (default is 20) to define the trend length.
Logic : The indicator compares the closing price of each candle to the SMA: Green Candle : Close is above the SMA (indicating an uptrend).
Red Candle : Close is below the SMA (indicating a downtrend).
Gray Candle : Close equals the SMA (neutral/no clear trend).
Output : Candles (body, wick, and border) are colored green, red, or gray based on the trend, overlaid directly on your price chart.
Benefits and Use Cases Trend-Following Strategies Benefit: Clearly identifies bullish (green) or bearish (red) trends, helping traders ride momentum.
Example: A swing trader using a 20-period SMA can enter long positions when candles turn green (price above SMA) and exit or short when candles turn red, confirming trend reversals.
Reversal Trading Benefit: Gray candles signal indecision near the SMA, often a precursor to reversals.
Example: A day trader might watch for gray candles after a prolonged uptrend (green candles) to anticipate a potential bearish reversal, combining with other indicators like RSI for confirmation.
Scalping Benefit: Quick visual cues for short-term trend changes on lower timeframes.
Example: A scalper on a 5-minute chart can use green candles to confirm quick bullish moves and red candles to avoid counter-trend trades, enhancing decision speed.
Position Sizing or Risk Management Benefit: Color changes highlight trend strength, aiding in adjusting trade size or stops.
Example: A trader might increase position size during strong green candle sequences (sustained uptrend) and tighten stops when gray candles appear, signaling potential trend weakness.
Tips for Use Adjust the MA Length to suit your trading style (e.g., shorter for scalping, longer for swing trading).
Combine with other indicators (e.g., support/resistance, MACD) for better accuracy.
Test on different timeframes to match your strategy.
Recommended MA Length for 1-Minute Charts Short-Term/Scalping (1-5 minute trades):10-period SMA : Very sensitive, ideal for capturing quick price movements in fast markets. May produce more noise (false signals).
20-period SMA : A balanced choice for 1-minute charts, smoothing minor fluctuations while reacting to short-term trends. A great starting point for scalpers.
Intraday Trend Trading (10-30 minute holds):50-period SMA : Captures broader intraday trends, reducing noise but lagging slightly. Suitable for larger moves within a session.
This indicator simplifies trend identification, making it a versatile tool for traders of all styles, from beginners to advanced users!
Recommended MA Length for Swing Trading / Higher Timeframes Swing Trading (holding trades for days to weeks):50-period SMA : A popular choice for swing traders on higher timeframes (e.g., 1-hour or 4-hour charts). It smooths out short-term fluctuations while identifying medium-term trends. Ideal for capturing multi-day swings.
100-period SMA : Slightly longer, this MA is great for confirming stronger, more sustained trends. It’s useful on 4-hour or daily charts for swing traders aiming to ride larger price moves.
Longer-Term Trend Trading (holding for weeks to months):200-period SMA : A classic choice for higher timeframes like daily or weekly charts. It highlights major market trends and is widely used by swing and position traders to filter out noise and focus on long-term direction.
150-period SMA : A middle ground between the 100 and 200 SMA, suitable for daily charts when you want a balance between responsiveness and trend reliability.

Trend detection for stocksThis Pine Script indicator combines exponential moving averages (EMA) with the Average Directional Index (ADX) to identify clear upward and downward trends. The chart colors the background according to the trend and optionally displays buy and sell signals as well as alerts.
Functionality in detail:
The Fast EMA (Standard 21) reacts quickly to price changes.
The Slow EMA (Standard 55) smooths the trend more.
If the Fast EMA is above the Slow EMA and the ADX is above the defined threshold, the background turns green – indicating a clear upward trend.
Conversely, a red background signals a dominant downward trend.
Buy and sell arrows appear at the EMA crossover as soon as the ADX confirms that a trend is intact.
