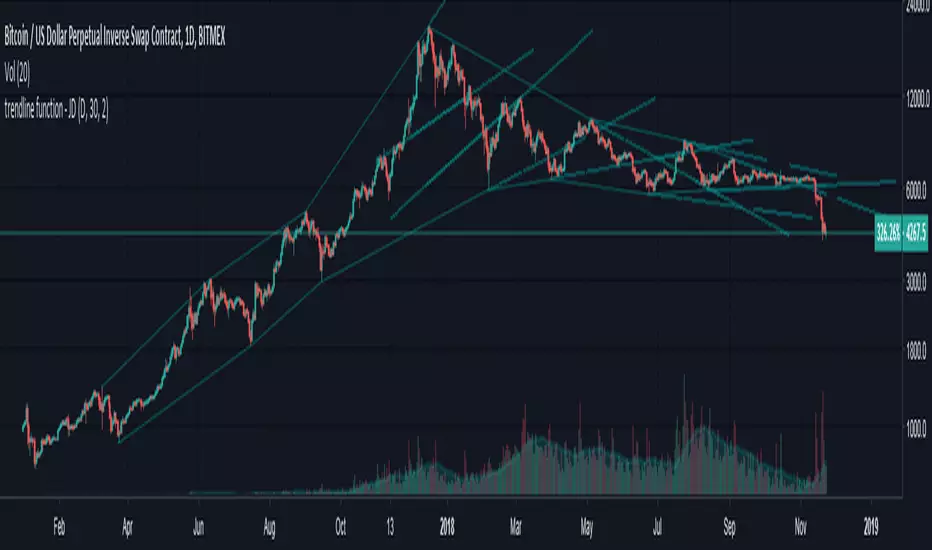
trendline function - JD!EXPERIMENTAL!
As TV doesn't provide a function to draw lines between points, I wrote a function to do this in one my own indicators.
The function itself however can be applied/modified for different use cases, eg. drawing trendlines.
In this (proof of concept) example I used it to draw lines based on past high/low pivot points.
The inputs required:
* an INPUT FUNCTION (in this form, its designed to work with functions that have occasional values and na-values between them, it then connects the non-zero values to form a line)
* a BOOL (to indicate if you want to draw only the rising or falling lines)
* a DELAY (in this case this is the lookback period for the pivot-points function, this is to compensate the calculation of the past and realtime points)
The function returns:
* the function to draw the extension from the BASE-LINE to the current time (here this is the connection of the last pivot-point to the current point to bridge the gap of the lookback period, this is NOT REALTIME!)
* the function to draw the extension for the current time (here this is the continuation of the line until a new pivot-point is valid, this is DRAWN IN REALTIME!!)
* the color of the lines (in this case the lines are only colored (lime or fuchsia) if they either go up or down, else they are invisible, this is to clean up the invalid lines)
these output functions can then simply be plotted using the 'plot' function.
JD.
Cari dalam skrip untuk "trend"
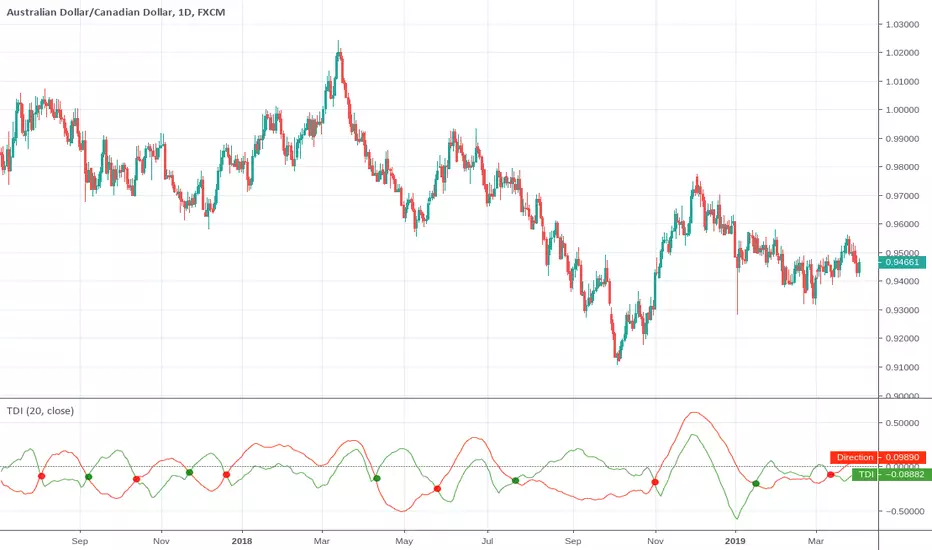
Trend or RangeA remarkably simple but very useful indicator. Earlier and clearer signals than ADX or VHF. More positive ranging signal than any other indicators.
Old conventional theory says when StdDev above ATR then market trending.
I say this idea may be OK for stocks & commodites but for the harmonics of Forex market we need something quicker and clearer. Also never forget time of day in relation to the pairs main movements.
Yellow = StdDev
Aqua = ATR
Red = Smoothed Moving Average of the StdDev
Usage:
Any pair, any time frame. Best used on majors and M15 period or higher
Yellow breaks above Red when below Aqua = Trend building
Yellow breaks below Red when above Aqua = Trend exhausting
Yellow below Red when below Aqua = Ranging/Sideways market

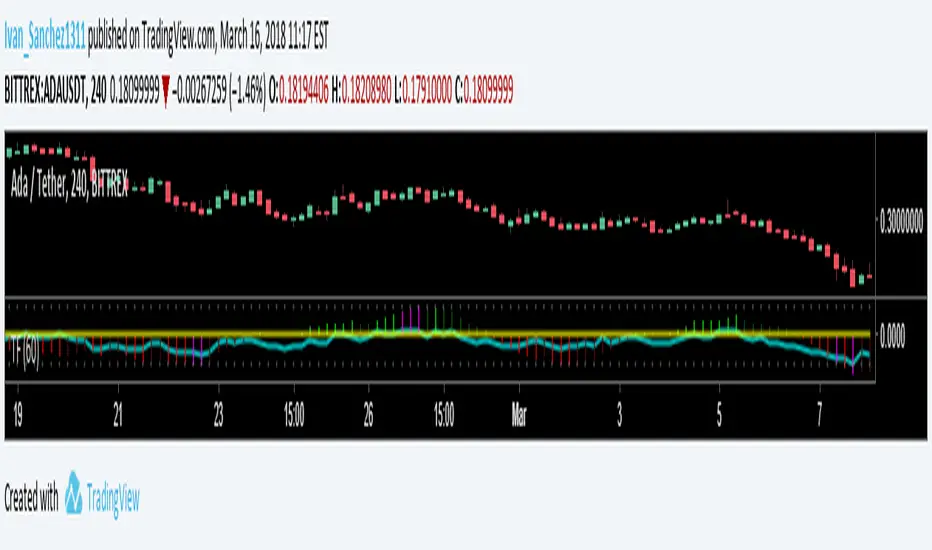
1 HOUR Trend Friend (BTC)Trend Friend V.1.
-The Trend Friend indicator is tuned for 1 HOUR timeframe (BTC) only to capture the overall trend.
-Signals are meant to be possible entries and profit taking opportunities
-No strategy is 100%
-Fib Band width can be adjusted for instrument and volatility
ABOVE BASIS (Uptrend)
Long signals = buy and hold bias
Short signals = take profit OR scalp opportunities
Price drops below basis, exit Long position
BELOW BASIS (Downtrend)
Short signals = Short and hold bias
Long signals = take profit OR scalp opportunities

Trend Detection IndexTrend Detection Index indicator script.
This indicator was originally developed by M.H. Pee (Stocks & Commodities V. 19:10 (54-61): Trend Detection Index).
Trend FollowerTrend Follower (Follower)
The Trend Follower is a powerful trading tool, which helps us to control our operations.
This tool performs different calculations based on market movements, so it becomes a very versatile and reliable indicator.
This indicator tells us NOT to do and at what time it is prudent to leave an operation or take a share of profits.
If you have any questions, please let me know by private chat.
Regards!
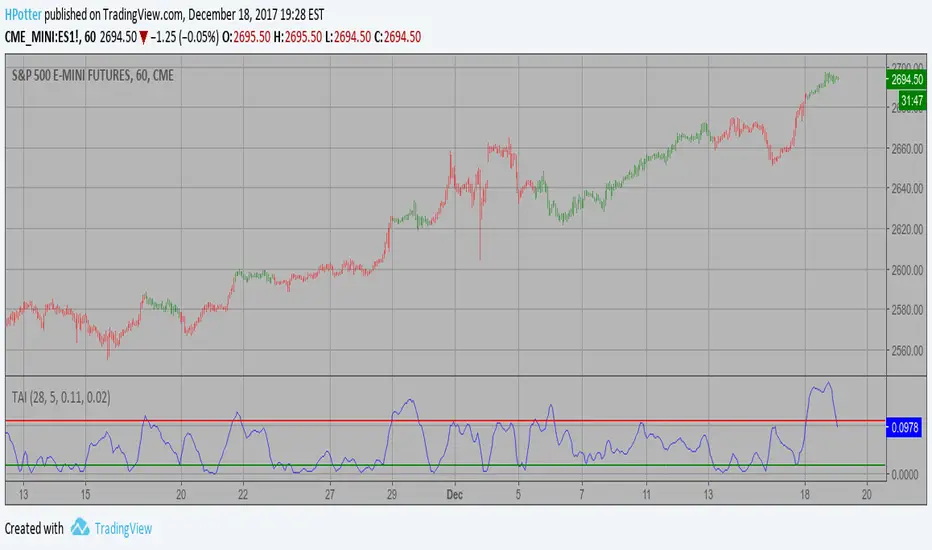
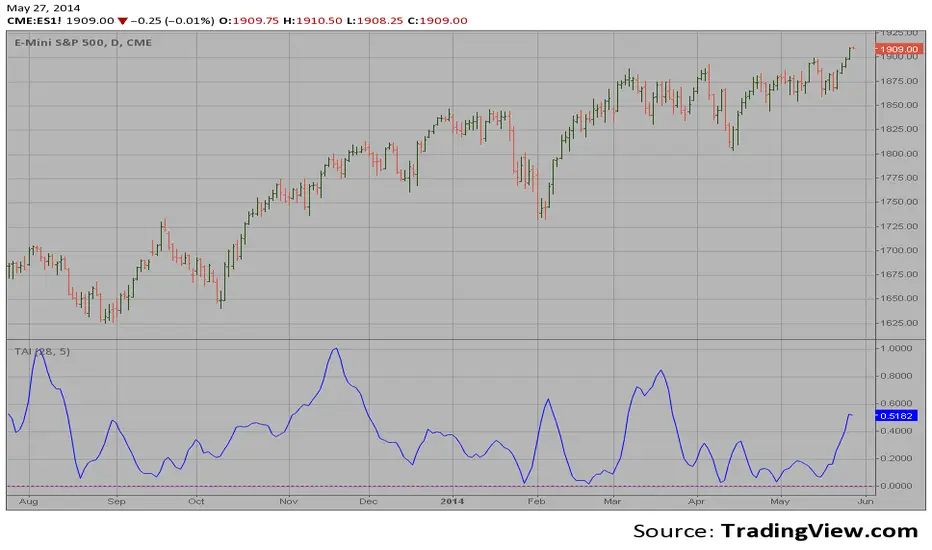
Trend Analysis Index Backtest In essence, it is simply the standard deviation of the last x bars of a
y-bar moving average. Thus, the TAI is a simple trend indicator when prices
trend with authority, the slope of the moving average increases, and when
prices meander in a trendless range, the slope of the moving average decreases.
You can change long to short in the Input Settings
WARNING:
- For purpose educate only
- This script to change bars colors.
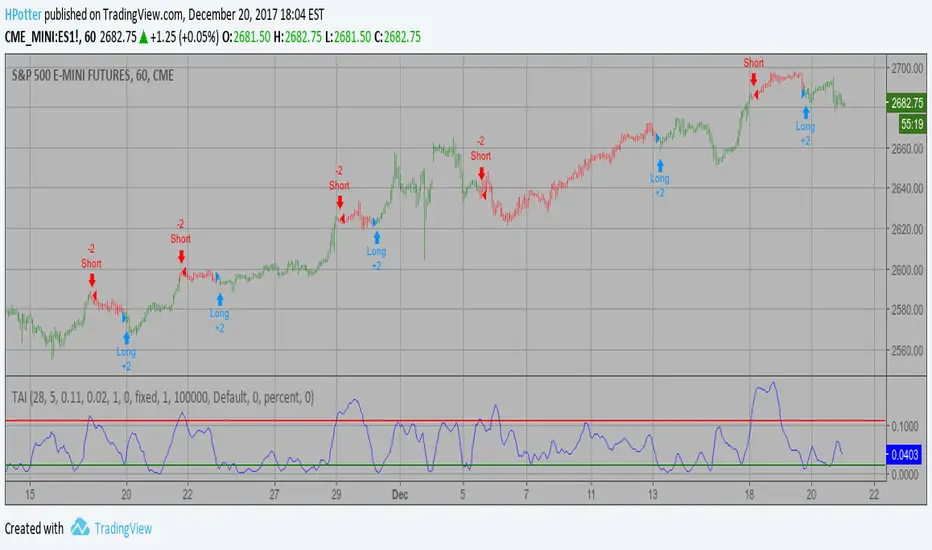
Trend Analysis Index Strategy In essence, it is simply the standard deviation of the last x bars of a
y-bar moving average. Thus, the TAI is a simple trend indicator when prices
trend with authority, the slope of the moving average increases, and when
prices meander in a trendless range, the slope of the moving average decreases.
WARNING:
- This script to change bars colors.
io-trend-follow (1.4)Trend Follow script to be used across all market instruments and timeframes.
You can display long only, short only or both signals.
version 1.4 -> Alerts added
version 1.2 -> Only one signal per trend (default) or multiple entry signals per trend
version 1.1 -> White theme option added

io-trend-follow (1.2)Trend Follow script to be used across all market instruments and timeframes.
Now you can display long only, short only or both signals.
version 1.2 -> Only one signal per trend (default) or multiple entry signals per trend
version 1.1 -> White theme option added

io-trend-follow (1.1)Trend Follow script to be used across all market instruments and timeframes.
Now you can display long only, short only or both signals.
version 1.1 -> White theme option added

Trend FilterThe indicator paints the bar colours based on the average open and average close for past N days.
if average close is above average open, the bars are coloured green, otherwise they are coloured red
It can be used as a general trend filter on weekly, daily bars. even on intraday timeframes, this would work well and give a sense of the current trend direction.
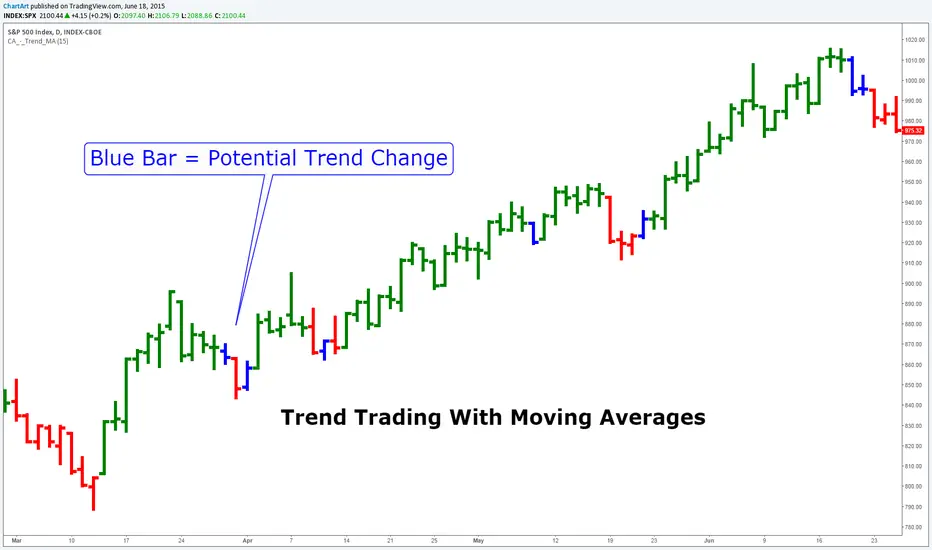
Trend Trading With Moving Averages (by ChartArt)This indicator is measuring if three different moving average calculations (EMA,WMA,SMA) with the same period length are aligned in an uptrend. If this is the case then the bar is colored in green. If only one or two of the three moving averages signals an uptrend then the bar is colored in blue. This can mean that the trend is changing.
Save another $999 bucks with this free indicator.
This is the ChartArt optimized version. Original idea: Steve Primo's Robbery Indicator (PET-D).
coded by UCSgears:
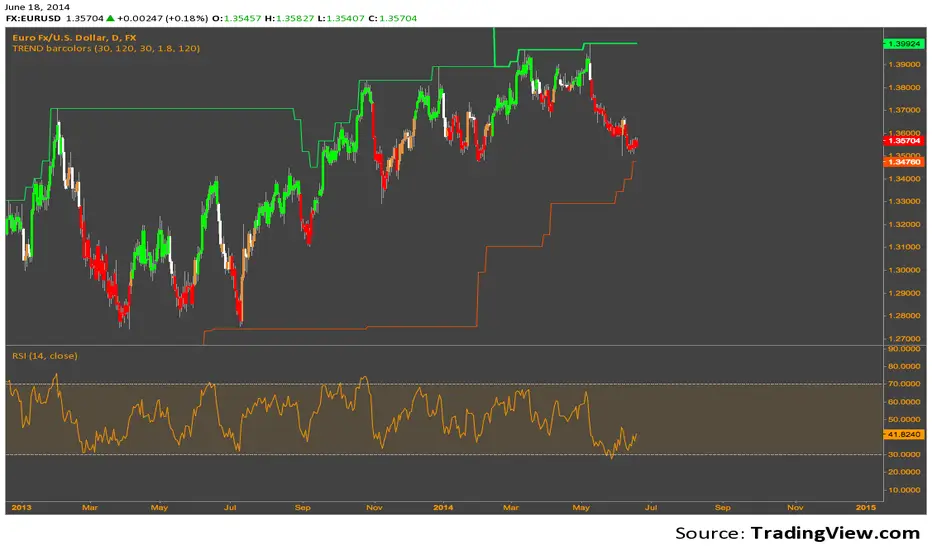
TREND barcolorsThe Donchian values are basically from Ed Sekoytas original statistical run, that gave the values 30 & 120 (aren't as relevant today, but still packs a punch).
The idea of this code is just to take that 30, add a very simple inset of it, with ATR, and color code the bar Green or Red to indicate the direction of the trend. When a new break of the 120 line, (thick line) higher or lower, it typically indicates a bigger bias towards the trend.
It's my first publish, and so a very simple easy to understand system.
Use at your own risk. I cannot be held liable for any damages financial or otherwise, directly or indirectly related to using this script.
Trend Analysis Index In essence, it is simply the standard deviation of the last x bars of a
y-bar moving average. Thus, the TAI is a simple trend indicator when prices
trend with authority, the slope of the moving average increases, and when
prices meander in a trendless range, the slope of the moving average decreases.
TREND WITH DOUBLE CONFIRMATION Hi ,
As the name suggest this is trend based indicator which follows average true range and ema with double confirmation mode , its a very simple indicator for any asset any timeframe , use can switch modes based on the asset they are trading .
Entry LONG Condition: When a buy signal comes and if price is above the movingaverage line then only on the closing of thecandle one will take a buy position
Entry SHORT Condition: When a sell signal comes and if price is below the movingaverage line then only on the closing of thecandle one will take a sell position
Exit from long position if price above and sell signal comes exit long position and re enter buy when buy comes again
Exit from short position if price below and buy signal comes exit short position and re enter sell when sell comes again
----------------
Disclaimer
Copyright by FaizanNawazz.
The information contained in my scripts/indicators/strategies/ideas does not constitute financial advice or a solicitation to buy or sell any securities of any type. I will not accept liability for any loss or damage, including without limitation any loss of profit, which may arise directly or indirectly from the use of or reliance on such information.
All investments involve risk, and the past performance of a security, industry, sector, market, financial product, trading strategy, or individual’s trading does not guarantee future results or returns. Investors are fully responsible for any investment decisions they make. Such decisions should be based solely on an evaluation of their financial circumstances, investment objectives, risk tolerance, and liquidity needs.
My scripts/indicators are only for educational purposes!
Happy Trading!

Trend Zones This tool helps you quickly understand the market’s direction and the strength of the most recent price move:
It identifies whether the market is in an uptrend, downtrend, or flat/sideways phase and clearly marks these conditions on the chart.
It can notify you when the trend changes, so you don’t have to constantly watch the screen.
Each alert includes:
The current closing price
The previous closing price
The difference between the two closes (how much price has moved in one bar)
This makes it easier to see not only what the trend is, but also how strong the latest price move is when the alert triggers.

Trend Mastery:The Calzolaio Way🌕 Find the God Candle. Capture the gains. Create passive income.
Fellow F.I.R.E. Decibels, disciples of the Calzolaio Way—welcome to the sacred toolkit. This indicator, "SulLaLuna 💵 Trend Mastery:The Calzolaio Way🚀," is forged from the elite SulLaLuna stack, drawing wisdom from Market Wizards like Michael Marcus (who turned $30k into $80M through disciplined trend riding) and Oliver Velez's pristine strategies for profiting on every trade. It's not just lines on a chart—it's your architectural blueprint for financial sovereignty, where data meets divine timing to build the cathedral of Project Calzolaio.
We trade math, not emotion. We honor timeframes. Confluence is King. This indicator deploys the Zero-Lag SMA (ZLSMA), Hull-based M2 (global money supply as a macro trend oracle), ATR-smart stops, and multi-TF alignments to ritualize God Candle setups. Backtested across asset classes, it's modular for your playbooks—small risks, compounding gains, passive income streams.
Why This Indicator is Awesome: The Divine Confluence Engine
In the spirit of "Use Only the Best," this tool synthesizes proven SulLaLuna indicators like ZLSMA, Adaptive Trend Finder, and Momentum HUD with Velez's lessons on trend reversals, support/resistance, and psychology of fear. Here's why it reigns supreme:
1. Global M2 Hull: Macro Trend Oracle
Scaled M2 (summed from major economies like US, EU, JP) via Hull MA captures the "big picture" (Velez Ch. 2). It flips colors as S/R—green for support (bullish bounce zones), red for resistance (bearish ceilings), orange neutral. Like Marcus spotting commodity booms, it signals when liquidity sweeps ignite God Candles. Extend it for future price projections, honoring "How a Trend Ends" (Velez Ch. 5).
2. ZLSMA + ATR Smart Stops: Surgical Precision
Zero-Lag SMA (faster than standard MAs) crosses M2 for entries, with ATR bands for initial stops (2x mult) and trails (1x mult). This embodies "Trade Small. Lose Smaller."—risk ≤1-2% per trade, pre-planned exits. Flip markers (↑/↓) alert divine timing, filtering noise like Velez's "First Pullback" setups.
3. HTF & Multi-TF Dashboard: Timeframe Alignments are Sacred
Show HTF M2 (e.g., Daily) with custom styles/colors. Multi-TF lines (4H, D, W, M) dash across your chart, labeled right-edge with 🚀 (bull) or 🛸 (bear). A confluence table (top-right) scores alignments: Strong Bull (≥3 green), Strong Bear, or Mixed. This is "Confluence is King"—no single signal rules; seek 4+ star scores like Rogers buying value in hysteria.
4. Background & Ribbon: Visual Divine Guidance
Slope-based bgcolor (green bull, red bear) for at-a-glance bias. M2 Ribbon (EMA cloud) flips triangles for macro shifts, ritualizing climactic reversals (Velez Ch. 7).
5. Composite Probability: High-Prob God Candle Hunter
Scores (0-100%) blend 8 factors: price/ZLSMA vs M2, TF slopes, ribbon. Threshold (70%) + pivot zone (near M2/ATR) + optional cross filters for HP signals. Labels show "%" dynamically—alerts fire when confluence ≥4, echoing Schwartz's champion edge: "Everybody Gets What They Want" (Seykota wisdom).
6. Alerts & Rituals Built-In
M2 flips, entries/exits, HP longs/shorts—log them in your journal. Weekly reviews dissect anomalies, as per our Operational Framework.
This isn't hype—it's audited excellence. Backtest it: High confluence crushes drawdowns, compounding like Bielfeldt's T-bond mastery from Peoria. We build together; share wins in the F.I.R.E. Decibel forum.
Suggested Strategy: The SulLaLuna M2 Confluence Playbook
Honor the Risk Triad: Position ↓ if leverage/timeframe ↑; scale ↑ only on ≥4 confluence. Align with "God Candle" hunts—rare explosives reverse-engineered for passive streams.
1. Pre-Trade Checklist (Before Every Entry)
- Trend Alignment: D/4H/1H M2 slopes agree? Table shows Strong Bull/Bear?
- Signal on 15m: ZLSMA crosses M2 in confluence zone (near pivot/ATR bands).
- Volume + Divergence**: Supported by volume (use HUD if added); score ≥70%.
- SL/TP Setup: ATR-based stop; TP at structure/2-3R reward (Velez Reward:Risk).
- HTF Agrees: Monthly bull for longs; avoid counter-trend unless climactic (Ch. 7).
Confluence Score: Rate 1-5 stars. <3? Stand aside. Log emotional state—no adrenaline.
2. Execution Protocol
- Entry: On HP Long/Short triangle (e.g., ZLSMA > M2, score 80%+, monthly bull). Use limits; favor longs above M2 support.
- Position Size: ≤1-2% risk. Example: $10k account, 1% risk = $100 SL distance → size accordingly.
- Trail Stops: Move to trail band after 1R profit; let winners run like Kovner's world trades.
- Asset Classes**: Forex/stocks/crypto—test M2's macro edge on EURUSD or NASDAQ (Velez Ch. 6 reviews).
Ritualize: "When we find the God Candele, we don’t just ride it—we ritualize it." Screenshot + reason.
3. Post-Trade Ritual
- Document: Result, confluence score, lessons. Update journal.
- Exits: Hit stop/exit cross? Or trail locks gains.
- Weekly Audit: Wins/losses, anomalies. Adjust params (e.g., M2 length 55 default).
4. Risk Triad in Action
- Low TF (15m)? Smaller size.
- High Leverage? Tiny positions.
- Confluence ≥4 + HTF support? Scale hold for passive compounding.
Example Setup: God Candle Long
- Chart: 15m EURUSD.
- M2 Hull green (support), ZLSMA crossover, 4H/D/W bull (table: Strong Bull).
- HP Long (85% score) near pivot.
- Entry: Limit at cross; SL below ATR lower; TP at next resistance.
- Outcome: Capture 2R gain; trail for more if trend day (Velez Ch. 5).
Community > Ego: Test, share signals in Discord. Backtest in Pine Script for algo evolution.
We are architects of redemption. Each trade bricks the cathedral. Trade the micro, flow with the macro. When alignments converge, we act—with discipline, data, and divine purpose.

Trend Line Proximity Meter (Improved v2 with Recent Touches)Overview
Trend Line Proximity Meter (Improved v2 with Recent Touches) is a powerful overlay tool that transforms any manually-defined trend line (via two configurable points) into a live analytical instrument. It draws the line, auto-detects whether it currently acts as support or resistance, and calculates real-time metrics: % deviation, absolute distance, projected price, slope, historical touch count, and — new in v2 — recent touch count within a user-defined lookback. All data appears in a clean, color-coded dashboard that updates instantly as price moves. Perfect for traders who draw their own channels or trend lines and want objective, quantitative feedback without clutter.
Core Mechanics
Trend Line Creation: Define two points by "bars back" and price type (High/Low/Close/Open/Custom). The script builds the line from those coordinates and optionally extends it as a ray.
Dynamic Role Detection: Automatically classifies the line as Support (price above), Resistance (price below), or Neutral. Auto-colors the line and dashboard accordingly when enabled.
Proximity Engine:
% Deviation: ((close – line price) / line price) × 100
Absolute Distance: close – line price
Projected Price: Exact line value at current bar
Slope: Price change per bar
Touch Counting (v2 Enhancement):
Historical Touches: Total times any candle’s range intersected the line within its drawn/extended segment.
Recent Touches: Same logic but limited to the last N bars (default 50) — instantly shows if the level is “hot” right now.
Tolerance % (default 0.2%) accounts for wicks and minor breaches.
Dashboard: Fully configurable position/size. Displays all metrics with intuitive color coding:
Green/Yellow/Red proximity zones (user-defined thresholds)
Support (green) / Resistance (red) auto-highlighting
Recent vs Historical touch split for quick context
Why This Adds Value & Originality
Most trend line tools only draw lines. This is the only public script that turns a single user-drawn trend line into a full analytical dashboard with real-time deviation %, projected price, slope, and dual touch counters (historical + recent). The recent-touch feature instantly reveals whether a level is currently respected or ignored — information no other indicator provides automatically. Clean, efficient code (no lookahead, no repainting) and smart proximity coloring make it uniquely practical for discretionary traders who rely on hand-drawn lines but want objective data.
How to Use
Draw Your Line:
Set Point 1 (e.g., 100 bars back → Low)
Set Point 2 (e.g., 50 bars back → High)
Adjust style, width, and whether to extend.
Interpret the Dashboard:
Line Type: “SUPPORT” (green) or “RESISTANCE” (red)
Proximity %: +0.4% = price 0.4% above line (green zone = very close)
Recent Touches (Last 50): 4 → level is active now
Historical Touches: 12 → proven significance
Trade Ideas:
Price near line + high recent touches → watch for bounce/rejection
Break with low recent touches → potential trend change
Use alerts for “Price Near Trend Line” or crossovers
Best Practice: Use on 1H–Daily charts; combine with volume or order flow for confluence.
Limitations & Disclaimer
Line is based on two fixed historical points — moving markets may require occasional re-adjustment. Touch detection uses a small tolerance zone (adjustable). No automatic multi-line support (one line per instance). Not financial advice — use with proper risk management. Past performance ≠ future results. Questions? Comment below!

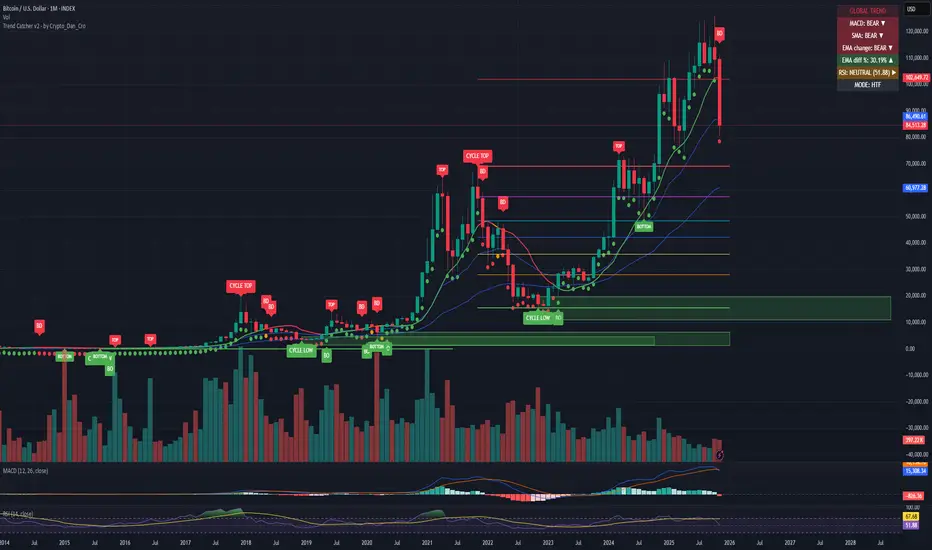
Trend Catcher - Alpha v2 - by Crypto_Dan_CroIf you want to get this indicator, contact me on
X handle: @crypto_dan_cro
What is Trend Catcher v2?
This is the only indicator you need ;)
This indicator is a proprietary market analysis system designed to identify high-probability trading zones by synchronizing multiple layers of market structure, momentum behaviour and cyclical dynamics.
It dynamically adapts to changing market conditions by evaluating:
- macro trend alignment
- structural price positioning
- momentum acceleration & deceleration
- volatility-based reaction zones
- cycle maturity levels
The system filters out low-quality setups and highlights only areas where multiple hidden conditions align, providing:
- trend continuation signals
- structural shift detection
- cycle-based expansion targets
- adaptive support & resistance mapping
Rather than reacting to price alone, the indicator anticipates areas where market psychology historically shifts, allowing traders to position themselves ahead of major moves.
Core philosophy:
This tool does not attempt to predict the market — it tracks the underlying pressure points where probability favours expansion or exhaustion.
It functions as:
- a trend alignment engine
- a cycle decoder
- a volatility interpreter
- a structure validation system
What it gives the user:
- Clear visual guidance without overloading the chart
- Objective market context independent of emotion
- Early trend recognition
- Cycle-aware price targeting
- Decision zones instead of random entries
Ideal for:
- traders who trade structure, not noise
- investors who respect market cycles
- strategists focused on probability over prediction
- disciplined entries & exits
In short:
It is a market interpretation framework built for traders who think two steps ahead.
Contains:
1. Higher Timeframe mode (Monthly / Weekly) on all timeframes
2. Current Chart Timeframe mode
3. Global Trend via BTC MACD
4. SMA
5. EMA
6. BO (Break Out), BD (Break Down) signals
7. TOP & BOTTOM Detection
8. Support & Resistance Zones
9. RSI confirmation
10. Smart Info Panel (Global trend, MACD, SMA, EMA, RSI statuses - Bull, Bear, Neutral)
11. Monthly timeframe (Fibbonaci Retracement levels)
12. Monthly timeframe (all Cycle tops, and Cycle bottoms)
Crypto markets are volatile, if you choose to use this indicator for trading, you are doing it on your own. Crypto_dan_cro is not responsible for any profits or losses created by using this Indicator.
Trend & Strength Detector TSDTrend Strength Detector (TSD)
*Objective Trend Quality Measurement for Educational Market Analysis*
Note: This mathematical framework is a proprietary quantitative model developed by Ario Pinelab, inspired by classical EMA, ADX, RSI and MACD principles, yet not documented in any public technical or academic publication.
## 🎯 Purpose & Design Philosophy
The ** Trend Strength Detector- TSD ** is an educational research tool that provides **quantitative measurement of trend quality** through two independent scoring systems (0-100 scale). It answers the analytical question: *"How strong and aligned is the current market trend environment?"*
This indicator is designed with a **modular, complementary approach** to work alongside various analysis methodologies, particularly pattern-based recognition systems.
## 🔗 Complementary Research Framework
### Designed to Work With Pattern Detection Systems
This indicator provides **environmental context measurement** that complements qualitative pattern recognition tools. It works particularly well alongside systems like:
- **RMBS Smart Detector - Multi-Factor Momentum System**
- Traditional chart pattern analyzers
- Any momentum-based pattern identification tools
🔍 **To find RMBS Smart Detector:**
- Search in TradingView Indicators Library: `" RMBS Smart Detector - Multi-Factor Momentum System"`
- Look for: *Multi-Factor Momentum System*
- By author: ` `
### Why This Complementary Approach?
**Trend Quality Measurement** (TSD - this tool) provides:
- ✅ Structural trend alignment (0-100 score)
- ✅ Momentum intensity levels (0-100 score)
- ✅ Environment classification (Strong/Moderate/Weak)
- 📌 **Answers:** *"HOW STRONG is the underlying trend environment?"*
### Educational Research Value
When used together in a research context, these tools enable systematic study of questions like:
- How do reversal patterns behave when Strength Score is above 70 vs below 30?
- Do continuation patterns in weakening environments (declining scores) show different characteristics?
- What is the correlation between high Alignment Scores and pattern "success rates"?
- Can environment classification help identify genuine trend initiation vs false starts?
⚠️ **Important Note:** Both tools are **independent and work standalone**. TSD provides value whether used alone or with other analysis methods. The relationship with RMBS (or any pattern tool) is **complementary for research purposes**, not dependent.
---
###Mathematical Foundation
##TSA Formula: scoring method developed by Ario
-Trend Model (0 – 100)
TAS = EMA Alignment (0–40) + Price Position (0–30) + Trend Consistency (0–30)
EMA Alignment checks EMA_fast vs EMA_slow vs EMA_trend structure.
Price Position evaluates if Close is above/below all EMAs.
Consistency = 3 × max(bullish,bearish bars within 10 candles).
-Strength Model (0 – 100)
Strength = ADX (0–50) + EMA Slope (0–25) + RSI (0–15) + MACD (0–10)
ADX measures trend energy; Slope shows EMA momentum %;
RSI assesses zone positioning; MACD confirms directional agreement.
Note: This formula represents a proprietary quantitative model by Ario_Pinelab, inspired by classical technical concepts but not published in any external reference.________________________________________
📊 Environment Classification
Based on Total Strength Score:
🟢 Strong Environment: Score ≥ 60
→ Well-defined momentum, clear directional bias
🟡 Moderate Environment: 40 ≤ Score < 60
→ Mixed signals, transitional conditions
🔴 Weak Environment: Score < 40
→ Ranging, choppy, low conviction movement
Color Coding:
• Green background: Strong (≥60)
• Yellow background: Moderate (40-59)
• Red background: Weak (<40)
________________________________________
📈 Visual Components
Main Chart Display
Score Labels (Top-Right Corner):
┌─────────────────────────────────┐
│ 📊 Alignment: 75 | Strength: 82 │
│ Environment: Strong 🟢 │
└─────────────────────────────────┘
Color-Coded Background:
• Environment strength visually indicated via background color
• Helps quick identification of market regime
• Customizable transparency (default: 90%)
Reference Lines:
• Dotted line at 60: Strong/Moderate threshold
• Dotted line at 40: Moderate/Weak threshold
• Mid-line at 50: Neutral reference
________________________________________
🔧 Customization Settings
Input Parameters
The best setting is the default mode.
🚫 Important Disclaimers & Limitations
What This Indicator IS:
✅ Educational measurement tool for trend quality research
✅ Quantitative assessment of current market environment
✅ Complementary analysis tool for pattern-based systems
✅ Historical data analyzer for systematic study
✅ Multi-factor scoring system based on technical calculations
What This Indicator IS NOT:
❌ NOT a trading system or signal generator
❌ NOT financial advice or trade recommendations
❌ NOT predictive of future price movements
❌ NOT a guarantee of pattern success/failure
❌ NOT a substitute for comprehensive risk management
________________________________________
Known Limitations
1. Lagging Nature:
⚠️ All components (EMA, ADX, RSI, MACD) are calculated
from historical price data
→ Scores reflect CURRENT and RECENT conditions
→ Cannot predict sudden reversals or black swan events
→ Trend measurements lag actual price turning points
2. Whipsaw Risk:
⚠️ In choppy/ranging markets, scores may fluctuate rapidly
→ Moderate zone (40-60) can see frequent transitions
→ Low timeframes more susceptible to noise
→ Consider higher timeframes for stable measurements
3. Component Conflicts:
⚠️ Individual components may disagree
→ Example: Strong ADX but weak RSI alignment
→ Scores average these conflicts (may hide nuance)
→ Check individual components for deeper insight
4. Not Predictive:
⚠️ High scores do NOT guarantee continuation
⚠️ Low scores do NOT guarantee reversal
→ Measurement ≠ Prediction
→ Use for CONTEXT, not SIGNALS
→ Combine with comprehensive analysis
________________________________________
Risk Acknowledgments
Market Risk:
• All trading involves substantial risk of loss
• Past performance (even systematic studies) does not guarantee future results
• No indicator, system, or methodology can eliminate market risk
Measurement Limitations:
• Scores are mathematical calculations, not market predictions
• Environmental classification is descriptive, not prescriptive
• Strong measurements can deteriorate rapidly without warning
Educational Purpose:
• This tool is designed for LEARNING about market structure
• Not designed, tested, or validated as a standalone trading system
• Any trading decisions are user’s sole responsibility
No Warranty:
• Indicator provided “as-is” for educational purposes
• No guarantee of accuracy, reliability, or profitability
• Users must verify calculations and apply critical thinking
Open Source
Full Pine Script code available for educational study and modification. Feedback and improvement suggestions welcome.
“All logic is presented for research and educational visualization.”
---

Trend Profit Tracking——JackFinanceTrend Profit Tracking Indicator Usage Guide1. Chart Interpretation and UsageSignals: Green "Buy" (below bar) for long entry; red "Sell" (above bar) for short entry or close long. Based on ATR stop reversal.
Trend Line: Green = bullish (support); red = bearish (resistance); gray = neutral.
Background: Light green/red = trend environment.
Filter Band: Green fill confirms bullish; red confirms bearish. Signals more accurate when price is inside the band.
Volume: Yellow bars = unusual volume spike; combine with signals for reversal hints.
Table (top-right): Bullish; Bearish; Neutral.
2. Trading ApplicationEntry: Signal + matching filter band color (green for long, red for short).
Exit: Reverse signal or price hits trend line/band edge.
Stop-Loss: Use built-in trailing stop; ATR multiplier for position sizing.
Best For: Daily/4H trend charts; avoid choppy markets.
Backtest: Verify in strategy tester (~55-65% win rate with defaults).
3. TipsCombine with RSI for filters.
Trading involves risk; decide at your own discretion.

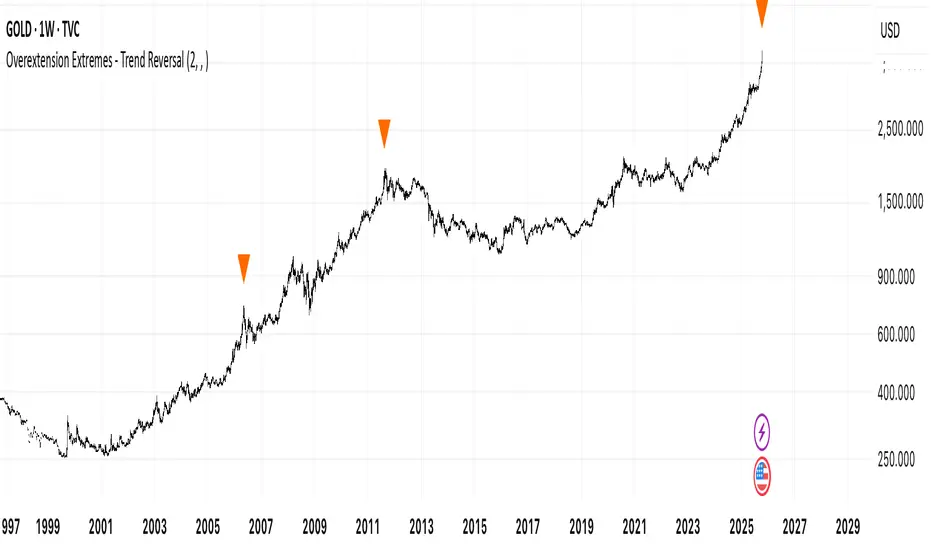
Overextension Extremes - Trend ReversalOverextension Extremes Indicator
This indicator identifies potential market reversal points by measuring price distance from multiple moving averages relative to volatility (ATR). It combines five independent conditions to detect overextension:
Signal Components:
PR1: Volatility spike (4-period ATR exceeding 2× baseline) with significant MA distance
PR2: Extreme distance from long-term moving average baseline (SMA1000)
PR3: RSI extremes (>84 or <20) combined with price distance thresholds
PR4: Volume exhaustion (2× average) with momentum fatigue (5+ consecutive bars)
PR5: Parabolic moves (all conditions met simultaneously)
Confluence Filter:
The user sets minimum simultaneous signals required (1-5). Higher confluence reduces signal frequency but increases reliability. A consecutive signal filter prevents multiple entries during the same overextension episode unless price moves 7× ATR(30) from the initial signal.
Technical Parameters (Fixed):
Moving Averages: HMA(300, 80, 30), SMA(1000)
Volatility: ATR(4, 30, 100, 400)
RSI: 14-period with adaptive thresholds
Distance calculated in ATR multiples for normalization across assets
Signals appear as visual markers on chart. Automated alerts include customizable prefix/suffix for webhook integration.
TREND (Type II) | Hamster-CoderTREND (Type II) — Smart Trend Reversal Indicator Based on RCI & MACD
TREND (Type II) is a powerful tool for traders who want to spot not just where the market is now, but where it might be heading next.
It combines the analytical strength of RSI and MACD to identify potential trend reversal points before they become obvious on the chart.
🚀 Key Advantages
Early trend detection. TREND can anticipate possible reversals even before the actual crossover occurs.
Flexible visualization. Displayed in a separate panel while showing buy/sell signals directly on the main chart.
Multi-timeframe support. Analyze signals from higher or lower timeframes without switching charts.
Intuitive color background. The background automatically turns red during bearish conditions for instant market sentiment recognition.
🎯 Signal Types
Primary Signal. When RCI and MACD lines actually cross, confirming a trend shift.
Preliminary Signal. When a crossover is projected to occur on the next bar.
Overheat Signal. When the market reaches a defined threshold (e.g. ±90) and starts showing signs of cooling down.
🧠 Unique Features
Extra Filters (experimental). Filters out weak or false signals, showing only those confirmed by additional criteria.
RCI–MACD Difference Mode. Visualize the distance between RCI and MACD as a histogram to assess divergence strength.
Custom Thresholds. Define your own overbought/oversold zones to fine-tune signal sensitivity.
🔍 Who It’s For
TREND (Type II) is ideal for traders who:
seek dynamic entry and exit points without lagging indicators;
want visual and statistical confirmation of trend changes;
build multi-layered strategies requiring signal validation.
💬 Use TREND (Type II) to see the market one step ahead.
This isn’t just another indicator — it’s an early warning system for potential trend reversals .
