Trailing Stop Loss Smart [TradingFinder] Market Trend + CVD/EMA🔵 Introduction
Trailing Stop Loss (TSL) is one of the most powerful tools available. A Trailing Stop Loss is a modification of a typical stop order that adjusts dynamically based on market price movement. It can be set at a defined percentage or dollar amount away from the security's current market price, making it a flexible tool for locking in profits while minimizing risk. Unlike standard stop-loss orders, a Trailing Stop follows the market in the direction of the trade, protecting gains without requiring constant manual adjustments.
The Trailing Stop Loss Smart (TFlab Trailing Stop) indicator takes this concept even further by incorporating advanced metrics like Cumulative Volume Delta (CVD), volume dynamics, and Average True Range (ATR). This combination not only enhances risk management but also acts as a trend identifier, providing traders with a powerful tool to capitalize on both short-term and long-term price movements.
This indicator also supports various Order Types, allowing for flexible strategies that include a trailing stop/stop-loss combo to maximize winning trades while minimizing losses. The trailing stop limit is particularly useful for traders who want to set their stop at a precise level relative to the current market price, either by a percentage or a dollar amount. The Trailing Stop Loss Smart indicator can help ensure that traders do not exit too early during trends, while the stop-loss feature kicks in during reversals.
The advantages of using a Trailing Stop Loss are its ability to protect profits and reduce the emotional decision-making process in volatile markets. However, like all trading strategies, it has disadvantages, such as the risk of triggering too early during normal market fluctuations. By understanding how the Trailing Stop Loss Smart indicator integrates features like CVD, ATR, and volume analysis, traders can leverage its full potential while navigating these pros and cons.
With its unique ability to track market movements and trends using Cumulative Volume Delta, volume dynamics, and ATR-based trailing stops, this indicator offers a complete solution for traders looking to secure profits while minimizing downside risk. Whether you're employing a simple trailing stop or a trailing stop/stop-loss combo, this tool provides all the flexibility and precision needed to execute winning trades in various markets, including Forex, Crypto, and Stock.
🔵 How to Use
The Trailing Stop Loss Smart indicator integrates multiple advanced components to provide traders with superior risk management and trend identification.
Here’s how each part of the logic works :
🟣 Cumulative Volume Delta (CVD) Logic
The CVD tracks buying and selling pressure by calculating the difference between upward and downward price movements. When there’s more buying pressure, the CVD is positive, indicating a potential bullish trend. Conversely, more selling pressure results in a negative CVD, pointing to a bearish trend.
CVD Trend Detection : The indicator determines whether the market is in a bullish or bearish phase by comparing the CVD to its moving average. A bullish trend is confirmed when the CVD is above its moving average and the price is closing higher.
A bearish trend occurs when the CVD is below its moving average and the price is closing lower. This trend detection is critical for determining whether the trailing stop should be placed below the price (bullish) or above it (bearish).
🟣 Volume Dynamics
Volume is a key factor in identifying market strength. The Trailing Stop Loss Smart indicator pulls volume data based on the market selected (Forex, Crypto, or Stock) and adjusts the trailing stop based on whether the market is experiencing high volume or low volume.
High Volume : When the current volume exceeds the average volume, the market is in a high-volume state. During these conditions, the trailing stop is placed closer to the price, as high volume often indicates strong trends with less chance of reversals.
Low Volume : In low-volume conditions, the trailing stop gives the market more room to breathe by placing the stop further away from the price. This prevents premature stop-outs in periods of reduced market activity.
🟣 ATR-Based Trailing Stop
The Average True Range (ATR) is used to measure market volatility. The Trailing Stop Loss Smart uses the ATR to dynamically adjust the stop-loss distance.
Bullish Market : When a bullish trend is detected, the trailing stop is placed below the lowest price of the recent bars (determined by the Bar Back parameter), and adjusted by the ATR Multiplier. This allows for tighter protection during strong bullish trends.
Bearish Market : When the market is bearish, the trailing stop is placed above the highest price of recent bars, also adjusted by the ATR Multiplier. This ensures that short positions are safeguarded against sudden reversals.
🟣 Dynamic Stop-Loss Updates
The trailing stop is updated every few bars (according to the Refiner parameter), ensuring it remains relevant to the most recent price action and volume changes. This dynamic feature ensures the stop-loss adapts to both trending and volatile market conditions, without requiring manual intervention.
High Volume with Trends : In periods of high volume and a confirmed trend, the stop-loss is positioned tightly to lock in profits while minimizing the risk of reversal.
Low Volume with Trends : In low-volume conditions, the stop-loss is placed further from the price, allowing the market to move freely without triggering premature exits.
🟣 Visual Representation
The indicator visually represents the trailing stop on the chart, with green lines indicating bullish trends and red lines for bearish trends. This visual aid helps traders quickly assess the state of the market and the position of their trailing stop in real-time.
🔵 Settings
The Trailing Stop Loss Smart indicator offers several customizable settings to suit various trading strategies. Understanding these inputs is key to optimizing the tool for your specific trading style.
🟣 General Settings
Cumulative Mode : This controls how the CVD is calculated.
You can choose between :
EMA : Exponential Moving Average smoothing.
Periodic : Sums the delta over a fixed period.
CVD Period : Defines the look-back period for CVD calculation. A longer period smooths the data, making it less sensitive to short-term fluctuations.
Ultra Data : This Boolean input aggregates volume across multiple exchanges for a more comprehensive view of market activity.
Market Ultra Data : Select between Forex, Crypto, and Stock to ensure the indicator pulls accurate volume data for your market.
🟣 Logical Settings
Moving Average CVD Period : Defines the period for the moving average of the CVD. A longer period smooths the trend, reducing noise.
Moving Average Volume Period : Sets the period for the moving average used to distinguish between high and low volume conditions.
Level Finder Bar Back : Determines how many bars to look back when identifying the highest or lowest price for trailing stop placement.
Levels update per candles : Sets how often (in bars) the trailing stop should be updated to remain in sync with market movements.
ATR On : Toggles the use of ATR to adjust the trailing stop based on volatility.
ATR Multiplie r: Defines how far the stop is placed from the price based on the ATR. A larger multiplier increases the stop distance, reducing the likelihood of getting stopped out during market fluctuations.
ATR Multiplier Adjusts the distance of the trailing stop based on the ATR. A higher multiplier places the stop further from the price, providing more breathing room in volatile markets.
🔵 Conclusion
The Trailing Stop Loss Smart indicator is a comprehensive tool for traders looking to manage risk while identifying market trends. By incorporating Cumulative Volume Delta (CVD) to detect buying and selling pressure, volume dynamics to gauge market activity, and ATR to adjust for volatility, this indicator ensures that stop-loss levels are both adaptive and protective.
Whether you’re trading in Forex, Crypto, or Stock markets, the Trailing Stop Loss Smart allows you to capitalize on trends while dynamically adjusting to changing market conditions. Its ability to distinguish between high-volume and low-volume periods ensures that you’re not stopped out prematurely during periods of consolidation or market hesitation.
By providing real-time visual feedback, dynamic adjustments, and trend identification, this indicator serves as a vital tool for traders aiming to maximize profits while minimizing risk. Its versatility and adaptability make it an essential part of any trader’s toolkit, helping you stay ahead in fast-moving markets while safeguarding your positions.
Cari dalam skrip untuk "trend"

Uptrick: Adaptive Trend Strength Index (ATSI)### **Adaptive Trend Strength Index (ATSI): Trend Detection Tool**
---
### Introduction
The **Adaptive Trend Strength Index (ATSI)** is a state-of-the-art indicator designed to offer traders an unparalleled view into market trends. By combining the principles of adaptive trend analysis with advanced volatility filtering, ATSI provides a powerful and visually intuitive method for identifying and following market trends. Its unique algorithm and customizable features make it an essential tool for traders across all markets—whether you're trading stocks, forex, commodities, or cryptocurrencies.
### The Purpose and Design Philosophy
At its core, the ATSI was built with the understanding that financial markets are dynamic, ever-changing entities influenced by a multitude of factors, including market sentiment, economic data, geopolitical events, and, critically, volatility. Traditional trend indicators often fall short by either over-smoothing price data (thus lagging behind the actual trend) or reacting too quickly to minor price fluctuations, resulting in false signals.
**ATSI solves this dilemma by adapting to market conditions in real-time.** It effectively filters out market noise while being sensitive enough to detect meaningful shifts in trend direction. The result is a trend line that is both responsive and smooth, providing traders with a clear, actionable view of the market's current trajectory.
### Key Features and Functionality
#### 1. **Adaptive Trend Calculation**
The heart of ATSI is its adaptive trend algorithm, which adjusts based on market conditions. It leverages a combination of price action analysis and volatility filtering to determine the strength and direction of the trend. Here’s how it works:
- **Volatility Sensitivity:** ATSI incorporates the Average True Range (ATR) to measure market volatility. This volatility measure is then adjusted by a user-defined sensitivity factor. This ensures that the indicator responds dynamically to different market environments—be it high-volatility breakouts or low-volatility consolidations.
- **Adaptive Smoothing:** The trend calculation is further enhanced by an exponential moving average (EMA) applied not just to the raw price data, but also to the resulting trend line itself. This dual-layer smoothing process helps to eliminate noise, resulting in a cleaner and more reliable trend line.
- **Real-Time Adaptation:** Unlike rigid indicators that require constant tweaking to stay relevant in changing market conditions, ATSI adapts in real-time. This adaptability makes it particularly valuable in fast-moving markets where conditions can change rapidly.
#### 2. **Visual Clarity**
In trading, visual clarity can make the difference between spotting a lucrative trend and missing out. ATSI excels in this regard by offering a clear, color-coded trend line that provides instant feedback on market conditions:
- **Thicker and Smoother Line:** ATSI’s trend line is designed to be visually prominent. By default, it is thicker than most standard indicators, making it easy to spot even in dense charts. Additionally, the smoothing applied to the line ensures that it flows smoothly, avoiding the jagged, noisy appearance that can plague other indicators.
- **Color-Coded Trends:** The trend line changes color based on the direction and strength of the trend:
- **Green Line**: Indicates a bullish trend, suggesting upward momentum in the market.
- **Red Line**: Indicates a bearish trend, signaling downward momentum.
- **Gold Line**: Represents a neutral or weak trend, where the market is consolidating or where there is no clear direction.
This color-coding is not just for aesthetics—it’s a critical feature that allows traders to quickly assess market conditions at a glance.
#### 3. **Customizable Parameters**
ATSI is built with the understanding that every trader’s strategy is unique. Whether you’re a day trader looking for short-term trends or a swing trader interested in catching longer moves, ATSI can be tailored to fit your needs:
- **Trend Length:** The length parameter controls how much historical data is considered in the trend calculation. A shorter length will make the indicator more sensitive to recent price changes, while a longer length will smooth out short-term fluctuations, focusing on the broader trend.
- **Smoothing Factor:** This parameter controls the level of smoothing applied to the trend line. A higher smoothing factor will result in a smoother, more stable trend line, while a lower factor will make the line more responsive to quick changes in price.
- **Volatility Sensitivity:** By adjusting the volatility sensitivity, you can control how reactive the indicator is to market volatility. A higher sensitivity makes the indicator more likely to detect trends in volatile markets, while a lower sensitivity helps to filter out noise in calmer markets.
- **Line Width:** ATSI allows you to adjust the thickness of the trend line, ensuring that it stands out on your chart. This is particularly useful when trading on charts with a lot of overlays or when you need a clear, bold line to guide your trading decisions.
- **Color Customization:** The colors for bullish, bearish, and neutral trends can be fully customized to match your personal preferences or to integrate seamlessly with your existing chart setup.
### Practical Applications
ATSI is a versatile indicator that can be applied to a wide range of trading strategies. Here’s how it can enhance your trading:
#### 1. **Trend Following**
For traders who thrive on catching and riding trends, ATSI is a game-changer. Its adaptive nature ensures that you stay in the trend for as long as possible without being shaken out by minor fluctuations. The clear color-coded line makes it easy to identify when a trend starts and ends, providing clear entry and exit signals.
#### 2. **Risk Management**
One of the biggest challenges in trading is managing risk, particularly in volatile markets. ATSI’s volatility sensitivity feature helps traders adjust their strategies based on current market conditions. For example, in a high-volatility environment, the indicator will become more sensitive, allowing you to tighten your stop losses or take profits earlier. Conversely, in a low-volatility market, the indicator will smooth out minor fluctuations, reducing the risk of being stopped out prematurely.
#### 3. **Trend Reversals and Consolidations**
ATSI is also highly effective in identifying trend reversals and periods of consolidation. The neutral (gold) line indicates periods where the market is undecided, which can often precede significant moves. Recognizing these periods can help you avoid getting caught in choppy markets and position yourself for the next big move.
#### 4. **Market Timing**
Timing the market is often seen as the holy grail of trading. While no indicator can predict the future with 100% accuracy, ATSI’s real-time adaptation gives you a significant edge. By responding to changes in market conditions as they happen, ATSI helps you make timely decisions, whether you’re entering a trade, exiting a position, or adjusting your risk parameters.
### Comparative Advantage
What sets ATSI apart from other trend indicators is its combination of adaptability, visual clarity, and ease of use:
- **Adaptability:** Most trend indicators are static—they apply the same calculations regardless of market conditions. ATSI, however, adapts to the market in real-time, ensuring that it remains relevant and reliable across different market environments.
- **Visual Clarity:** The thicker, smoother, color-coded line is not just aesthetically pleasing—it’s a functional design choice that helps you quickly interpret market conditions. Whether you’re glancing at your chart or conducting an in-depth analysis, the ATSI line stands out, providing immediate insight.
- **Ease of Use:** Despite its advanced features, ATSI is incredibly easy to use. The default settings are optimized for general use, but the indicator offers a high degree of customization for those who want to tailor it to their specific trading strategy.
### Conclusion
The **Adaptive Trend Strength Index (ATSI)** is more than just another trend indicator—it’s a comprehensive tool designed to give traders an edge in today’s fast-paced, volatile markets. By combining adaptive trend analysis with advanced volatility filtering, ATSI offers a unique blend of responsiveness and reliability. Its clear, color-coded visual representation of trends makes it easy to use, even for traders who are new to technical analysis, while its customizable parameters provide the flexibility that experienced traders demand.
Whether you’re looking to ride the next big trend, manage your risk more effectively, or simply get a clearer picture of the market’s current direction, ATSI is an invaluable addition to your trading toolkit. With its cutting-edge design and powerful functionality, ATSI is poised to become the go-to indicator for traders seeking to enhance their market analysis and improve their trading outcomes.

Trendlines (long)Hi all!
I hope that this indicator helps you to be a more efficient trader. The concept is well known and useful. So this is not some magic algorithm founded by me, but rather a well known concept. The concept is the drawing of trendlines.
It draws trendlines that has a retest. It draws the trendlines in different colors, the colors used are blue, red, fuchsia and lime.
These are the steps for finding a trendline:
1. Find a generic retest
Find a low that has 2 earlier lows and 1 later low that are higher. This is the reason that a trendline will be created "1 bar late". This is the base and the indicator goes on from here, meaning that this needs to be true to continue.
2. Find an uptrend
Look back 8 bars to find a low that is lower than the retest low.
3. Create the first point of a trendline
Go thru every bar between the user defined "Lookback" and the retest bar (minus the user defined "Skip gap" that's needed between points to create a trendline). From the earliest bar to the latest.
4. Create the second point of the trendline
Go thru every bar between the retest bar and the the first point (bar) minus the "Skip gap". From latest bar to the earliest. A trendline between the two bars are invalidated if some of the criteria are met in-between the bars creating the trendline:
- closed above the trendline (trendline broken)
- is not within the retest bar
- the slope of the trendline is upwards (this indicator is for long entries only)
- at least 1 of the bars creating the retest (1 main bar and 2 earlier bars) has NOT been above the trendline
- is not the created trendline (between the two points) that's closest to the low of the retest bar
TODO:
- add functionality to draw trendlines directly on breakouts
- add volume (high volume needed to create a trendline from a breakout/retest)
- ...?
I hope this explanation makes sense, let me know otherwise. Also let me know if you have any suggestions on improvements.
Best of luck trading!

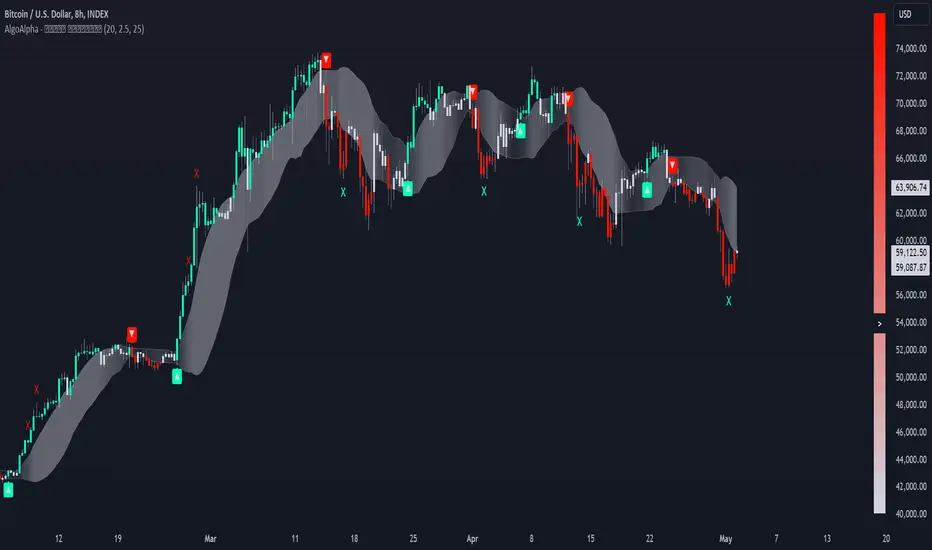
Trend Strength Signals [AlgoAlpha]🌟Introducing the Trend and Strength Signals indicator by AlgoAlpha ! This tool is designed to help you identify trends and gauge market strength with precision and ease. 📈🚀
🛠 Customizable Parameters : Adjust the period, standard deviation multiplier, gauge size, and colors to fit your trading style.
📊 Trend Detection : Visualize trends with clear color-coded signals for uptrends and downtrends.
📈 Strength Gauge : Assess market strength with a dynamic gauge that adapts to the current price action.
🔔 Alerts : Set alerts for bullish and bearish trend crossovers and take profit points to stay ahead of the market.
🎨 Visual Enhancements : Enjoy a clutter-free chart with the integration of plot shapes, color fills, and gradient gauges.
🚀 Quick Guide to Using the Trend and Strength Signals Indicator
Maximize your trading with the Trend and Strength Signals indicator by following these streamlined steps! 🎯✨
🛠 Add the Indicator : Add the indicator to your favorites. Customize settings like period, standard deviation multiplier, and colors to fit your trading style.
📊 Market Analysis : Observe the color-coded candles and gauge to understand market trend direction and strength. Use the alerts for key trading signals.
🔔 Alerts : Enable notifications for trend crossovers and take profit points to catch trading opportunities without constantly monitoring the chart.
⚙️ How it works
This indicator calculates the moving average and standard deviation of the closing price over a customizable period to identify the upper and lower bounds. When the price crosses these bounds, it signals an uptrend or downtrend. The gauge measures market strength by comparing the price to the moving average and scaling it over a customizable range, while the underlying logic uses concepts from the Bollinger Bands, this indicator gives a unique perspective on price behavior through added features and signals derived from it.
Unleash the power of trend and strength analysis with this comprehensive indicator! Happy trading! 🚀📈✨
Trend Channels (MTF) | Flux Charts💎 GENERAL OVERVIEW
Introducing our new Trend Channels (MTF) indicator! Latest trends play an important role for traders and sometimes it can be hard to spot trends in other timeframes. This indicator can plot latest trend channels across different timeframes, so you can spot trends and their channels easier. More info about the process in the "How Does It Work" section.
Features of the new Trend Channels (MTF) indicator :
Plot Trend Channels Across Up To 3 Different Timeframes
Broad Customizability Of Trend Detection
Variety Of Trend Invalidation Options
High Visual Customizability
🚩UNIQUENESS
While the detection of trend channels is a common concept among traders, trend channels across different timeframes can be as crucial as the ones in the current timeframe. This indicator can find them from up to 3 different timeframes. While the general settings will perform well enough most of the time, the indicator also provides fine-tuning options for trend detection and trend invalidation for more experienced traders.
📌 HOW DOES IT WORK ?
Trend channels occur when the price of an asset starts making a strong movement in a bullish or a bearish direction. This indicator detects trend channels using the Simple Moving Average (SMA). When the slope of the SMA line exceeds the user-defined size, a trend channel will occur.
To understand how individual settings work, you can check the "⚙️SETTINGS" section.
⚙️SETTINGS
1. General Configuration
SMA Length -> Determines the length used in the SMA function. Higher values mean that an average of a longer timespan will be taken into account when spotting trends.
Slope Length -> Used while finding the slope of the trend channel. Check this example for slope length :
ATR Size -> This setting is taken into calculation while checking if a trend channel is worth plotting. The higher this setting is, the higher the slope of the trend channel must be to get rendered. You can take a look at the chart provided above for a visual explanation.
Channel Expander -> When a trend channel occurs, the top and the bottom of the channel are initally determined by the latest highest highs / lowest lows. This setting expands the channel vertically by X times Average True Range (ATR). Check this example :
Trend Invalidation -> The trend channel gets invalidated when the bar closes / wicks above the top of the channel, or below the bottom of the channel. With this setting, you can switch the behaviour between bar close / bar wick.
Avoid False Invalidation -> This setting makes it harder for trend channels to get invalidated to prevent false invalidations.
Retries : The trend channel will have 5 chances for invalidation. First 4 invalidations will not invalidate the channel. The trend channel will only invalidate once the 5th invalidation occur.
Volume : The bar that invalidates the trend channel must have a volume higher than 1.5x the average bar volume of the current chart. Otherwise the trend channel will not be invalidated.
None : The trend channel will invalidate at the first invalidation.

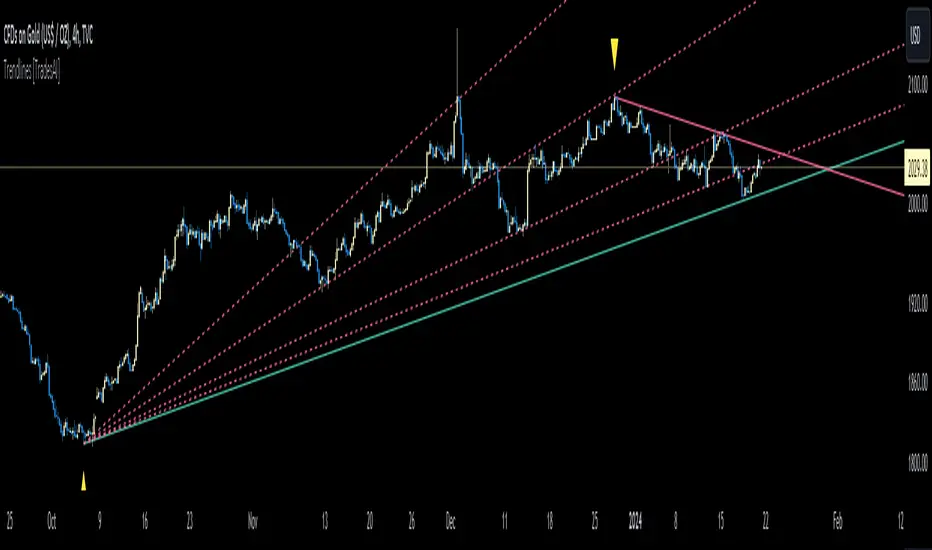
Trendlines [TradesAI]What is it?
This indicator allows the user to pick any Candle (preferably a Pivot, for better results) to draw the most relevant Trendlines from it as Origin, while keeping track of candle closes across these Trendlines to adjust or invalidate accordingly.
It allows for up to 2 Origins to be picked on chart. Remember to pick a Bullish candle to draw Downtrends, and a Bearish candle to draw Uptrends. The algorithm will draw the most suitable Active Trendlines from those Origin points.
How does it do it?
The indicator takes the Origin point as the first point of the Trendline, then starts looking for the immediate next same-type candle (Bullish to Bullish or Bearish to Bearish), to draw the Trendline between the Origin candle and this newer candle.
An Uptrend is a ray connecting two Bearish candles, as long as the second candle has a Low higher than the Low of the Origin (first) candle. A Downtrend is a ray connecting two Bullish candles, as long as the second candle has a High lower than the High of the Origin (first) candle.
Upon drawing, the indicator then starts monitoring and adjusting this Trendline, by keeping the Origin always the same, but changing the second point. The goal is to keep reducing the slope of the Trendline till it is at 0 degrees (horizontal line). That then makes the Trendline "Final".
So, the algorithm has 3 States for the Trendlines:
Initial: not tested, meaning price hasn't yet broken through it and closed a candle beyond it, to cause a re-adjustment of this Trendline.
Broken: candle Hard Closed (its Open and Close) across it but still the direction of the Trend is maintained with a new Trendline from the same Origin – could be replaced (or kept on chart as "Backside", which is what we call a Broken Trendline to be tested from the opposite side) with a new Trendline from the same Origin, to the newest candle that caused the break to happen, as then it becomes the new second point of that trendline.
Final: candle Hard Closed across it and can't draw a new Trendline from the same Origin maintaining the direction of the Trend (so an uptrend becomes a downtrend or a downtrend becomes an uptrend at this point, which is not allowed). This marks the end of Trendline adjustment for that Origin.
To summarize the algorithm, imagine starting from a candle and drawing the trendline, then keep re-adjusting it to make its slope less and less, till it becomes a horizontal line. That's the final state.
Unlike traditional trendline tools, this indicator takes into account numerous rules for each candlestick to determine valid support and resistance levels, which act as Liquidity Zones.
What does it do differently?
Unlike conventional trendline tools, this indicator allows the user to pick the Pivot point as Origin, then automatically recognizes and extends lines from them as Liquidity Zones where a reaction is expected. Moreover, the indicator monitors those trendlines in real-time to switch them from Buying to Selling zones, and vice-versa, as price structure changes.
Features
Log vs. Linear scale switch to show different trendlines accordingly. When updating the Trendlines, or deciding whether Touches/Hard Closes are met, it makes a difference.
Ability to show all forms of Trendlines, Final Trendlines or just Backside Trendlines.
Why is it used?
For experienced traders, it offers the advantage of time-efficiency, while new traders can bypass the steep learning curve of drawing trendlines manually, which could practically be drawn between any two candlesticks on the chart (unlimited variations).
Trend Lines [LuxAlgo]Our new "Trend Lines" indicator detects and highlights relevant trendlines on the user chart while keeping it free of as much clutter as possible.
The indicator is thought for real-time usage and includes several filters as well as the ability to estimate trendline angles.
🔶 USAGE
Trendlines can act as support/resistance, with a higher number of tests indicating a more significant support/resistance role.
A broken TrendLine can be indicative of a potential trend reversal. The script highlights breaks with a label.
Users can additionally filter trendlines, only showing trendlines whose angles fall within a user set range:
This allows for the removal of potential clutter from the chart but also helps keep steeper or more horizontal trendlines.
🔶 DETAILS
When a swing (pivot point) is found, a Trendline is drawn when certain conditions are fulfilled.
An essential condition is that a Bearish Trendline (red) always occurs on a lower high, while a Bullish Trendline (blue) occurs on a higher low.
Our implementation will first show an initial dotted-styled TrendLine on confirmation, after which a solid-styled secondary TrendLine will develop. The latter will be used for the real-time detection of breaks at that line:
Furthermore, the script allows you to add more conditions:
🔹 Length (Swings)
A swing develops when a high/low is the highest/lowest against x highs/lows on the left AND right of that bar. x can be set by "Length" in settings.
The following images clarify this. The script confirms a swing where the yellow flag is shown; the high (here visualized with a purple label) is the highest point against x bars left and right of that point.
At that moment, this swing is checked against the previous swing. If all conditions are fulfilled, an initial TrendLine is drawn on confirmation.
After that point, a secondary thicker solid line is seen which keeps progressing bar after bar, until:
• a new TrendLine is formed
• the TrendLine is broken
🔹 Breaks between Swings
Once there is confirmation that a TrendLine can be drawn, the script allows you to filter for breakthroughs on that line. This can be set with "Check breaks between"
Disabled : the initial TrendLine is allowed to be pierced:
Check breaks between point A - point B : no breaks are allowed between both Swing points:
Point A - Current bar : no breaks are allowed between the first Swing point and the point of confirmation ('current' bar):
🔹 TrendLine breaks
As mentioned, the secondary TrendLine (solid line) progresses bar after bar until a new TrendLine is formed or the TrendLine is broken. When a TrendLine is broken, the TrendLine stops progressing, but if there isn't a new TrendLine and price return back, the TrendLine will re-appear, potentially giving several signals when the TrendLine is broken again.
Minimal bars allow you to regulate the amount of signals when the TrendLine is broken.
-> The secondary TrendLine must be uninterrupted for at least x bars before a potential break can be considered.
The following example shows 1 signal against 3 by adjusting this setting from 2 to 5:
🔹 Angles
Angles should normally be calculated when the units of the X and Y axis are the same. However, on our charts, the unit of the X-axis is bar_index (bars), and on the Y-axis the unit is price (¥, €, £, $,...).
It is not easy to normalize and create reasonably valid angles. Often certain angle calculations can differ through price changes or volatility.
Our calculate_slope() function tries to make corresponding angles through all bars.
We do this by calculating the difference between the highest/lowest price values in a certain bar range. The bar range is our X-axis, and the price difference is our Y-axis.
Zooming in/out will not change the amount of bars or the price. Since it does change our view on the chart, and thereby how we see the angles, we have included a setting where you can personalize the ratio between X and Y-axis (Angles -> Ratio X-Y axis).
Settings: Angles - Ratio X-Y axis:
🔶 SETTINGS
🔹 Swings
Length: Lookback period for the detection of swing points.
🔹 Trendline validation
Check breaks between :
Disabled : the initial TrendLine is allowed to be pierced
Check breaks between point A - point B : no breaks are allowed between both Swing points
Point A - Current bar : no breaks are allowed between the first Swing point and the point of confirmation ('current' bar)
Source (breaks) : Source which invalidates TrendLine, default: close
🔹 TrendLine breaks
Minimal bars : The secondary TrendLine must be uninterrupted for at least x bars before a potential break can be considered.
🔹 Angles
Show : Toggle labels.
Ratio X-Y axis : Every user has his preferences regarding zoom, chart layout,...
If the shown angles are not according to your expectations, you can adjust this number.
Only TrendLine between : Only allow TrendLines between the minimum and maximum degrees. Set only the minimal and maximum values above 0.

Smart Trend EnvelopeThe "Smart Trend Envelope" indicator is a powerful tool that combines the "Nadaraya-Watson Envelope " indicator by LuxAlgo and the "Strongest Trendline" indicator by Julien_Eche.
This indicator provides valuable insights into price trends and projection confidence levels in financial markets. However, it's important to note that the indicator may repaint, meaning that the displayed results can change after the fact.
The "Strongest Trendline" indicator by Julien_Eche focuses on identifying the strongest trendlines using logarithmic transformations of price data. It calculates the slope, average, and intercept of each trendline over user-defined lengths. The indicator also provides standard deviation, Pearson's R correlation coefficient, and upper/lower deviation values to assess the strength and reliability of the trendlines.
In addition, the "Nadaraya-Watson Envelope " indicator developed by LuxAlgo utilizes the Nadaraya-Watson kernel regression technique. It applies a kernel function to smooth the price data and estimate future price movements. The indicator allows adjustment of the bandwidth parameter and multiplier to control the width of the envelope lines around the smoothed line.
Combining these two indicators, the "Smart Trend Envelope" indicator offers traders and investors a comprehensive analysis of price trends and projection confidence levels. It automatically selects the strongest trendline length based on the highest Pearson's R correlation coefficient. Traders can observe the trendlines on the price chart, along with upper and lower envelope lines generated by the Nadaraya-Watson smoothing technique.
The "Smart Trend Envelope" indicator has several qualities that make it a valuable tool for technical analysis:
1. Automatic Length Selection: The indicator dynamically selects the optimal trendline length based on the highest Pearson's R correlation coefficient, ensuring accurate trend analysis.
2. Projection Confidence Level: The indicator provides a projection confidence level ranging from "Ultra Weak" to "Ultra Strong." This allows traders to assess the reliability of the projected trend and make informed trading decisions.
3. Color-Coded Visualization: The indicator uses color schemes, such as teal and red, to highlight the direction of the trend and the corresponding envelope lines. This visual representation makes it easier to interpret the market trends at a glance.
4. Customizable Settings: Traders can adjust parameters such as bandwidth, multiplier, line color, and line width to tailor the indicator to their specific trading strategies and preferences.
The "Smart Trend Envelope" indicator has been specifically designed and coded to be used in logarithmic scale. It takes advantage of the logarithmic scale's ability to represent exponential price movements accurately. Therefore, it is highly recommended to use this indicator with the chart set to logarithmic scale for optimal performance and reliable trend analysis, especially on higher timeframes.
It's important to remember that the "Smart Trend Envelope" indicator may repaint, meaning that the displayed results can change after the fact. Traders should use this indicator as a tool for generating trade ideas and confirmation, rather than relying solely on its historical values. Combining the indicator with other technical analysis tools and considering fundamental factors can lead to more robust trading strategies.

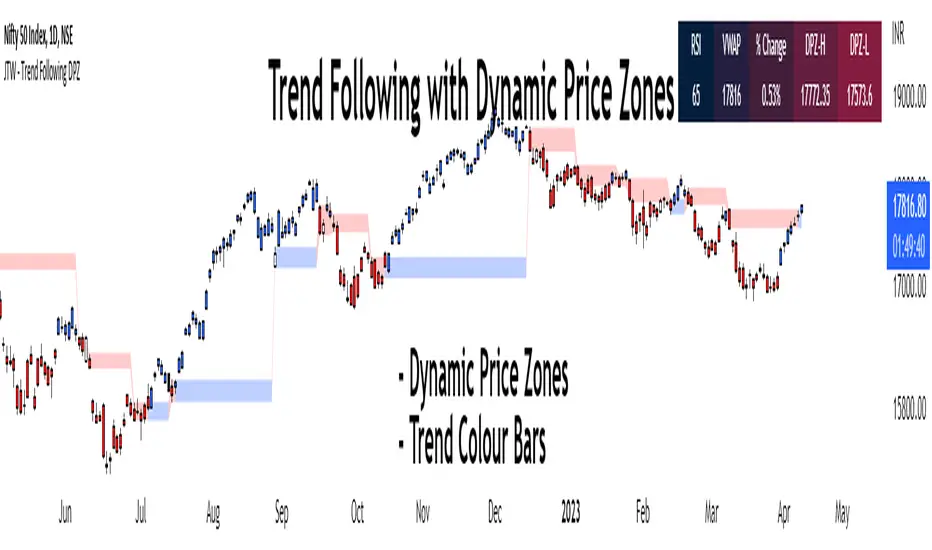
Trend Following with Dynamic Price ZonesThis script provides a complete framework for following trends , especially on those assets which are sufficiently liquid and don't go through random spikes.
Since it is a trend-following system, it works well during trends only. However, I cannot claim any numbers since the execution requires some discretion at the user's end. This framework can also be combined with other technical tools such as trend lines to increase its efficacy.
Features:
Dynamic Price Zones:
• The Dynamic Price Zones (DPZ) are determined using a proprietary logic that incorporates price movement and certain other factors.
• These zones change more rapidly than conventional support and resistance (S/R) zones, which is why I have named them "Dynamic".
• DPZs can serve as support and resistance zones and help with trend identification to some extent.
• The upper boundary of a zone is called Dynamic Price Zone High (DPZ-H) , while the lower boundary is called Dynamic Price Zone Low (DPZ-L) .
Colour Bars:
• Candle colours are based on another proprietary logic, independent of dynamic price zones .
• These are not traditional moving average-based coloured bars, which is evident from the presence of uncoloured bars in between.
• The uncoloured bars indicate periods of uncertain trends .
• Colour functionality helps in smoothening the trend and assists in riding it for as long as possible.
Stats Table:
• RSI
• VWAP
• % Change from the previous day's closing
• Dynamic Price Zone High (DPZ-H) value
• Dynamic Price Zone Low (DPZ-L) value
Settings:
• DPZs are displayed as horizontal lines with background fill by default, but users can toggle lines and background fill on or off.
• Bar colours can be customized according to user preferences.
• The table can be enabled or disabled based on user input.
• The position of the table can be changed based on 4 available options: Top Left, Top Right, Bottom Left, and Bottom Right.
• Users can toggle individual table fields on or off . For example: If the user wants to hide "Vwap" and "%Change" values, he can turn them off. In that case, only 3 fields will be displayed on the table without occupying additional space.
• Background and text colours for each field of the table can be customized based on user preferences.
How to Use the Dynamic Price Zones:
• When the price is above a DPZ, it indicates a bullish trend , suggesting the possibility of higher prices. These zones are termed Bullish DPZs.
• Conversely, if the price is below a DPZ, it signals a bearish trend , with an expectation of lower prices. These zones are termed Bearish DPZs.
• In a trending market, when the price returns to a previous DPZ, it can present a trading opportunity in the direction of the prior trend (e.g., if the market is falling and the price returns to a previous DPZ, it is likely to reject it).
• Consecutive ascending DPZs indicate a shift in buyers from lower to higher levels and can provide buying opportunities. This also indicates a period of a strong bullish trend.
• Similarly, consecutive descending DPZs indicate a shift in sellers from higher to lower levels and can provide selling opportunities. This also indicates a period of a strong bearish trend.
• Please note that we must be flexible when determining the consecutive zones. For example: There may be a few smaller bearish DPZs in between the bullish DPZs but if the area is dominated by the bullish DPZs then we can consider the zones as consecutive. Similar is true for bearish consecutive zones.
• Closely stacked or adjacent zones suggest that prices will likely remain within a range, moving sideways.
• Wider zones act as big hurdles and, the price may struggle to cross them. They may also lead to a sideways movement.
• Zones that remain clean and untested for several sessions are likely to act as strong support or resistance when the price revisits them.
Bullish Examples:
Bearish Examples:
Some Examples of the Complete System
Trend follower system combined with Trendlines
Special Thanks
I would like to extend my special thanks to all the experts whose lectures and blogs I have studied to gain a limited yet significant knowledge of the Pine language.
Best regards,
Rajat Kumar Singh (@johntradingwick)
Community Manager (India), TradingView.
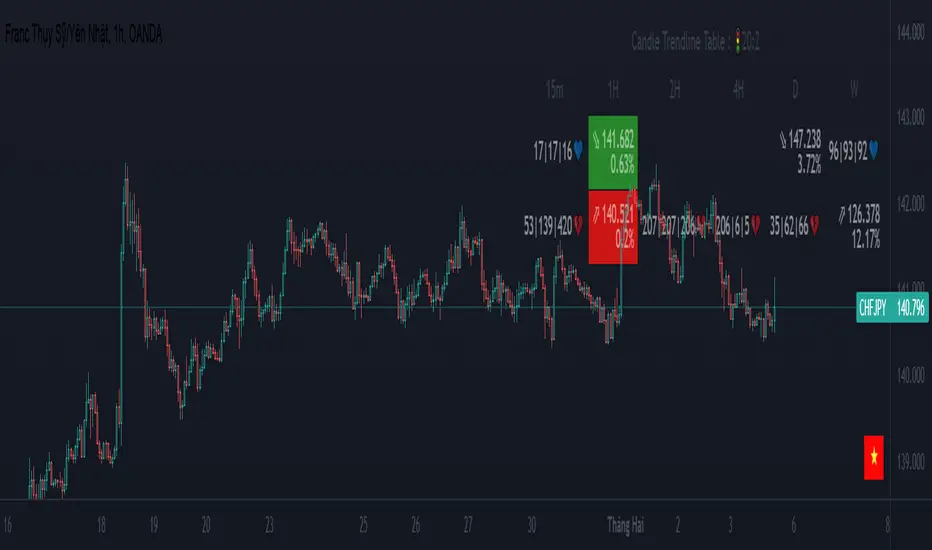
MTF Trendlines_Pro[vn]-This is an indicator for trendline traders
-it statistics the upper and lower trend lines of the Multi Time Frame.
-Pine Script strategy draws pivot points and trendlines on the chart.
-This strategy allows the user to specify the interval to calculate the pivot points and the number of pivot points used to generate the trend lines.
-I use the "Trendlines_Pro " indicator to interpret the indicator "MTF trendlines_Pro " indicator for everyone to understand
-time frames are selected in settings like 1m,3m,15m,1h,2h,4h,6h,12h,1D.1W.1Month..
-If the price is in a wedge pattern, it is represented by the upper and lower parameters, the upper parameter is the resistance point of the upper trendline,the lower parameter is the support point of the below trendline
-when the price distance is <=1% from the trendline, the upper or lower parameter is colored blue (above) or red (below).
-when only the parameter is accompanied by the ⇗ or ⇘. symbol, it tells us that the price has not broken the corresponding trend line
-when showing green heart and % break .indicates that the price has broken the downtrend line to become an uptrend.
On the contrary, the red heart % breaks, it signals us to break the uptrend line to become a downtrend
-when showing parameters 12(1)|18(2)|20(3) and green heart, then :(3) shows that the price has broken out before 20 candles, (2) shows that there are 18 candles to close above The breakout point, (1) represents the last 12 candles that closed above the breakout point and as if a nice uptrend has occurred because 98% of the candles have closed above the breakout point....the opposite of The red heart is the price that broke below the trendline below.
-"MTF trendlines_Pro "indicator is integrated for both the trendline of the price line and the RSI. You can change it in the settings as shown below.
----------------------------------------------------------------------------
vietnamese
-Đây là chỉ báo dành cho các trader thuộc trường phái phân tích đường xu hướng
-nó thống kê các đường xu hướng trên và dưới của Multi Time Frame.
-Chiến lược Pine Script vẽ các điểm trục và đường xu hướng trên biểu đồ.
-Chiến lược này cho phép người dùng chỉ định khoảng thời gian tính toán các điểm xoay và số điểm xoay được sử dụng để tạo các đường xu hướng .
-tôi có dùng chỉ báo trendline_pro dùng để diễn giải chỉ báo MTF trendlines_pro cho mọi người dễ hiểu
-các khung thời gian được lựa chọn trong cài đặt như 1m,3m,15m,1h,2h,4h,6h,12h,....
-Nếu giá đang trong mô hình cái nêm thì được thể hiện bằng tham số trên và tham số dưới, tham số trên là điểm kháng cự của đường xu hướng bên trên,tham số dưới là điểm hỗ trợ của đường xu hướng bên dưới
-khi giá cách đường xu hướng <=1% thì tham số trên hoặc dưới được tô màu xanh (trên) hoặc đỏ(dưới)
-khi chỉ có tham số kèm theo biểu tượng ⇗ or ⇘.thì cho ta biết là giá chưa phá vỡ được đường xu hướng tương ứng
-khi hiện trái tim xanh và % phá vỡ .báo hiệu cho ta biết giá đã phá vỡ đường xu hướng giảm trở thành xu hướng tăng.
ngược lại trái tim đỏ % phá vỡ thì báo hiệu cho ta phá vỡ đường xu hướng tăng trở thành xu hướng giảm
-khi hiện thông số 12(1)|18(2)|20(3) và trái tim xanh thì :(3) thể hiện giá đã phá vỡ trước đó 20 nến,(2) thể hiện có 18 cây nến đóng cửa trên điểm phá vỡ,(1) thể hiện có 12 nến gần nhất đóng cửa trên điểm phá vỡ và như vạy xu hướng tăng đẹp đã xảy ra vì chiếm đến 98% nến đã đóng cửa trên điểm phá vỡ....ngược lại với trái tim đỏ là giá đã đột phá xuống dưới đường xu hướng bên dưới
-chỉ báo MTF trendlines_pro được tích hợp chung cho cả trendline của đường giá và RSI .các bạn có thể thay đổi trong phần cài đặt như hình bên dưới.

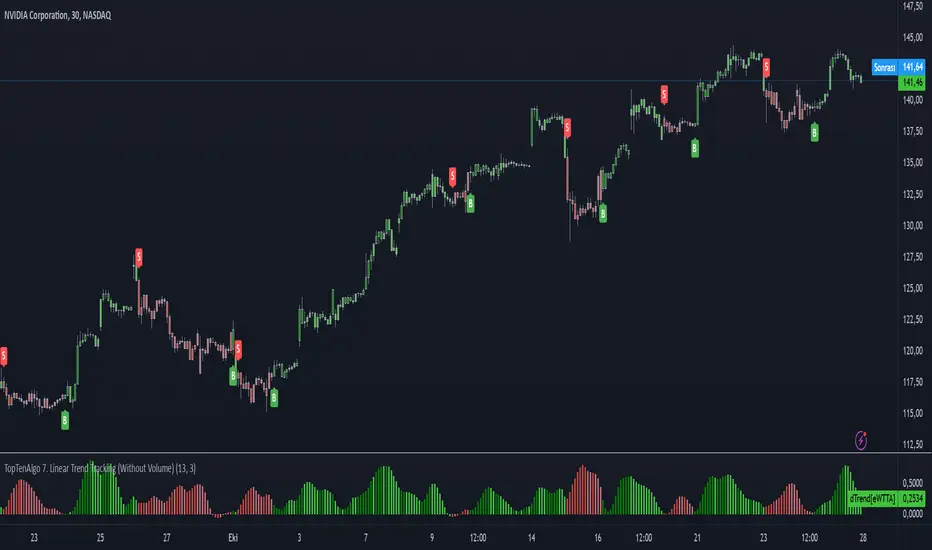
TopTenAlgo 7. Linear Trend Tracking (Without Volume & Coloring)EN:
Dogrusal Trend Takipcisi is used in conjunction with Gosterge Trend. Both indicators are for approval of each other. While the Indicator looks at Logarithmic to prices, It looks at Linear. Although its mathematical function is stuck between two trend lines like Gösterge Trend, the Dogrusal Trend Takipcisi can also be used as the main histogram, the absolute value of the difference between the trend and the down trend line .
If the uptrend line is larger than the downtrend, histogram bars are light green or dark green areas. When the bullish trend line now crosses the down trend line , the bar is dark green. When the up trend line is larger than the down trend line and the up trend line increases, the bars also become dark green. This tendency starts to keep getting stronger. If the bullish trend line is larger than the bearish trend line but decreases, the bars are light green. This is when the bullish trend loses strength, So, Uptrend is weakening.
If the downtrend line is larger than the bullish trend line , a negative occur, and the bars become red or light red. If the bearish trend line has exceeded the bullish trend line or the value is increasing, the bar is in red. If the bearish trend line is larger than the bullish trend line but the value is decreasing, the bars are light red. This comes when the downward trend is losing power. So, Downtrend is weakening. For symbols for which the Volume Indicator cannot be read.
This algorithm is prepared with @Top10Algo ...
TR: Doğrusal Trend Takipçisi Gösterge Trendle ile beraber kullanılır. Her iki göstergede birbirinin onayını almak içindir. Gösterge Trend fiyatlara logaritmik bakarken, Doğrusal Tren Takipçisi Linear bakar. Matematiksel fonsiyonu Gösterge Trend gibi iki trend çizgisi arasına sıkışmış olsada Doğrusal Trend Takipçisi ayrıca ana histogram olarak gösterilen yukarı trend ve aşağı trend çizgisi arasındaki farkın mutlak değerini linear olarak hesaplayarak momentumun gücünü ölçer ve size zayıflayan trendleri haber eder.gösterir.
Yukarı trend çizgisi aşağı trendden büyükse (bu nedenle pozitif hareketi gösterir), histogram çubukları açık yeşil veya koyu yeşil olacaktır. Artış trendi çizgisi şimdi aşağı trend çizgisini geçtiğinde, çubuk koyu yeşil olacaktır. Yukarı trend çizgisi aşağı trend çizgisinden daha büyük olduğunda ve yukarı trend çizgisi arttığında çubuklar da koyu yeşil olur. Bu eğilimin güçlenmeye devam ettiği anlamına geliyor. Yükseliş trendi çizgisi düşüş trendi çizgisinden büyükse ancak azalıyorsa, çubuklar açık yeşil olacaktır. Bu yükseliş eğiliminin güç kaybettiği anlamına gelir.Yani yükseliş trendi zayıflıyordur.
Düşüş trendi çizgisi yükseliş trendi çizgisinden büyükse, olumsuz bir eğilim oluşur ve çubuklar kırmızı veya açık kırmızı olur. Düşüş trendi çizgisi yükseliş trendi çizgisini aştıysa veya değer artıyorsa, çubuk kırmızı olacaktır. Düşüş trendi çizgisi yükseliş trendi çizgisinden büyükse, ancak değer azalıyorsa, çubuklar açık kırmızı olacaktır. Bu düşüş eğiliminin güç kaybettiği anlamına gelir. Yani düşüş trendi zayıflıyordur. Hacim Göstergesinin okunamadığı semboller içindir.
Bu algoritma @Top10Algo ile beraber hazırlanmıştır...
TopTenAlgo 7. Linear Trend Tracking (Include Volume & Coloring)EN:
Dogrusal Trend Takipcisi is used in conjunction with Gosterge Trend. Both indicators are for approval of each other. While the Indicator looks at Logarithmic to prices, It looks at Linear. Although its mathematical function is stuck between two trend lines like Gösterge Trend, the Dogrusal Trend Takipcisi can also be used as the main histogram, the absolute value of the difference between the trend and the down trend line .
If the uptrend line is larger than the downtrend, histogram bars are light green or dark green areas. When the bullish trend line now crosses the down trend line , the bar is dark green. When the up trend line is larger than the down trend line and the up trend line increases, the bars also become dark green. This tendency starts to keep getting stronger. If the bullish trend line is larger than the bearish trend line but decreases, the bars are light green. This is when the bullish trend loses strength, So, Uptrend is weakening.
If the downtrend line is larger than the bullish trend line , a negative occur, and the bars become red or light red. If the bearish trend line has exceeded the bullish trend line or the value is increasing, the bar is in red. If the bearish trend line is larger than the bullish trend line but the value is decreasing, the bars are light red. This comes when the downward trend is losing power. So, Downtrend is weakening.
This algorithm is prepared with @Top10Algo ...
TR: Doğrusal Trend Takipçisi Gösterge Trendle ile beraber kullanılır. Her iki göstergede birbirinin onayını almak içindir. Gösterge Trend fiyatlara logaritmik bakarken, Doğrusal Tren Takipçisi Linear bakar. Matematiksel fonsiyonu Gösterge Trend gibi iki trend çizgisi arasına sıkışmış olsada Doğrusal Trend Takipçisi ayrıca ana histogram olarak gösterilen yukarı trend ve aşağı trend çizgisi arasındaki farkın mutlak değerini linear olarak hesaplayarak momentumun gücünü ölçer ve size zayıflayan trendleri haber eder.gösterir.
Yukarı trend çizgisi aşağı trendden büyükse (bu nedenle pozitif hareketi gösterir), histogram çubukları açık yeşil veya koyu yeşil olacaktır. Artış trendi çizgisi şimdi aşağı trend çizgisini geçtiğinde, çubuk koyu yeşil olacaktır. Yukarı trend çizgisi aşağı trend çizgisinden daha büyük olduğunda ve yukarı trend çizgisi arttığında çubuklar da koyu yeşil olur. Bu eğilimin güçlenmeye devam ettiği anlamına geliyor. Yükseliş trendi çizgisi düşüş trendi çizgisinden büyükse ancak azalıyorsa, çubuklar açık yeşil olacaktır. Bu yükseliş eğiliminin güç kaybettiği anlamına gelir.Yani yükseliş trendi zayıflıyordur.
Düşüş trendi çizgisi yükseliş trendi çizgisinden büyükse, olumsuz bir eğilim oluşur ve çubuklar kırmızı veya açık kırmızı olur. Düşüş trendi çizgisi yükseliş trendi çizgisini aştıysa veya değer artıyorsa, çubuk kırmızı olacaktır. Düşüş trendi çizgisi yükseliş trendi çizgisinden büyükse, ancak değer azalıyorsa, çubuklar açık kırmızı olacaktır. Bu düşüş eğiliminin güç kaybettiği anlamına gelir. Yani düşüş trendi zayıflıyordur.
Bu algoritma @Top10Algo ile beraber hazırlanmıştır...

Xtreme TrendDisclaimer: This base Script is derived and tweaked from Half Trend. But unlike halftrend, it doesn't repaint and signals come at different logic.
Background:
I was using this script and trading with this for a while. Few weeks back I had come across a similar Script being sold as premium in Tradingview for $100 per month. The seller has a lots of videos in youtube and claims that he has created this script by investing lakhs and it also takes consideration of price action !!! . No doubt he is a successful trader but if you watch his other videos you will realize that he trades with S/R, trendlines and price action. He speaks quite well, and the morphed videos give impressions that all his profits are from using this indicator. I fell for it, but then after using for a few days I had realized that both the indicators are almost same, but giving signals at different time. When I edited my indicator for a few settings, it appeared that now signals are also coming exactly at same point. I never wanted to publish this script, but this person was going on and on fooling people. So, I have decided to publish it here, as a protected code. Again this is no holy grail. Works well in trending market and hell in sideways.
How to Use:
PLEASE WAIT TILL CANDLE CLOSE, take entry in the beginning of next candle. Time frame: 5 mins for index, 15 mins - 30 mins for stocks
Add 200 EMA over it ( Personally I love using 50 MA) and buy when signal and price both are on same side. Example, buy when there is buy signal + price is above 200 EMA
Sell: When price is below 200 EMA and there is a sell signal on the indicator.
Seems better when you mix it with pivots, S/R etc.
please comment, if you find this useful.
Trend Analysis IndicatorThe Trend Analysis Indicator was created by Adam White (Stocks & Commodities V. 10:8 (358-360)) and this is not to be confused with the Trend Analysis Index which was also created by Adam White. The stock is trending when it is above the signal and loses steam when it falls below the signal. Generally you should buy when it is above it's signal and sell when it goes below the signal.
Let me know if you would like me to write more scripts!

Trend Following MAs 3DHello All,
This is Moving Averages Trend Following 3D indicator. The idea is based on direction of MAs and relation between 20 moving averages (5 to 100 period).
Option to show different type of MAs: EMA, SMA, RMA, WMA, VWMA.
As I haved tested it looks succesful at calculating trend direction and trend strength.
For a better look I tried to make it 3D, it looks good I think, waiting comments ;)
Some screenshots:
By using RMA type:
When it gets tiny it means there is no trend:
An example for down trend:
ENJOY!

Adaptive Trend (Expo)Adaptive Trend (Expo)
DESCRIPTION
This Adaptive Trend (Expo) indicator is used to detect trends as well as to adapt to the trend characteristic in order to filter-out trend noise. Having an indicator like this enables professional traders to stay longer in trends. The indicator is also equipped with upper- and lower boundaries as well as a mid-line.
Positive trend
If the two trendlines (positive & negative trendline) emerges into one single line, it’s regarded as a positive trend. If a green cloud is painted in the indicator it’s a sign that the indicator is categorizing that price move as noise, and thus the professional trader should keep their long position, or enter Long.
Negative trend
If the two trendlines (positive & negative trendline) separates and become two lines as well as a red cloud is painted in the indicator, this is regarded as a negative trend.
As a general rule, if the ‘positive & negative trendline’ is above the midline there is a positive trend. If the ‘positive & negative trendline’ is below the midline there is a negative trend.
You have the possibility to change the ‘trendvalue’, a shorter length is more sensitive than a longer length.
HOW TO USE
1. Use the indicator to identify trends.
2. Use the indicator as a trend following strategy.
INDICATOR IN ACTION
EURUSD
EURUSD
EURUSD
BTCUSD
The indicator works with RENKO, HEIKIN ASHI and with KAGI charts as well.
I hope you find this indicator useful, and please comment or contact me if you like the script or have any questions/suggestions for future improvements. Thanks!
I will continue to work on this indicator, so please share your experience and feedback with me so that I can continuously improve it. Thanks to everyone that have contacted me regarding my scripts. Your feedback is valuable for future developments!
ACCESS THE INDICATOR
• Contact me on TradingView or use the links below
-----------------
Disclaimer
Copyright by Zeiierman.
The information contained in my scripts/indicators/ideas does not constitute financial advice or a solicitation to buy or sell any securities of any type. I will not accept liability for any loss or damage, including without limitation any loss of profit, which may arise directly or indirectly from use of or reliance on such information.
All investments involve risk, and the past performance of a security, industry, sector, market, financial product, trading strategy, or individual’s trading does not guarantee future results or returns. Investors are fully responsible for any investment decisions they make. Such decisions should be based solely on an evaluation of their financial circumstances, investment objectives, risk tolerance, and liquidity needs.
My scripts/indicators/ideas are only for educational purposes!

Simply Trendy RasterChartThis is my "Simply Trendy RasterChart" using PSv4.0 freely available to ALL! Simply Trendy, shown with the multiple color schemes on the bottom portion of the chart, is an indicator that differentiates with color between trending moments up and down, but is also effective at identifying trend reversals clearly. The bottom of the indicator is most reactive and indicates reversals, while the upper portion of the indicator commonly shows enduring trends. I included a horizontal rule to approximately gauge at what level you may wish to have before entering/exiting a trade upon identifying a trend change. This gizmo functions on all assets on time frames ranging from one second bars up to the "All" chart having monthly bars. Possible uses are quickly identifying assets that are not only opportunistic towards buying, but also selling/shorting when that time arrives later.
I decided to release this freely so members can become familiar with how my RasterCharts function. However, it may serve as another tool in the trend analysis tool belt you may want to have. It's the most basic of RasterCharts that I may have, and it gives the user an opportunity to witness/grasp RasterChart fundamental theory and operation in real time. Underneath the hood, the code is truly VERY SIMPLE also, hence the entitled name given. This was originally an experiment that turned out to be impressive, exceeding my expectations of attempting it. It's behavior is similarly close to my "TrendSetter RasterChart" and may serve as a trainer before acquiring that, any other RasterCharts I have currently, or shall create in the future. With that said, I hope you find this "simply" handy , and I'm also wishful for it to potentially garner a "trendy" reputation among the many members who may discover it.
I provided multiple color schemes for those of you who may have color blindness vision impairments. You may contact me in private if these color schemes are not suitable for your diagnosed visual impairment, and you would wish to contribute to seeing the color schemes improved along with other future indicators I shall release.
Features List Includes:
"Color Scheme" selection (all displayed above)
"RasterChart Transparency" control
"Source" selection
"Horizontal Rule" adjustment
The comments section below is solely just for commenting and other remarks, ideas, compliments, etc... regarding only this indicator, not others. When available time provides itself, I will consider your inquiries, thoughts, and concepts presented below in the comments section if you do have any questions or comments regarding this indicator. When my indicators achieve more prevalent use by TV members, I may implement more ideas when they present themselves as worthy additions. As always, "Like" it if you simply just like it with a proper thumbs up, and also return to my scripts list occasionally for additional postings. Have a profitable future everyone!
Gleeson Trend Tracker (GTT) IndicatorComprehensive Trend Trading System Indicator made up of the four components to help you successfully trade market trends:
Entry Signals (Green & Red Arrows)
The entry arrows indicate entry conditions are present. Green for long entries and red for short entries. If you already in position in the direction of an entry signal, ignore it. Switch to position maintenance mode for that market once trading a market.
Current Trend Status Channels (Red/Green Overlay)
The channel overlay is intended to indicate whether the market has recently trended up/down. Green if moving higher, Red if moving Lower. Channels make it easier to visualise current & previous price trajectory.
On Close Stop Loss (OCSL) / Price Average (40 MA) Blue line
This acts both as the "line in the sand" in relation to trend direction but also importantly as your (OCSL) or sometimes also known as mental stop. If price closes beyond this line in the opposite direction to your position, exit the position. It's important to wait for price to close (this methodology works best on weekly charts so make entry & exit decisions when the market is closed). This method works best if you risk 1% per trade using the distance from entry price to the OCSL as your pre-defined risk, back-analysis confirms this.
Hard Stop Loss Red line
This line is your circuit breaker intended to protect your capital from sudden adverse moves. This line serves as the price for your fixed or hard stop loss point that should be entered with the order. The formula behind this line is risk * 2 (so 2% if you risk 1% between entry price and OCSL). HSL is your safety net, always use it.
Some other advice on how to trade this methodology:
Analysis Sunday, entries & exits Monday (so you can also have a life)
Do not pyramid with this system, it works best with individual entries spread across a range of markets including FX, Indices, Commodities and Interest Rates.
Risk only 1% per trade
This methodology works best over weekly/monthly charts. You want to capture moves that last weeks/months/years. I would not advise day trading this system.
If you have any feedback or need further help, email me at me@jackgleeson.co.uk
Good Luck!

Scaling_mastery:Free TrendlinesScaling_mastery Trendlines is a clean, trading-ready smart trendline tool built for the Scaling_mastery community.
It automatically finds swing highs/lows and draws dynamic trendlines or channels that stay locked to price, on any symbol and any timeframe.
🔧 Modes
Trendline type
Wicks – classic trendlines anchored on candle wicks (high/low).
Bodies – trendlines anchored on candle bodies (open/close), great for closing structure.
Channel – 3-line channel:
outer lines form a band around price
middle line runs through the centre of the channel
thickness is adjustable (Small / Medium / Large).
Trend strength
Controls how strong the pivots must be to form a line.
Weak → more lines, reacts faster.
Medium → balanced, good for most pairs.
Strong → only the cleanest swings, higher-probability trendlines.
🎨 Visual controls
Max support / resistance lines – cap how many lines are kept on chart.
Show broken lines – hide broken trendlines or keep them for structure history.
Extend lines – None / Right / Both.
Support / Resistance colors – separate colors for active vs broken.
Channel thickness – Small / Medium / Large (0.5% / 1% / 2% of price).
Channel outer lines – color for channel edges.
Channel middle line – color + style (dotted / dashed / solid).
Broken lines are automatically faded + dotted, so you can instantly see what’s still respected and what’s already been taken out.
🧠 How to use
Add the indicator to any chart.
Start with:
Trendline type: Wicks
Trend strength: Strong
Max lines: 1–2 for both support & resistance
Once you like the behavior, experiment with:
Switching between Wicks / Bodies / Channel
Adjusting Channel thickness and Trend strength
Use the lines as a visual confluence tool with your own strategy:
HTF trend direction
LTF entries / retests
Liquidity grabs around broken lines
This script doesn’t generate entries or risk management – it’s designed to give you clean, reliable structure so you can execute your own edge.
⚠️ Disclaimer
This tool is for educational and visual purposes only and is not financial advice.
Always do your own research and manage risk.

Kalman Trend Sniper# KALMAN TREND SNIPER
## ORIGINALITY STATEMENT
The Kalman Trend Sniper combines adaptive trend detection with precision entry validation to identify high-probability trading opportunities. Unlike static moving averages that use fixed parameters, this indicator adapts to changing market volatility through ATR-based gain adjustment and distinguishes trending from ranging markets using ADX regime detection.
The indicator's unique contribution is its three-phase entry validation system: signals must hold for three bars, undergo a pullback test to the signal level, and receive confirmation through price action before generating an entry. This structured approach helps traders enter established trends at favorable retracement levels rather than chasing momentum.
---
## TECHNICAL METHODOLOGY
### Kalman Filter Implementation
This indicator implements an Alpha-Beta variant of the Kalman filter, a recursive algorithm that estimates trend from noisy price data:
1. Prediction: kf = kf + velocity
2. Error calculation: error = price - kf
3. Correction: kf = kf + gain * error
4. Velocity update: velocity = velocity + (gain * error) / 2
The gain parameter determines filter responsiveness. Higher gain values track price more closely but increase noise sensitivity, while lower values provide smoother output but lag price changes.
### Adaptive Gain Mechanism
The indicator adjusts gain dynamically based on volatility:
Volatility Factor = Current ATR / Long-term ATR
Adaptive Gain = Base Gain * (0.7 + 0.6 * Volatility Factor)
This ATR ratio increases responsiveness during high-volatility periods and reduces sensitivity during consolidations, addressing the fixed-parameter limitation of traditional moving averages. The volatility factor is bounded between configurable minimum and maximum values to prevent extreme adjustments.
### Regime Detection
The indicator uses the Average Directional Index (ADX) to distinguish market conditions:
- Trending markets (ADX above threshold): Full gain applied, signals generated
- Ranging markets (ADX below threshold): Gain reduced 25%, fewer signals
This regime awareness helps reduce whipsaw signals during sideways consolidation periods.
### Signal Line Validation System
When the Kalman line changes direction in trending conditions, the indicator draws a horizontal signal line at the low (for long signals) or high (for short signals) of the signal candle. This line represents a potential support or resistance level.
The validation system then monitors three phases:
Phase 1 - Hold Period: Price must remain above (long) or below (short) the signal line for three consecutive bars. This requirement filters weak signals where price immediately violates the signal level.
Phase 2 - Test: After the hold period, the system waits for price to pull back and touch the signal line, with configurable tolerance for volatile instruments.
Phase 3 - Confirmation: Within eight bars of the test, a confirmation candle must close above (long) or below (short) the test candle's body, demonstrating renewed momentum. If confirmation does not occur within eight bars, the validation attempt expires.
Successful validation generates an R label at the entry point. This three-phase structure helps identify entries where trend direction and support/resistance validation align.
---
## USAGE INSTRUCTIONS
### Signal Interpretation
Triangle Signals:
- Upward triangle (teal): Kalman line turns bullish in trending market (ADX above threshold)
- Downward triangle (red): Kalman line turns bearish in trending market
Signal Lines (horizontal):
- Teal line: Potential long support level at signal candle low
- Red line: Potential short resistance level at signal candle high
- Gray line: First opposite-color candle after signal (initial reversal pressure)
R Labels (optional, disabled by default):
- Green R below price: Validation complete for long entry
- Red R above price: Validation complete for short entry
Stop Levels:
- Red dots: Long stop level (Kalman line minus ATR multiplier)
- Teal dots: Short stop level (Kalman line plus ATR multiplier)
### Dashboard Information
The dashboard displays real-time indicator state:
- Trend: Current Kalman direction (BULL/BEAR)
- Regime: Market classification (Trending when ADX exceeds threshold, Ranging otherwise)
- Gain: Current adaptive gain value
- Vol Factor: Volatility ratio (current ATR / long-term ATR)
- ADX: Trend strength (higher values indicate stronger trends)
- Z-Score: Standard deviation distance from Kalman line (when enabled)
- Stop Dist: Current ATR-based stop distance
- Lines: Number of active signal lines displayed
- R-Status: Validation system state (Idle / Waiting / Testing)
### Trading Applications
Trend Following Approach:
1. Wait for triangle signal in trending market (ADX above threshold)
2. Enter immediately at signal candle close or wait for pullback
3. Place stop at displayed stop level
4. Trail stop using Kalman line as dynamic support/resistance
Validation Entry Approach (conservative):
1. After triangle signal, observe three-bar hold period
2. Wait for pullback to signal line (test phase)
3. Enter on R label confirmation
4. Place stop below/above signal line
5. Provides higher probability entries but reduces trade frequency
Z-Score Mean Reversion (when enabled):
1. Watch for Z-Score exceeding entry threshold (default +/-2.0)
2. Consider counter-trend entries when price touches Kalman line
3. Target return to Kalman line (Z-Score near zero)
4. Use Z-Score threshold as stop level for extreme continuation
### Optimal Conditions
The indicator performs optimally in clearly trending markets where ADX consistently exceeds the threshold. Performance degrades in sideways, choppy conditions.
Recommended timeframes:
- 1-5 minute charts: Use Crypto_1M preset (faster adaptation)
- 15-60 minute charts: Use Crypto_15M preset (balanced)
- Hourly charts: Use Forex preset (smoother)
- Daily charts: Use Stocks_Daily preset (long-term trends)
Market conditions:
- High volatility (Vol Factor above 1.5): Expect faster adaptation, wider stops needed
- Normal volatility (Vol Factor 0.7-1.5): Standard behavior
- Low volatility (Vol Factor below 0.7): Expect slower adaptation, tighter stops possible
---
## PARAMETER DOCUMENTATION
### Kalman Filter Settings
Preset Mode: Select optimized configuration for specific markets
- Custom: Manual parameter control
- Crypto_1M: Base Gain 0.05, ATR 7 (fast response for 1-5 minute crypto charts)
- Crypto_15M: Base Gain 0.03, ATR 14 (balanced for 15-60 minute crypto charts)
- Forex: Base Gain 0.02, ATR 14 (standard for forex pairs)
- Stocks_Daily: Base Gain 0.01, ATR 20 (smooth for daily stock charts)
Base Gain (0.001-0.2): Core Kalman filter responsiveness parameter. Higher values increase sensitivity to price changes. Low values (0.01-0.02) provide smooth output with fewer whipsaws but slower trend changes. High values (0.06-0.08) offer fast response with more signals but increased whipsaw risk.
Adaptive (checkbox): When enabled, automatically adjusts gain based on ATR ratio. Recommended to keep enabled for dynamic volatility adaptation.
ATR (5-50): Short-term Average True Range period for current volatility measurement. Default 14 is industry standard. Lower values respond faster to volatility changes.
Long ATR (20-200): Long-term ATR period for baseline volatility comparison. Default 50 provides stable reference. The ratio between ATR and Long ATR determines adaptive adjustment magnitude.
Regime Filter (checkbox): Enables ADX-based trending/ranging detection. When enabled, reduces gain by 25 percent during ranging markets to minimize false signals.
ADX Period (7-30): Period for ADX calculation. Default 14 is standard. Lower values respond faster to trend strength changes.
Threshold (15-40): ADX level distinguishing trending from ranging markets. Default 25. Above threshold: trending (generate signals normally). Below threshold: ranging (reduce sensitivity).
Min Vol / Max Vol (0.3-3.0): Bounds for volatility factor adjustment. Prevents extreme gain changes during unusual volatility spikes or quiet periods. Default minimum 0.5, maximum 2.0.
Stop ATR x (1.0-3.0): Multiplier for ATR-based stop loss distance. Default 2.0 places stops two ATRs from Kalman line. Use 1.5 for tight stops (intraday), 2.5-3.0 for wide stops (swing trading).
Show Signals (checkbox): Displays triangle signals when Kalman changes direction in trending markets. Disable to use indicator purely as dynamic support/resistance without signals.
Z-Score (checkbox): Enables mean-reversion signal generation based on statistical deviation from Kalman line.
Period (10-100): Lookback period for Z-Score standard deviation calculation. Default 20 bars. Longer periods produce smoother, less sensitive readings.
Entry (1.5-3.5): Standard deviation threshold for Z-Score signals. Default 2.0 generates signals at plus/minus two standard deviations (approximately 95th percentile moves).
Bull / Bear Colors: Customize Kalman line colors for uptrend (default teal) and downtrend (default red).
Fill (checkbox): Shows semi-transparent fill between price and Kalman line for visual trend emphasis.
### Signal Line System Settings
Signal Lines (checkbox): Displays horizontal signal lines at low (long) or high (short) of signal candles. These function as dynamic support/resistance levels.
Reverse Lines (checkbox): Shows gray horizontal lines at first opposite-colored candle after signal. Helps identify initial resistance points in new trends.
Max Lines (0-20): Maximum number of signal lines to display simultaneously. Older lines are removed as new signals appear. Use 1-2 for clean charts, 3-5 for recent support/resistance history.
Style (Solid/Dotted/Dashed): Visual style for signal and reverse lines. Dotted provides subtle appearance, solid is most prominent.
Line % / Label % (0-100): Transparency percentage for lines and labels. Zero is fully opaque, 100 is invisible.
R Labels (checkbox): Shows R labels when validation confirmation occurs. Default disabled. Enable if you want visual confirmation of successful pullback entries.
Tolerance % (0-1.0): Price deviation tolerance for test candle detection. Zero requires exact touch. 0.5 allows 0.5 percent deviation for volatile instruments.
### Dashboard Settings
Show Dashboard (checkbox): Toggles visibility of information panel. Disable for clean chart presentation.
Position: Choose dashboard location from nine positions (Top/Middle/Bottom combined with Left/Center/Right).
---
## LIMITATIONS AND WARNINGS
This indicator is a technical analysis tool that processes historical price data. It does not predict future price movements.
Inherent limitations:
1. Lagging nature: Like all trend indicators, the Kalman filter lags price. Signals occur after trend changes begin, not before.
2. Ranging markets: Generates fewer signals and reduced performance when ADX falls below threshold. Not optimized for sideways consolidation.
3. Whipsaw risk: In choppy, indecisive markets near ADX threshold, signals may reverse quickly despite regime filtering.
4. Parameter sensitivity: Inappropriate Base Gain settings can cause over-trading (too high) or missed trends (too low).
5. Validation requirement: The three-phase confirmation system provides higher accuracy but significantly reduces trade frequency. Not all trends produce valid pullback entries.
Not suitable for:
- Scalping strategies requiring instant signals (Kalman filter has intentional smoothing)
- Ultra-high frequency trading (indicator updates once per bar close)
- Markets with extreme overnight gaps (stops may be exceeded)
- Strategies requiring signals on Heikin Ashi, Renko, Kagi, Point and Figure, or Range charts
Risk management requirements:
This indicator provides trend direction and signal levels but does not incorporate position sizing, risk management, or account balance considerations. Users must implement appropriate position sizing, maximum daily loss limits, and portfolio diversification. Past performance does not indicate future results.
Optimal usage:
- Works optimally in clearly trending markets where ADX consistently exceeds threshold
- Performance degrades in sideways, choppy conditions
- Designed for swing trading and position trading timeframes (15-minute and above)
- Requires confirmation from price action or additional technical analysis
---
## NO REPAINT GUARANTEE
This indicator operates on bar close confirmation only. All signals, signal lines, and validation labels appear exclusively when candles close. Historical signals remain exactly where they appeared. This makes the indicator suitable for automated trading and reliable backtesting. What you see in historical data matches what appeared in real-time.
---
## ALERTS
The indicator provides eight alert conditions:
1. Kalman Buy Signal: Fires when upward triangle appears (bullish trend change in trending market)
2. Kalman Sell Signal: Fires when downward triangle appears (bearish trend change in trending market)
3. Trend Change to Bullish: Fires whenever Kalman line changes to bullish (regardless of ADX)
4. Trend Change to Bearish: Fires whenever Kalman line changes to bearish (regardless of ADX)
5. SCT-R Long Retest Confirmed: Fires when green R label appears for long validation
6. SCT-R Short Retest Confirmed: Fires when red R label appears for short validation
7. SCT Test Long Detected: Fires when test candle appears for long signal (before confirmation)
8. SCT Test Short Detected: Fires when test candle appears for short signal (before confirmation)
Alert messages include context about bar close confirmation and current price levels.
---
## CALCULATION TRANSPARENCY
While complete proprietary optimization methodology is not disclosed, the core technical approach is fully explained: Alpha-Beta Kalman filter with ATR-based adaptive gain adjustment and ADX regime detection. The signal line validation system uses a three-phase structure (hold, test, confirmation) with configurable parameters. Users can understand indicator functionality and make informed decisions about application.
---
## DISCLAIMER
This indicator is provided as a technical analysis tool. It does not constitute financial advice, trading recommendations, or performance guarantees. All trading decisions carry risk. Users are responsible for their own trading decisions and risk management. Past results do not indicate future performance.

EPS Trendline (Fundamentals Insight by Mazhar Karimi)Overview
This indicator visualizes a company’s Earnings Per Share (EPS) data directly on the chart—pulled from TradingView’s fundamental database—and applies a dynamic linear regression trendline to highlight the long-term direction of earnings growth or decline.
It’s designed to help investors and quantitative traders quickly see how the company’s profitability (EPS) has evolved over time and whether it’s trending upward (growth), flat (stagnant), or downward (decline).
How it Works
Uses request.financial() to fetch EPS data (Diluted or Basic).
You can select whether to use TTM (Trailing Twelve Months), FQ (Fiscal Quarter), or FY (Fiscal Year) data.
The script fits a regression line (using ta.linreg) over a configurable window to visualize the underlying EPS trend.
Updates automatically when new financial data is released.
Inputs
EPS Period: Choose between FQ / FY / TTM
Use Diluted EPS: Toggle to compare Diluted vs. Basic EPS
Regression Window: Adjust how many bars are used to fit the trendline
Interpretation Tips
A rising trendline indicates earnings momentum and potential investor confidence.
A flat or declining trendline may warn of profitability slowdowns.
Combine with price action or valuation ratios (like P/E) for deeper analysis.
Works best on stocks or ETFs with fundamental data (not available for crypto or FX).
Suggestions / Use Cases
Pair with Price/Earnings ratio indicators to evaluate valuation vs. fundamentals.
Use in conjunction with earnings release events for context.
Ideal for long-term investors, swing traders, or fundamental quants tracking financial health trends.
Future Enhancements (Planned Ideas)
🔹 Option to display multiple regression lines (short-term and long-term)
🔹 Support for comparing multiple tickers’ EPS in the same pane
🔹 Integration with Net Income, Revenue, or Free Cash Flow trends
🔹 Add a “Rate of Change” signal for momentum-based EPS analysis

RSI Trendline Pro - Multi Confirmation
Overview
RSI Trendline Pro is an advanced Pine Script indicator that automatically draws trendlines on the RSI (Relative Strength Index) to detect support and resistance breakouts. It generates high-quality trading signals through a multi-confirmation system.
Key Features
Auto Trendlines: Detects pivot points on RSI to create intelligent support and resistance lines
Multi-Confirmation System: Combines Volume, Stochastic RSI, ADX, and Divergence filters to reduce false signals
RSI Divergence Detection: Automatically identifies bullish/bearish divergences between price and RSI
Live Dashboard: Displays RSI value, active trendlines, ADX strength, and last signal info on a visual panel
Smart Breakout Detection: Identifies trendline breaks and generates LONG/SHORT signals
How to Use
Add to TradingView: Paste code into Pine Editor and add to chart
Configure Parameters:
RSI Length: RSI period (default: 14)
Pivot Strength: Trendline sensitivity (lower = more lines)
Filters: Enable/disable Volume, Divergence, Stoch RSI, and ADX confirmations
Follow Signals:
LONG (Green): When RSI breaks resistance upward
SHORT (Red): When RSI breaks support downward
Divergence: "D" markers indicate potential trend reversals
Alert Setup
Script offers 4 alert types:
LONG Breakout: Resistance break
SHORT Breakout: Support break
Bullish/Bearish Divergence: Divergence detection
Any Signal: Combined alert for all signals
Best Practices
Prioritize high-volume breakouts (Volume Filter enabled)
Trends are stronger when ADX > 25
Confirm divergence signals with price action
Trade when 2-3 confirmations align
