Trend Angle Indicator [Iridio Capital]Overview
The Trend Angle Indicator provides a clear and intuitive way to visualize market trends by calculating the inclination (in degrees) of a linear regression line over a set number of bars. Instead of relying on traditional trend indicators that can be difficult to interpret, this tool offers a straightforward angular representation of price movement, making it easy to gauge the strength and direction of a trend at a glance.
How It Works
Linear regression is a statistical method used to model the relationship between variables—in this case, price movement over time. It finds the best-fit line that minimizes deviations from actual price values, allowing us to determine the trend's slope. By converting this slope into degrees, the indicator provides a natural and intuitive way to assess market conditions :
0° → Sideways market (no clear trend)
+25° to +360° → Uptrend (higher inclination means stronger trend)
-25° to -360° → Downtrend (steeper negative angles indicate a stronger decline)
Key Features & Strengths
✅ Intuitive Trend Visualization – Instead of arbitrary values, the indicator expresses the trend in degrees, making it easy to understand how steep the market is moving.
✅ Identifies Consolidation & Strong Trends – The indicator highlights periods of market consolidation (when the angle stays between the green and red horizontal lines) and strong bullish or bearish trends when breaking above or below these thresholds.
✅ Color Highlighting for Trend Strength – Areas above +25° (strong uptrend) and below -25° (strong downtrend) are shaded, allowing for instant recognition of strong moves.
✅ Works on Any Timeframe & Asset – Whether trading stocks, forex, crypto, or futures, this tool helps detect meaningful trends across different markets.
How to Use It
Look at the trend angle line:
If it stays between +25° and -25° , the market is consolidating.
If it breaks above +25° , an uptrend is strengthening.
If it drops below -25° , a strong downtrend is forming.
Use the highlighted regions to confirm strong market momentum .
Combine it with other indicators (e.g., volume, moving averages) for additional confirmation.
Cari dalam skrip untuk "trend"

Trend Structure Shift By BCB ElevateTrend Structure Shift by BCB Elevate
This indicator helps traders identify trend structure shifts by detecting Higher Highs (HH) and Lower Lows (LL) to determine bullish, bearish, or neutral market conditions. It provides real-time trend classification to help traders align with market direction.
How It Works:
📌 Bullish Trend: A new Higher High (HH) is detected, signaling potential uptrend continuation.
📌 Bearish Trend: A new Lower Low (LL) is detected, indicating potential downtrend continuation.
📌 Neutral: No significant trend shift is detected.
Key Features:
✅ Dynamic Trend Detection – Identifies key trend structure shifts using swing highs and lows.
✅ Customizable Settings – Adjust the swing length to fine-tune trend detection.
✅ Trend Table Display – Shows current trend as Bullish, Bearish, or Neutral in a convenient on-chart table.
✅ Table Position Selection – Choose where the trend table appears on the chart (Top/Bottom Left or Right).
✅ Works on All Markets & Timeframes – Use it for Crypto, Forex, Stocks, Commodities, and Indices.
How to Use:
1️⃣ Apply the indicator to your chart.
2️⃣ Observe the Trend Table to determine the market condition.
3️⃣ Use it with support/resistance, moving averages, or other indicators for better trade decisions.
Trend Signals with TP & SL [UAlgo]The "Trend Signals with TP & SL " indicator is a versatile tool designed to assist traders in identifying potential trend continuation opportunities within financial markets Utilizing a combination of technical indicators and user-defined parameters, this indicator aims to provide clear and actionable signals to aid traders in making informed trading decisions.
🔶 Features:
Trend Continuation Signals : The indicator generates signals to identify potential trend continuation points based on the input parameters such as sensitivity, ATR length, and cloud moving average length.
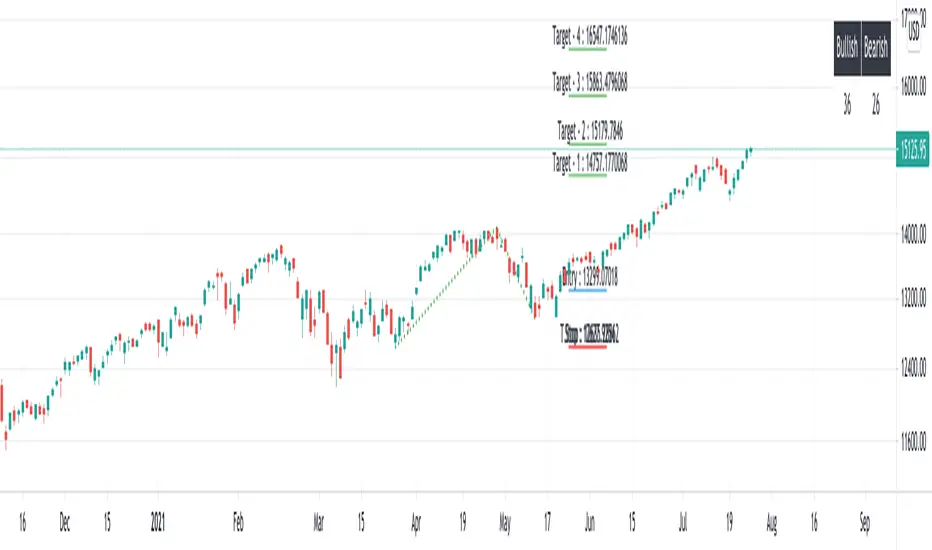
Take-Profit and Stop-Loss Levels: It calculates and plots three levels of take-profit (1R, 2R, 3R) and stop-loss levels based on the entry price of the trade.
Short Position Example:
Long Position Example:
Visualization: The script visualizes the trend signals, entry points, take-profit levels, and stop-loss levels on the price chart, making it easier for traders to interpret the signals.
Alert System: The indicator includes an alert system that notifies the user when there is a change in trend direction or when a buy/sell signal is generated. The alerts provide essential information such as entry price, take-profit levels, and stop-loss levels.
🔶 Calculations :
Trend Calculation: Trend signals are determined based on the comparison between the current closing price and the upper and lower bounds calculated using the Average True Range (ATR) multiplied by a sensitivity factor. A trend is considered bullish if the closing price is above the upper bound and bearish if it's below the lower bound.
Entry, Stop Loss, and Take Profit Calculation: Entry points for long and short positions are identified when there's a change in trend direction.
Stop-loss levels are calculated as a percentage of the entry price, where users can define the percentage based on their risk tolerance.
Take-profit levels are calculated as multiples of the stop-loss level (1R, 2R, 3R).
Cloud Moving Averages: Simple moving averages (SMAs) are calculated for high and low prices over a specified period to create a "cloud" visualization on the chart.
MACD Clouds: Moving Average Convergence Divergence (MACD) indicator is used to determine the market's momentum and trend direction. Positive and negative clouds are plotted based on the MACD line and its signal line, indicating potential bullish or bearish trends.
Signal Generation: Buy and sell signals are generated based on specific conditions such as RSI, CMO (Chande Momentum Oscillator), and pivot points.
Signals are triggered when certain criteria are met, indicating potential opportunities for entering or exiting trades.
🔶 Disclaimer:
Use at Your Own Risk: Trading involves significant risk, and this script is provided for educational and informational purposes only. It does not guarantee profitable trades, and users should exercise caution and perform their own analysis before making trading decisions.
Parameter Sensitivity: The effectiveness of the indicator may vary depending on the chosen parameters, market conditions, and timeframe. Users are encouraged to backtest the script thoroughly and adjust the parameters according to their trading preferences.
Not Financial Advice: The information provided by this script should not be considered as financial advice. Users are solely responsible for their trading decisions and should consult with a qualified financial advisor if needed.
Backtesting and Validation: Before implementing this indicator in live trading, users are strongly encouraged to conduct rigorous backtesting and validation to assess its performance under various market conditions. Past performance is not indicative of future results, and users should carefully evaluate the effectiveness of the indicator based on their individual trading preferences and risk tolerance.

Trend Bar Dow Theory V-1.0The indicator is designed to signal the presence of a trend bar with reduced profit-taking the following day. Below, I explain the logic that I have defined for this first version.
The guidelines I provided are as follows: We identify a trend bar, if it sets a market change, between opening and closing, equal to or greater than 50 pips . This first guideline is used to find a day with good liquidity , which usually leads to a trend bar.
If the first guideline is met, the indicator should change the bar color to white . This way, we can proceed to the second guideline, to detect the presence of reduced profit-taking.
The second guideline should indicate the presence of reduced profit-taking, as explained by Dow Theory, to find a trend context with potential to exploit. Therefore, the second guideline involves coloring the bars near the trend bars in grey, if they have a range equal to or less than 30 pips.
Dow Theory states that a market in trend measures reduced profit-taking, within 33%, up to a maximum of 50% compared to the previous trend bar, but I have not yet been able to make Pine Script calculate the percentage value. If you have any suggestions, I would be grateful.

Trend Volume Indicator by [VanHelsing]Trend Volume and Momentum based indicator
How it works:
The principle of the volume zone oscillator was used here,
but instead of closes > closes (price momentum) was used RSI,
if RSI > 50 it is a positive momentum and we get + volume value, otherwise - volume
Instead of ema's here is a Volume-Weighted Average Price (VWAP) which gives us such shape of TVI line that in general less sensitive to the pullbacks inside a trend.
This indicator is good for catching and following trends.
You can use alerts as well for take values of trend (-1,1) from 1-10D timeframes
Here how to read it

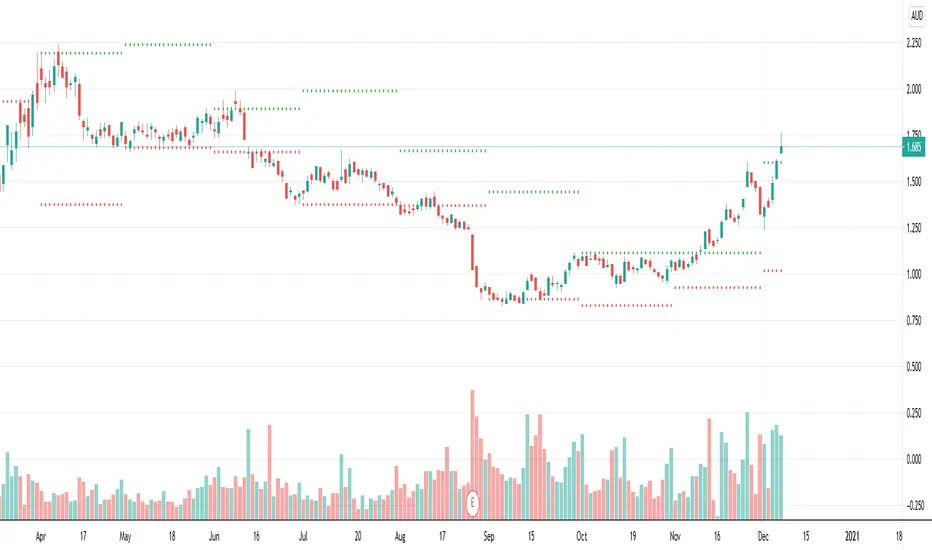
TrendsThe Trends indicator is created for trend trading and (Bitsgap) crypto bots of crypto assets over longer time periods.
Works best for 4h, Daily and Weekly candles (even Monthly), but unsuitable for hourly candles and day trading.
This indicator shows you if a crypto pair is in a Bear, Bull or Sideways market.
The idea is to simplify decision making when to sell or buy, or what pairs to use with trading bots.
Stick to the rule of not having bots in a Bear trend!
- Blue = Bull trend
- Red = Bear trend
- Green = Sideways trend - which can be profitable with trading bots

Divergence-Support/ResistenceAnother script based on zigzag, divergence, and to yield support and resistence levels.
This idea started with below two concepts:
▶ Support and resistence are simply levels where price has rejected to go further down or up. Usually, we can derive this based on pivots. But, if we start looking at every pivot, there will be many of them and may be confusing to understand which one to consider.
▶ Lot of people asked about one of my previous script on divergence detector on how to use it. I believe divergence should be considered as area of support and resistence because, they only amount to temporary weakness in momentum and nothing more. As per my understanding
Trend > Hidden Divergence > Divergence > Oscillator Levels of Overbought and Oversold
⬜ Process
▶ Now combining the above two concepts - what we are trying to do here is draw support resistence lines only on pivots which has observed either divergence or hidden divergence. Continuation and indecision pivots are ignored.
▶ Input requires only few parameters.
Zigzag lengths and oscillator to be used. Oscillator periods are automatically calculated based on zigzag length. Hence no other information required. You can also chose custom oscillator via external source.
▶ Display include horizontal lines of support/resistence which are drawn from the candle from where divergence or hidden divergence is detected.
▶ Support resistence lines are colored based on divergence. Green shades for bullish divergence and bullish hidden divergence whereas red shades for bearish divervence and bearish hidden divergence. Please note, red and green lines does not mean they only provide resistence or support. Any lines which are below the price should be treated as support and any line which are above the price should be treated as resistence.
▶ Divergence symbols are also printed on the bar from where divergence/hidden divergence is detected.
↗ - Bullish Hidden Divergence
↘ - Bearish Hidden Divergence
⤴ - Bullish Divergence
⤵ - Bearish Divergence
▶ Script also demonstrates usage of libraries effectively. I have used following libraries in this code.
import HeWhoMustNotBeNamed/ zigzag /2 as zg
import HeWhoMustNotBeNamed/enhanced_ta/8 as eta
import HeWhoMustNotBeNamed/ supertrend /4 as st
Can be good combination to use it with harmonic patterns.

Zigzag CandlesCan't deny that I am obsessed with zigzags. Been doing some crazy experiments with it and have many more in pipeline. I believe zigzag can be used to derive better trend following methods. Here is an attempt to visualize zigzag as candlesticks. Next steps probably to derive moving average, atr (although there was an attempt of AZR made earlier) and probably supertrend too ;)
Input parameters include ZigzagLength (to calculate zigzag) and CandleSize (number of zigzag pivots in each candle)
CandleSize can be 3 or more. Every time we collect pivots which are equal to CandleSize, we derive one candle. And when we derive a candle, we remove all old pivots except the last one. Becauase, the last pivot acts as open to the next bar and is required.
Body of the candle tells the start and end zigzag pivot in the range. And Wicks signify highest and lowest pivots in the range. High and Low wicks are placed at the pivot where high and lows are formed. Hence, you can see them at different positions each time.
Thanks to @RicardoSantos for suggesting boxes for candles - while I was trying to achieve this with plotbar

Elliot Wave - ImpulseLets dabble a bit into Elliot Waves.
This is a simple script which tries to identify Wave 1 and 2 of Elliot Impulese Wave and then projects for Wave 3.
Ratios are taken from below link: elliottwave-forecast.com - Section 3.1 Impulse
Wave 2 is 50%, 61.8%, 76.4%, or 85.4% of wave 1 - used for identifying the pattern.
Wave 3 is 161.8%, 200%, 261.8%, or 323.6% of wave 1-2 - used for setting the targets
Important input parameters
Length : Zigzag Length. Keep the numbers low if you are looking for smaller and shorter trades. Keep the numbers high if you are looking for longer and bigger trades.
Error Percent : Adjustments for ratios as it is not always possible to find exactly equal retracement ratio.
Entry Percent : Once Wave 2 is formed, entry is set after reversing 30% of wave 2. This number can be increased or decreased. Caution: Keeping the number too low may result in false signals.
Ignore Trend Direction : If unchecked, it will only look for pattern if Wave 1 has made a higher high. If not, it will ignore Wave 1 condition and only look at wave 1 to 2 ratio.
Handle Duplicates : Since, the labels are generated upon crossover of entry price, this crossover may happen multiple times. Or sometimes wave 2 can further extend and generate new signal with same wave 1. This parameter says how to handle such cases. Keep Last is set to default and is most preferred option.
ShowRatios and ShowWaves lets you display wave line and retracement ratios for each pivots
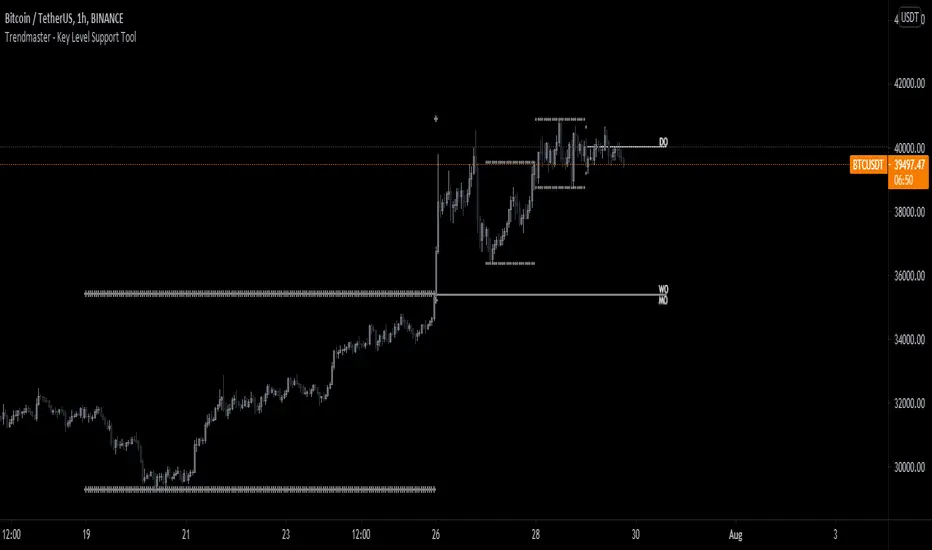
RSI, Range, and Key Level Support Tool v2.1This indicator is actually 3 different indicators combined to be able to watch key levels such as daily/weekly/monthly opens, previous days and week range highs and lows, as well as see Oversold and Overbought conditions relating to the Relative Strength Index (RSI).
- RSI DOTS SYSTEM
The first part is a custom Relative Strength Index indicator that shows RSI dots above in Red and Below in Green of the bars.
As the RSI Dots go from dark and barely visible to bright and Red For Oversold or Green for Overbought it gives a direct representation above the bar chart of Overbought or Oversold conditions. The brighter the color, the closer to 100 (Overbought and Red) or 0 (Oversold and Green) the current RSI is.
As the Overbought and Oversold conditions reverse this will show a bright Yellow Dot over the bar if it crosses a value from Overbought conditions to not Overbought conditions and the same if it crosses from Oversold conditions to not oversold conditions. To put it simply, it shows RSI reversal.
- KEY LEVELS OPENS - Daily, Weekly, Monthly Opens
This is a simple line indicator that shows 3 key levels: Daily Open, Weekly Open, and Monthly Open.
These higher time frame key levels show precisely at what price that time frame opened based on 0 UTC.
- PREVIOUS HIGHS/LOWS
This part of the indicator will show the previous day and even week highs and lows. This will help the user establish a functional range of the previous days and weeks.
The highs and lows for the daily are rows of circles above and below the high and low for that specific day and the previous weekly range are rows of crosses above and below the high and low for the past week.
How to Best use the indicator:
The RSI dots will help the user find the tops and bottoms where the Key Levels Opens and Previous Highs and Lows will help the user establish the range.
Knowing where the local top/bottom is in correlation to the potential range tops and bottoms allows the user to effectively time trend reversals and potential tops/bottoms.
Previous High/Low MTFIndicator to plot higher time frame previous candle highs and lows.
One of the key factor in understanding the trend is to look at higher time-frames chart.
Parameters are explained below:
resolution : Chose resolution of higher timeframe. If set to same as symbol, it will consider next parameter HTFMultiplier for calculation of higher timeframe
HTFMultiplier : Multiply symbol timeframe to by HTFMultiplier to derive higher time-frame
Offset : Number of higher timeframe candles before to be plotted. 1 means - it will show highs/lows of previous higher timeframe candle.
Trend SignalINTRODUCTION
Trend Signal is based on two-period averages algorithm to filters out market noise based.
This gives the chart a smoother appearance, making it easier to spots trends and reversals
USAGE
BUY when candle change from RED to GREEN
SELL when candle change from GREEN to RED
This indicator come with an alert. User able to set an alert notification when trend change detected.
Note:
Best use with Turtle Pro and MCDX+ indicators
Please contact me for access.

Trend-following Strategy E v2.6 4H ETHBTCHi All,
Welcome to my first published Trend-following strategy for Ethereum, designed specifically for POLONIEX:ETHBTC on 4H due its long price history.
This script is based on my previously published scripts for bitcoin.
In order to set up Alerts for this strategy, I've created a second script called Trend-following Alert E v2.6 4H ETHBTC which you can find here:
Here you will find the "active_long" and "active_long" variables (red and blue lines) that show which positions are being taken by the strategy script.
You can set 'Once per bar close' alerts for this to get your alerts on TV.
For instance, I use 'crossing up @ 0.1' on "active_long" to set an 'Open Long" alert and a 'crossing down @ 0.9' to set a 'Close Long' alert.
The same holds for the 'Open Short' and the 'Close Short' alerts but then for the 'active_short' variable.
As you can see from the backtest I've done my best to create a decent ROI with limited DD .
You can also run this backtest/strategy with '100% of equity' but I would advise against trading this as your risk will fundamentally increase.
With a constant order size this strategy should be quite safe to use.
Going from the results it's clear that this strategy excels during clear bull/bear trends but might suffer a little bit during market chop.
This is also where ROI tends to stagnate a little bit only then to take off again during a clear trend.
There are two inputs that can be modified on this strategy, however I think the current settings are optimal for this market on the 4H candle.
I've also added start and end dates to test specific time periods.
Please let me know if you have any questions.

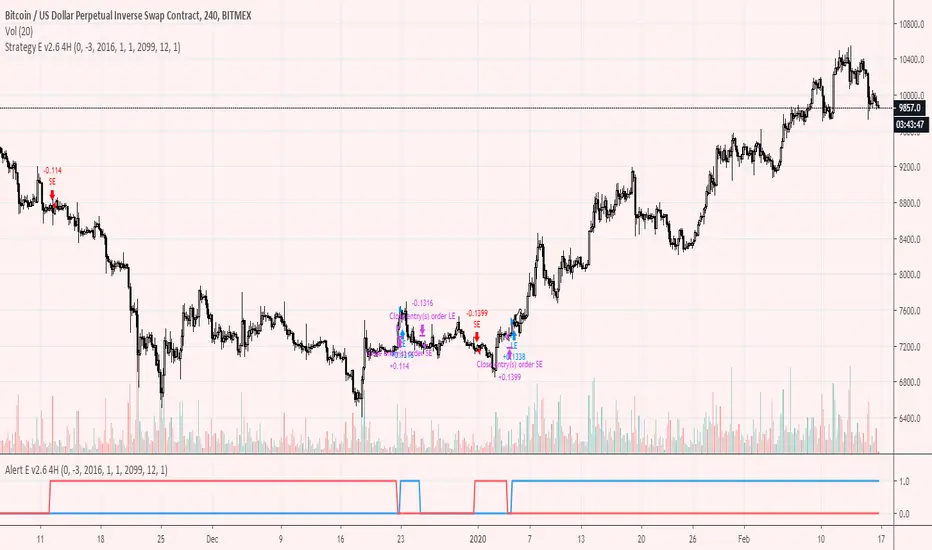
Trend-following Strategy E v2.6 4HHi All,
Welcome to my second published Trend-following strategy for bitcoin , designed specifically for BITMEX:XBTUSD on 4H.
This is an extension of my first script but then for the 4H timeframe.
In order to set up Alerts for this strategy, I've created a second script called Trend-following Alert E v2.6 4H which you can find here:
Here you will find the "active_long" and "active_long" variables (red and blue lines) that show which positions are being taken by the strategy script.
You can set 'Once per bar close' alerts for this to get your alerts on TV.
For instance, I use 'crossing up @ 0.1' on "active_long" to set an 'Open Long" alert and a 'crossing down @ 0.9' to set a 'Close Long' alert.
The same holds for the 'Open Short' and the 'Close Short' alerts but then for the 'active_short' variable.
As you can see from the backtest I've done my best to create a decent ROI with limited DD.
You can also run this backtest/strategy with '100% of equity' but I would advise against trading this as your risk will fundamentally increase.
With a constant order size this strategy should be quite safe to use.
Going from the results it's clear that this strategy excels during clear bull/bear trends but might suffer a little bit during market chop.
This is also where ROI tends to stagnate a little bit only then to take off again during a clear trend.
There are two inputs that can be modified on this strategy, however I think the current settings are optimal for this market on the 2H candle.
I've also added start and end dates to test specific time periods.
Please let me know if you have any questions.
Trend-following Strategy E v2.6Hi All,
Welcome to my first published Trend-following strategy for bitcoin, designed specifically for BITMEX:XBTUSD.
In order to set up Alerts for this strategy, I've created a second script called Trend-following Alert E v2.6 which you can find here:
Here you will find the "active_long" and "active_long" variables (red and blue lines) that show which positions are being taken by the strategy script.
You can set 'Once per bar close' alerts for this to get your alerts on TV.
For instance, I use 'crossing up @ 0.1' on "active_long" to set an 'Open Long" alert and a 'crossing down @ 0.9' to set a 'Close Long' alert.
The same holds for the 'Open Short' and the 'Close Short' alerts but then for the 'active_short' variable.
As you can see from the backtest I've done my best to create a decent ROI with limited DD, i.e., the current max. losing trade for this is -3.8% and max. DD is a mere -8.09%.
You can also run this backtest/strategy with '100% of equity' but I would advise against trading this as DD increases significantly.
With a constant order size, and due to the low inherent DD, this strategy should be quite safe to use.
Going from the results it's clear that this strategy excels during clear bull/bear trends but might suffer a little bit during market chop.
This is also where ROI tends to stagnate a little bit only then to take off again during a clear trend.
There are two inputs that can be modified on this strategy, however I think the current settings are optimal for this market on the 2H candle.
Please let me know if you have any questions.

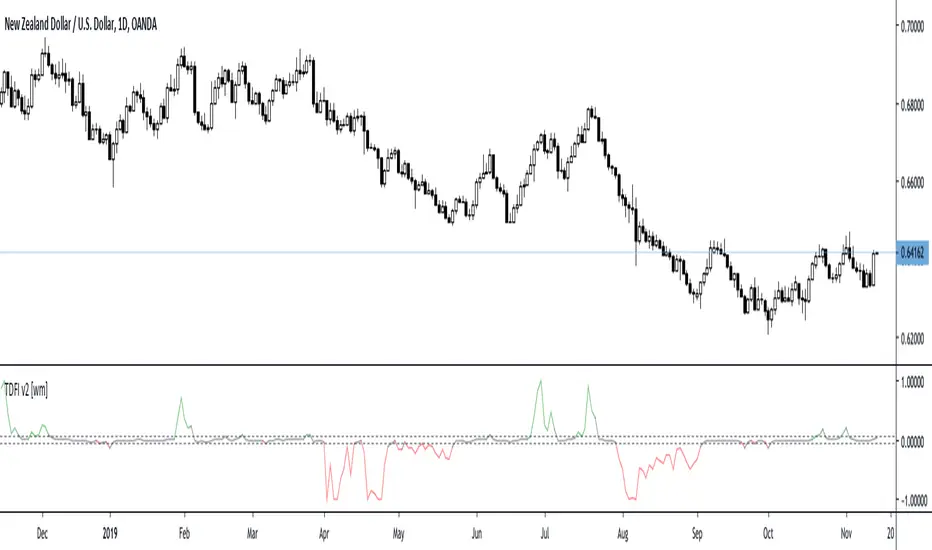
Trend Direction Force Index v2 - TDFI [wm]TDFI can range from -1 to 1 and thus indicate the direction of the trend.
In periods of consolidation ratios take very low values close to zero as a rule, do not exceed the value of 0.05 (and -0.05), which have set arbitrarily as horizontal signal lines. Rate accelerates rapidly to higher values when the consolidation ends and is a good chance of becoming a permanent trend.
As an extension, the trader can assume that as long as the pointer moves above the signal line and does not come down to the low value of less than 0.05 for at least two bars the trend continues. So the descent below signal line and a return to higher values should be interpreted as a temporary weakening trend. Not before rate remains below 0.05 for at least 2 bars, can we consider that the market is likely to begin to consolidate
In addition, we can assess the strength of the trend, depending on the value of the index – the index reaches 1 trend is strong (-1 is a strong downward trend) and generally values above 0.6 should be so interpreted. Less than in decline should be considered that the trend is losing its momentum.
Change Log:
* Refactored tdfi implementation. Functionally exactly the same
* Added selectable smoothers
* Added finer grained inputs fora each smoother
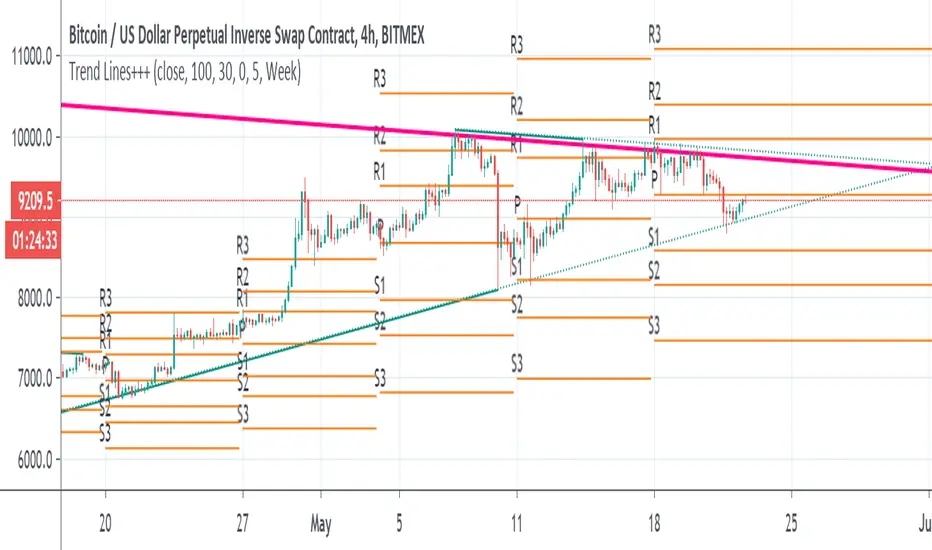
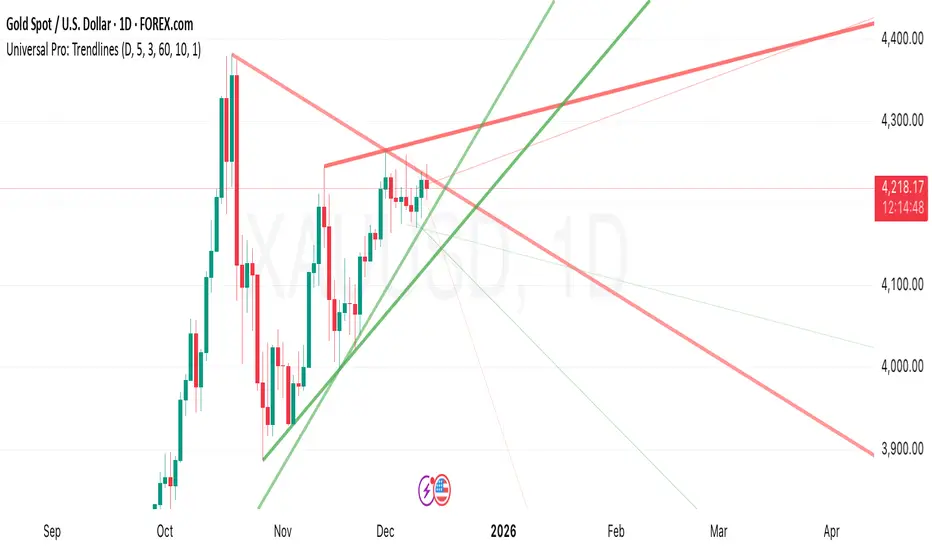
Trend Lines+++scripts taken from
Nothing here is mine , just put it as I like the combination of those script together when I analyse data
so it make life easy to draw line automode
I suggest 4 hours or daily chart with MACD and RSI
Thanks to autors in scripts
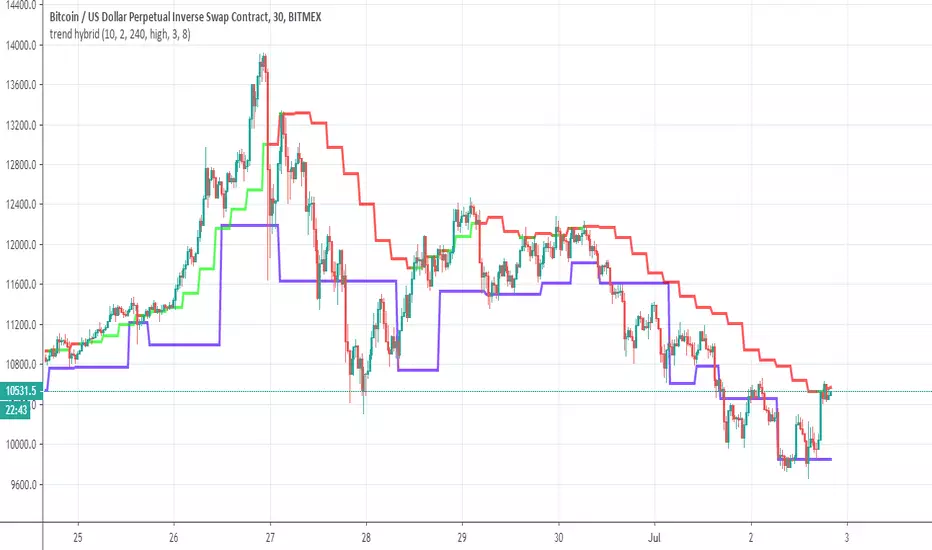
trend hybridThis indicator based on two part
first part is the lower of the famous Darvas top
the upper part is made from EMA trend as replacement for th ethe top of the Darvas box
By similar logic we can decide to go long or short as the Darvas box but herfe by using the Ema trend line which is MTF type we can find better optimum for shorting or longing
So it a simple indicator but can ce very usefull to see trends if properly done
Trend signal with AlertHello traders,
I updated the Trend signal indicator from @riffster21 () and added alerts to it.
Nothing fancy but still extremely useful
How to use the Trend signal with alerts indicator
In this screenshot, I didn't select the most optimal timeframe, neither the most optimal input for the indicator. I just wanted to explain with a very simple example, how it works and how to use it
Basically, it's being used to simulate obliques trendlines. I draw that one in pink to highligh what is the trendline simulated by the indicator
For Which timeframe ?
It's working for all timeframes.
Recommended input for the indicator ?
The greater the timeframe, the lesser the input should be. Which makes sense because setting a high value period on a weekly chart will give entry/exit signals way too late
On the contrary, on a m5 chart, setting a low value period will give too many fake signals and you'll get angry. I don't want that to happen :)
For crypto intraday trading (meaning m5 to H4), I feel the sweet spot is between 7 and 14 for the indicator input.
For crypto Swing trading (meaning H8 to weekly), an input between 3 and 5 is best
I can only strongly encourage you to apply it on a newly created chart without any other indicator and try to find the best input for the asset. Please note the ideal input might change between assets (example: BTC/USD vs ETH/BTC)
Drawing the corresponding oblique is very important the first time setting them on a chart to find the best setup
Please let me know in the comments section if you have any question
Good luck folks
Dave

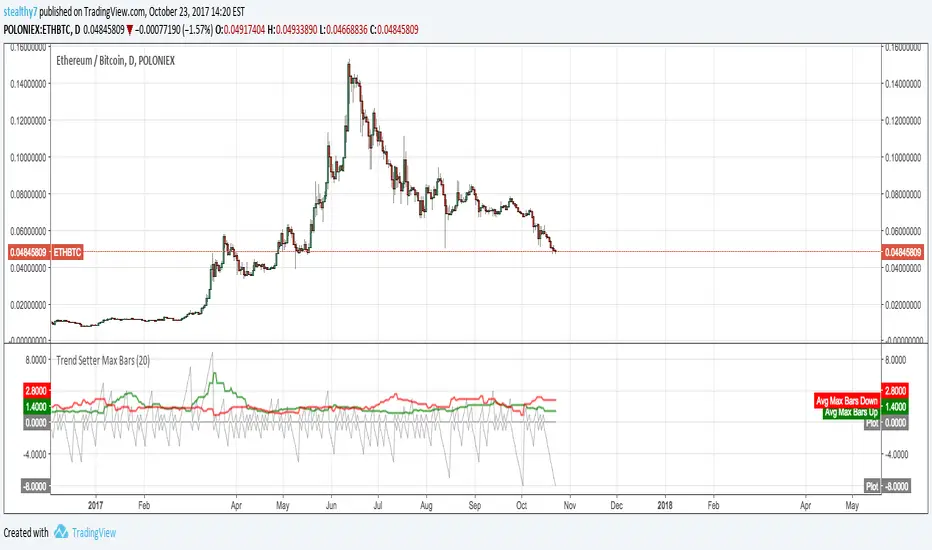
Trend Setter Max BarsThis script allows you to visualize trends. It counts continuous bars in the same direction, then makes an average of the maximum count in the look back period. If Green is above Red, its strength is upward and vice versa. This doesn't use returns or measure price moves.
*Positive Gray is current up bars count. Negative Gray down current down bars count
*Green and Red are average max counts.
This info could possibly be used to gauge trends or momentum.
Note: I finally figured out how to use loops and mutable variables in V3.
Trend RSI (TRSI)Attempting to build onto this Trend Rsi and using several tweaks to increase accuracy based on rsi and signal positions for entries amongst other things

Trend Direction Indicator//This indicator simply tells the trend direction and created for listing achieves which simplifies the shares those have an UP direction.