Recursive Micro Zigzag🎲 Overview
Zigzag is basic building block for any pattern recognition algorithm. This indicator is a research-oriented tool that combines the concepts of Micro Zigzag and Recursive Zigzag to facilitate a comprehensive analysis of price patterns. This indicator focuses on deriving zigzag on multiple levels in more efficient and enhanced manner in order to support enhanced pattern recognition.
The Recursive Micro Zigzag Indicator utilises the Micro Zigzag as the foundation and applies the Recursive Zigzag technique to derive higher-level zigzags. By integrating these techniques, this indicator enables researchers to analyse price patterns at multiple levels and gain a deeper understanding of market behaviour.
🎲 Concept:
Micro Zigzag Base : The indicator utilises the Micro Zigzag concept to capture detailed price movements within each candle. It allows for the visualisation of the sequential price action within the candle, aiding in pattern recognition at a micro level.
Basic implementation of micro zigzag can be found in this link - Micro-Zigzag
Recursive Zigzag Expansion : Building upon the Micro Zigzag base, the indicator applies the Recursive Zigzag concept to derive higher-level zigzags. Through recursive analysis of the Micro Zigzag's pivots, the indicator uncovers intricate patterns and trends that may not be evident in single-level zigzags.
Earlier implementations of recursive zigzag can be found here:
Recursive Zigzag
Recursive Zigzag - Trendoscope
And the libraries
rZigzag
ZigzagMethods
The major differences in this implementation are
Micro Zigzag Base - Earlier implementation made use of standard zigzag as base whereas this implementation uses Micro Zigzag as base
Not cap on Pivot depth - Earlier implementation was limited by the depth of level 0 zigzag. In this implementation, we are trying to build the recursive algorithm progressively so that there is no cap on the depth of level 0 zigzag. But, if we go for higher levels, there is chance of program timing out due to pine limitations.
These algorithms are useful in automatically spotting patterns on the chart including Harmonic Patterns, Chart Patterns, Elliot Waves and many more.
Cari dalam skrip untuk "trend"

Auto Motive Wave [Trendoscope]Earlier we created an interactive script to study Motive Waves by manually selecting the wave patterns on the chart.
You can find the open source script here:
In this indicator, we will try to do it automatically. Hence, you don't need to draw the waves manually to check anymore. The indicator will do it for you.
🎲 Conditions for Motive Wave
Rules for Motive Waves remain same as before. Motive wave can be either Impulse or Diagonal Wave. Diagonal wave can be either expanding or contracting diagonals. To learn more about diagonal waves, please go through this idea.
🎲 Rules for generic motive waves are as below
Pivots in order - Checks wether the pivots selected are in progressive order.
Directions in order - Checks if the pivot directions are correct - either PH, PL, PH, PL, PH, PL or PL, PH, PL, PH, PL, PH
Wave 2 never moves beyond the start of wave 1 - Wave 2 retracement is less than 100% of wave1
Wave 3 always moves beyond the end of wave 1 - Wave 3 retracement is more than 100% of wave2
Wave 3 is never the shortest one - Checks if Wave 3 is bigger than either Wave 1 or wave 5 or both.
🎲 Now, these are the specific rules for Impulse Waves on top of Motive Wave conditions
Wave 4 never moves beyond the end of Wave 1 - meaning wave 1 and wave 4 never overlap on price scale.
Wave 1, 3, 5 are all not extended. We check for retracement ratios of more than 200% to be considered as extended wave.
🎲 Below are the conditions for Diagonal Waves on top of Motive Wave conditions
Wave4 never moves beyond the start of Wave 3 - Wave 4 retracement is less than 100%
Wave 4 always ends within the price territory of Wave 1 - Unlike impulse wave, wave 4 intersects with wave 1 in case of diagonal waves. This is the major difference between impulse and diagonal wave.
Waves are progressively expanding or contracting - Wave1 > Wave3 > Wave5 and Wave2 > Wave4 to be contracting diagonal. Wave1 < Wave3 < Wave5 and Wave2 < Wave4 to be expanding diagonal wave.
Settings are for the indicator include option to select zigzag length, theme color, and few constraints about the waves to be scanned. You can use the tooltips to find more about them

Custom Trend Indicator with Reversal ArrowsThe Custom Trend Indicator with Reversal Arrows is a user-friendly script designed to help traders identify trends and trend reversals on the TradingView platform. This indicator analyzes price action and generates trend lines based on user-defined rules for uptrends, downtrends, and no-trend conditions. Additionally, it highlights trend reversal points with arrows for easy identification.
Features:
Customizable Line Offset Multiplier: Allows users to set the distance between the trend line and the candlesticks. This makes the trend lines more visually discernible.
Trend Identification:
Uptrend: The indicator plots a green line when the current high, low, and close are greater than the previous high, low, and close, respectively.
Downtrend: The indicator plots a red line when the current high, low, and close are less than the previous high, low, and close, respectively.
No Trend: The indicator plots a black line when neither an uptrend nor a downtrend is identified.
Trend Reversal Arrows: The script displays green arrows pointing upwards for bullish trend reversals and red arrows pointing downwards for bearish trend reversals.
To use this indicator, simply copy and paste the provided Pine Script into the Pine editor on TradingView, and add the indicator to your chart. This powerful and customizable tool will enhance your ability to identify trends and capitalize on trend reversals in your trading strategy.
Please note that this indicator is intended for educational purposes only and should not be considered as financial advice. Always perform your own due diligence and consult with a financial professional before making any trading decisions.

Recursive Reversal Chart Patterns [Trendoscope]Caution: This algorithm is very heavy and bound to cause timeouts. If that happens, there are few settings you can change to reduce the load. (Will explain them in the description below)
🎲 Recursive Reversal Chart Patterns Indicator
Welcome to another exploration of Zigzag and Pattern ecosystem components. Previously we derived Pitchfork and Recursive Zigzag indicators. This indicator is designed to scan and highlight few popular "Reversal Chart Patterns". Similar to other indicators in the ecosystem, this too is built on recursive zigzags.
Double Taps
Triple Taps
Cup and Handles
Head and Shoulders
Indicator however names the patterns separately for bullish and bearish formations. So, the actual names you see on the screen are
Double Top
Double Bottom
Triple Top
Triple Bottom
Cup and Handle
Inverted Cup and Handle
Head and Shoulders
Inverse Head and Shoulders
Here is a snapshot on how each category of patterns look on the chart.
🎲 Architecture
Many of you may be cursing me for publishing too many libraries. But, these are all preparations for something big. Like other indicators in the Zigzag and Patterns Ecosystem, this too uses a bunch of libraries.
🎯Major direct dependencies
ZigzagTypes
ZigzagMethods
ReversalChartPatternLibrary
🎯Indirect dependencies
DrawingTypes
DrawingMethods
🎯Minor dependencies
Utils
TradeTracker
🎲 Indicator Settings
🎯Generic and Zigzag Settings.
Note: In case of timeout, please decrease the value of depth parameter
🎯Pattern Selection
Having all the patterns selected on chart may also cause timeouts and will make the chart look messy. It is better to limit one or two patterns on the chart to have clear picture.
🎯Scanner Settings
🎯Indicators.
These are options to use indicators as secondary confirmation to calculate divergence. If selected, the patterns are shown only if the divergence data is inline. Option also available to plugin external indicator. These calculations are not straightforward and not easy to measure by manual inspection. This feature at present is purely experimental.
Have a go and let me know how you feel :)

Session Filter [Trendoscope]🎲 Session Filter: A Customisable Trading Indicator for Defining Preferred Trade Sessions
Session Filter is a simple trading indicator that enables traders to define their preferred trading sessions and optimise their approach based on individual preferences. By providing a range of flexible customisation options, Session Filter can help traders reduce risk, increase accuracy, by helping them to adhere to their trading sessions. Features include
🎯 Customisable Trading Sessions
One of the key features of Session Filter is the ability to select from four different trading sessions. These sessions are designed to be flexible, making it easy to tailor your approach to specific markets, assets, and trading styles. By selecting the sessions that are most relevant to your strategy, you can reduce the risk of making trades during less favourable market conditions.
For example, if you prefer to trade during the Asian session, you can set the session times to "Asian Session" in input settings. This will highlight the specific times when the Asian markets are open, allowing you to focus your trading activity during these periods. By doing so, you can avoid trading during times when the market is less active or more volatile.
🎯 Customisable Timezone and Days of the Week:
In addition to customisable trading sessions, Session Filter also allows users to select a timezone and specific days of the week. This ensures that the displayed trading zones and signals are aligned with your local time, and that you can tailor your approach to your preferred schedule. This is particularly useful for traders who have other commitments, or who prefer to focus on specific markets or assets on certain days.
For example, if you are based in New York and prefer to trade during the European session, you can select the "European Session" option in Session Filter and adjust the timezone to reflect your local time. You can also select specific days of the week when you prefer to trade during the European session, such as Tuesday through Thursday. This allows you to optimize your approach based on your personal preferences and schedule.
🎯 Easy Visual Interpretation:
Session Filter uses green and red overlays on the chart to indicate the trading zones, making it easy for users to visually identify their trading sessions
For example, when a green overlay is displayed on the chart, this indicates that the market is within the selected trading session and that it may be a good time to start trade. Conversely, when a red overlay is displayed, this indicates that the market is outside of the selected trading session and that it may be a good time close all trading. By providing this visual feedback, Session Filter helps traders stay focused and disciplined, and avoid making impulsive trading decisions.
🎯Force Exit Signal for Risk Management:
Session Filter also offers the ability to generate a force exit signal when not in any of the selected sessions. This can be used in conjunction with alerts to exit all trades outsize session zone.
For example, if you are using Session Filter to trade during the European session, but the market is particularly volatile during a specific day, the force exit signal will be generated to indicate that it may be a good time to exit your trade. This helps you avoid potential losses and stay disciplined during periods of market turbulence.
🎯External Signal Plots:
In addition to the chart overlays, Session Filter also plots signals on the data window that can be used as external inputs in other indicators and strategies. This feature allows traders to incorporate the signals generated by Session Filter into their existing trading systems and this can be used as additional filters on an existing strategy or methodology.
🎯Alerts using Alert Conditions
Alerts are provided for start and end of session so that users can make use of it to set auto turn on or off their bots.
Settings are pretty simple and are explained here.

Recursive Zigzag [Trendoscope]Here is an another outcome of Object Oriented Zigzag and Pattern Ecosystem of Libraries.
We already have another implementation of recursive zigzag which makes use of earlier library rzigzag . Here in this example, we make use of similar logic but leverage the new type and method based Zigzag system libraries to derive the indicator.
🎲 Design Overview
Similar to Recursive Auto Pitchfork, here too the indicator code is around 50 lines. Whereas most of the heavy lifting is done by the libraries.
🎲 Base Libraries
Base libraries are those which does not have any dependency. They form basic structures which are later used in other libraries. These libraries need to be crafted carefully so that minimal updates are done later on. Any updates on these libraries will impact all the dependent libraries and scripts.
🎯 Drawing
DrawingTypes - Defines basic drawing types Point, Line, Label, Box, Linefill and related property types.
DrawingMethods - All the methods or functionality surrounding Basic types are defined here.
🎲 Layer 1 Libraries
These are the libraries which has direct dependency on base libraries.
🎯 Zigzag
ZigzagTypes - Types required for defining Zigzag and Divergence
ZigzagMethods - Methods associated with Zigzag Type definitions.
🎲Indicator
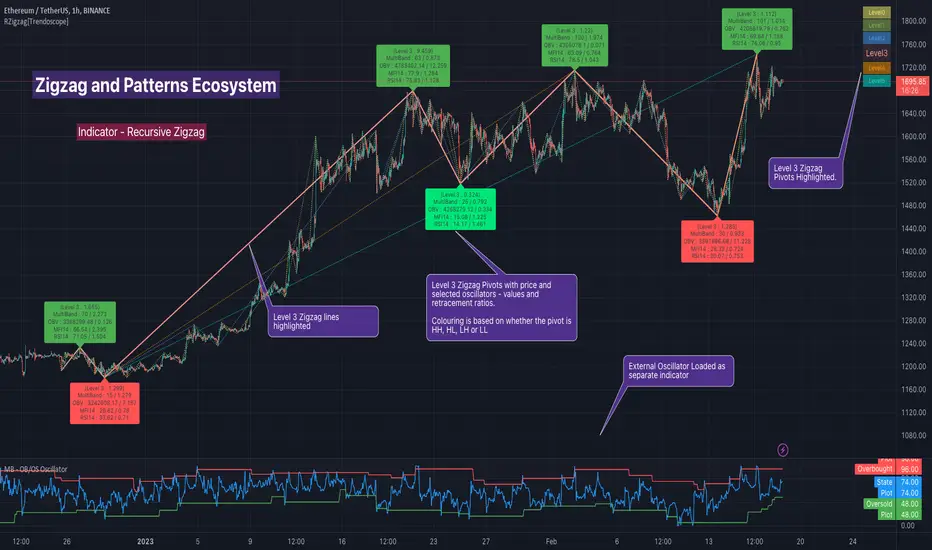
Indicator draws zigzags based on given length. And then recursively derives next level zigzags based on previous levels. As per the utility, indicator is useful in several ways
Visualising price structure based on zigzag pivots - which in turn can help visualise patterns.
Ability to add any oscillator makes it easy to spot divergences with choice of indicators.
Programmers can use the derived values to build complex algorithms such as automatic pattern recognition.
🎯 Settings
Settings are explained via tooltips. These are very much straight forward and directly related to zigzag, oscillators and divergence.
Recursive Auto-Pitchfork [Trendoscope]"Say Hi" to object oriented programming with Pinescript using types and methods. This is the beginning of new era of Pinescript where we are moving from isolated scripts containing indicator and strategies to whole ecosystem of Object Oriented Programming with libraries of highly reusable components. Those who are familiar with programming would have already realised how big these improvements are and what it brings to the table.
With this script, I am not just providing an indicator for traders but also an introduction for programmers on how to design and build object oriented components in Pinescript using types and methods. Big thanks to Tradingview and Pine development team for making this happen. We look forward for many such gifts in the future :)
🎲 Architecture
As mentioned before, we are not just building an indicator here. But, an ecosystem of components. Using Types and Methods we can visualise libraries as Classes. Thus, we can build an ecosystem of libraries in layered approach to enhance effective code reusability.
Generic architecture can be visualised as below
Coming to the specific case of Auto Pitchfork indicator, the indicator code is less than 50 lines for logic and around 100 lines of inputs. But, most of the heavy-lifting is done by the libraries underneath. Here is a snapshot of related libraries and how they are connected.
All libraries are divided into two portions.
Types - Contains only type definitions
Methods - Contains only method definitions related to the types defined in the Types library
Together, these libraries can be visualised as Class. Methods are defined in such a way all exported methods are related to Types and no other functions or features are defined. If we need further functionality which does not depend on the types, we need to do this via some other library and use them here. Similarly, we should not define any methods related to these types in other libraries.
Reason for splitting the libraries to types and methods is to enable updating methods without disturbing types. Since libraries create interdependencies due to versioning, it is best if we do less updates on the type definitions. Splitting the two enables adding more features while keeping the type definition version intact.
🎲 Base Libraries
Base libraries are those which does not have any dependency. They form basic structures which are later used in other libraries. These libraries need to be crafted carefully so that minimal updates are done later on. Any updates on these libraries will impact all the dependent libraries and scripts.
🎯 Drawing
DrawingTypes - Defines basic drawing types Point, Line, Label, Box, Linefill and related property types.
DrawingMethods - All the methods or functionality surrounding Basic types are defined here.
🎲 Layer 1 Libraries
These are the libraries which has direct dependency on base libraries.
🎯 Zigzag
ZigzagTypes - Types required for defining Zigzag and Divergence
ZigzagMethods - Methods associated with Zigzag Type definitions.
🎯Pitchfork
PitchforkTypes - Basic and Drawing Types for Pitchfork objects
PitchforkMethods - Methods associated with Pitchfork type definitions
🎲 Indicator and Settings
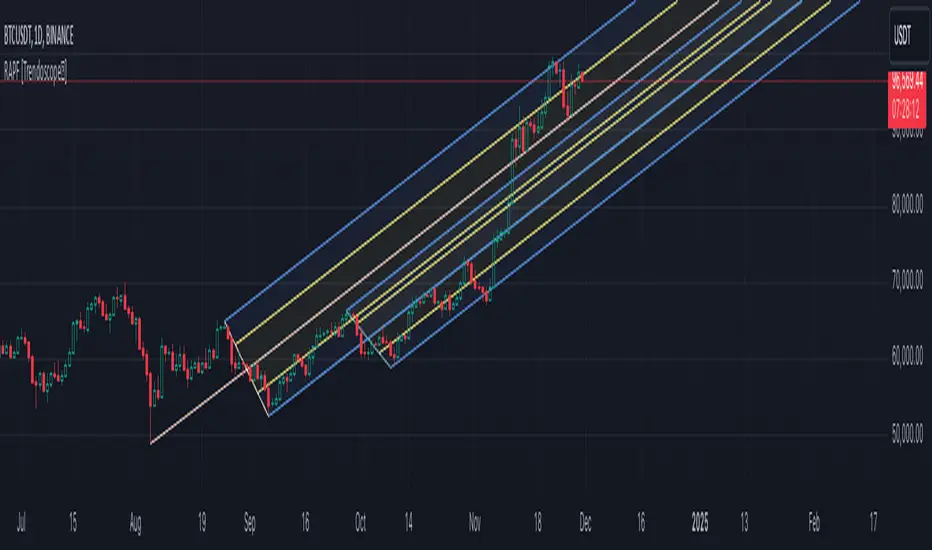
Indicator draws pitchfork based on recursive zigzag configurations. Recursive zigzag is derived with following logic:
Base level zigzag is calculated with regular zigzag algorithm with given length and depth
Next level zigzag is calculated based on base zigzag. And we recursively calculate higher level zigzags until we are left with 4 or less pivots or when no further reduction is possible
On every level of zigzag, we then check the last 3 pivots and draw pitchfork based on the retracement ratio.
Indicator settings are summarised in the tooltips and are as below.
Finally, big thanks to my partner @CryptoArch_ for bringing up the topic of pitchfork for our next development.
RSI Impact Heat Map [Trendoscope]Here is a simple tool to measure and display outcome of certain RSI event over heat map.
🎲 Process
🎯Event
Event can be either Crossover or Crossunder of RSI on certain value.
🎯Measuring Impact
Impact of the event after N number of bars is measured in terms of highest and lowest displacement from the last close price. Impact can be collected as either number of times of ATR or percentage of price. Impact for each trigger is recorded separately and stored in array of custom type.
🎯Plotting Heat Map
Heat map is displayed using pine tables. Users can select heat map size - which can vary from 10 to 90. Selecting optimal size is important in order to get right interpretation of data. Having higher number of cells can give more granular data. But, chart may not fit into the window. Having lower size means, stats are combined together to get less granular data which may not give right picture of the results. Default value for size is 50 - meaning data is displayed in 51X51 cells.
Range of the heat map is adjusted automatically based on min and max value of the displacement. In order to filter out or merge extreme values, range is calculated based on certain percentile of the values. This will avoid displaying lots of empty cells which can obscure the actual impact.
🎲 Settings
Settings allow users to define their event, impact duration and reference, and few display related properties. The description of these parameters are as below:
🎲 Use Cases
In this script, we have taken RSI as an example to measure impact. But, we can do this for any event. This can be price crossing over/under upper/lower bollinger bands, moving average crossovers or even complex entry or exit conditions. Overall, we can use this to plot and evaluate our trade criteria.
🎲 Interpretation
Q1 - If more coloured dots appear on the top right corner of the table, then the event is considered to trigger high volatility and high risk environment.
Q2 - If more coloured dots appear on the top left corner, then the events are considered to trigger bearish environment.
Q3 - If more coloured dots appear on the bottom left corner of the chart, then the events are considered insignificant as they neither generate higher displacement in positive or negative side. You can further alter outlier percentage to reduce the bracket and hence have higher distribution move towards
Q4 - If more coloured dots appear on the bottom right corner, then the events are considered to trigger bullish environment.
Will also look forward to implement this as library so that any conditions or events can be plugged into it.

Harmonic Patterns Based SupertrendExtending the earlier implemented concept of Harmonic-Patterns-Based-Trend-Follower , in this script, lets make it work as supertrend so that it is more easier to operate.
🎲 Process
🎯 Derive Zigzag and scan harmonic patterns for last 5 confirmed pivots
🎯 If a pattern is found, bullish and bearish zones are calculated based on parameter Base
🎯 These bullish and bearish zones act as supertrend based on current trade in progress.
🎯 When in bullish mode, bearish zone will only go up irrespective of new pattern forming new low. Similarly when in bearish mode, bullish zones will only come down - this is done to imitate the standard supertrend behaviour.
🎲 Note
Patterns are not created on latest pivot as last pivot will be unconfirmed and moving. Due to this, patterns appear after certain delay - patterns will not be real time. But, this is expected and does not impact the overall process.
Here are few chart captures to demonstrate how it works.
🎲 Settings
Settings are explained in the screenshot below.

Wolfe Strategy [Trendoscope]Hello Everyone,
Wish you all Merry X-Mas and happy new year. Lets start 2023 with fresh new strategy built on Wolfe Indicator. Details of the indicator can be found here
🎲 Wolfe Concept
Wolfe concept is simple. Whenever a wedge is formed, draw a line joining pivot 1 and 4 as shown in the chart below:
For simplicity, we will only consider static value for Target and Stop. But, entry is done based on breaking the triangle. Revised strategy looks something like this:
🎲 Settings
Settings are simple and details of each are provided via tooltips.
Out of these, the most important one is minimum risk reward ratio. If you set lower risk reward threshold then losing few trades may generate more losses than more winning trades. Similarly higher value will filter out most of the trades and may not work efficiently. Default value set to 1 to make sure optimal risk reward is present before placing trade. Also make note that since the entry bar is always moving towards stop, as and when pattern progress, the RR will also increase. Hence, a pattern which is below RR threshold may become good to trade at certain point of time in future.
🎲 Strategy Parameters
Default strategy parameters are initialised via definition. Margins are set to 100 to disable leveraged trades. Appropriate values are chosen for other parameters. These can be altered based on individual strategy and trading plan.
As the strategy concentrates on the single pattern, number of trades generated are comparatively less. But, there is chance to increase the algorithm further to catch more such patterns on larger scale. Will try to work on them in next versions.
🎲 Pine Strategy limitations
Backtest can only be done on one direction as pine strategy cannot have both long and short open trades together. Hence, it is mandatory to chose either long/short trades in settings.
Since pyramiding is limited to 1, there is possibility of a pattern not generating trade even though the entry conditions are met. They are just based on pine limitations and not necessarily mean patterns are not good for placing trades.

Channel Based Zigzag [HeWhoMustNotBeNamed]🎲 Concept
Zigzag is built based on the price and number of offset bars. But, in this experiment, we build zigzag based on different bands such as Bollinger Band, Keltner Channel and Donchian Channel. The process is simple:
🎯 Derive bands based on input parameters
🎯 High of a bar is considered as pivot high only if the high price is above or equal to upper band.
🎯 Similarly low of a bar is considered as pivot low only if low price is below or equal to lower band.
🎯 Adding the pivot high/low follows same logic as that of regular zigzag where pivot high is always followed by pivot low and vice versa.
🎯 If the new pivot added is of same direction as that of last pivot, then both pivots are compared with each other and only the extreme one is kept. (Highest in case of pivot high and lowest in case of pivot low)
🎯 If a bar has both pivot high and pivot low - pivot with same direction as previous pivot is added to the list first before adding the pivot with opposite direction.
🎲 Use Cases
Can be used for pattern recognition algorithms instead of standard zigzag. This will help derive patterns which are relative to bands and channels.
Example: John Bollinger explains how to manually scan double tap using Bollinger Bands in this video: www.youtube.com This modified zigzag base can be used to achieve the same using algorithmic means.
🎲 Settings
Few simple configurations which will let you select the band properties. Notice that there is no zigzag length here. All the calculations depend on the bands.
With bands display, indicator looks something like this
Note that pivots do not always represent highest/lowest prices. They represent highest/lowest price relative to bands.
As mentioned many times, application of zigzag is not for buying at lower price and selling at higher price. It is mainly used for pattern recognition either manually or via algorithms. Lets build new Harmonic, Chart patterns, Trend Lines using the new zigzag?

Next Pivot Projection [Trendoscope]Still experimental. Extending further on the divergence backtest results - in this script we try to project next 2 pivots (including one unconfirmed pivot)
🎲 Previous experiments
1. Divergence-Backtester
2. Divergence-Backtester-V2
🎲 Additions
Apart from collecting the stats on number of occurrences of HH, HL, LH, LL - this script also keeps track of average ratio for each levels and average bars.
Based on these data, we try to calculate the next pivot projections including possible bar and price.
Cloud covering the candles indicate historical levels of average HH, HL, LH, LL projections.
Hover on projection labels to find more details in tooltips.
🎲 Overall method in a nutshell
🎲 Going bit deeper
🎯 Unconfirmed Pivot and its projection - Last pivot of the zigzag is always unconfirmed. Meaning, it can potentially repaint based on further price movements. But, projection of the unconfirmed pivot will not change as it will be based on previous two pivots - both of which are confirmed.
🎯 Next Pivot Projection - Next pivot is projected based on last two pivots - which include last unconfirmed pivot. Hence, these projections can potentially repaint based on the last pivot repaint.
🎯 Historical projections displayed as cloud - Historical projection values are displayed as cloud around pivots.
A cloud above represents area from average lower high range to average higher high range. Cloud color is green if average ratio of pivot high is more than 1. Red Otherwise.
A cloud below represents area from average higher low range to average lower low range. Cloud color is red if average ratio of pivot high is more than 1. Green otherwise

Auto Harmonic Pattern - Extreme [Trendoscope]Publishing free to use scripts always brought me more value - be it in terms of more followers, or helped me to engage with people having right ideas. This has helped me immensely over past few years of my presence in tradingview. To all the coders out there who is starting to work on pinescript - my suggestion is to publish as many open source/free to use scripts as possible. It will always be rewarding experience and help you grow in a way you can never imagine.
Today, I realised that I have accumulated 10,000+ followers in tradingview just by learning and publishing what I learn. As token of gratitude to all our followers and supporters, we would like to gift this indicator. This is also tribute to all the people who have positively influenced our presence in tradingview and encouraged us to reach this level. Unfortunately cannot publish it as open source due to having proprietary code in it and fear of being misused.
I will not talk about the subject harmonic patterns as it is very generic and information is available online in many places. You can also refer to my open source libraries and scripts related to harmonic patterns. Some of them are here:
Libraries
eHarmonicpatternsExtended
eHarmonicpatterns
harmonicpatterns
Indicators
Harmonic-Patterns-Custom-Candles
Manual-Harmonic-Patterns-With-interactive-inputs
Manual-Harmonic-Projections-With-interactive-inputs
Auto-Harmonic-Patterns-V2
There are few more among open source and free scripts. But, will not mention them here as they are deprecated.
Now coming to the present indicator.
Setting are made simpler to enhance usability. This can also help new traders learning harmonic patterns. Snapshot of the settings can be found here:
Components of the script are as below
Please note, I may not be able to make any further update to this script. But, I promise never to degrade or reduce the quality of any free to use or open source script I ever published.

Crypto Volume/Strength ComparatorHello Traders,
Here is an attempt to perform comparative analysis between top cryptos based on strength (oscillator) and volume. Methodology used here is similar to Magic Number formula described in the post : Enhanced Magic Formula for fundamental analysis . But, instead of using fundamentals, we are making use of few technicals to derive similar outcome. Usage of the available stats will not be same as Magic number since we are using technicals.
⬜ Process
▶ Get crypto exchange based on prefix of instrument being used.
▶ For the given exchange, get data for all the tickers available in input fields.
▶ Calculate Oscillator, Momentum based on price for each tickers.
▶ Calculate Oscillator, Momentum based on volume for each tickers.
▶ Calculate Volatility for each tickers.
▶ Rank Price-Oscillator, Price-Momentum, Volume-Oscillator, Volume-Momentum, Volatility for each tickers.
▶ Calculate combined rank by adding up individual ranks.
▶ Calculate movement of rankings from bar to bar
▶ Sort tickers based on rank and populate them on table. Display direction of rankings.
⬜ Components
Display components are as follows:
⬜ Settings
Settings are pretty simple and straightforward
⬜ Calculations
▶ Oscillators : High values of oscillators are considered as ideal as the process is intended towards finding trend.
▶ Momentum : Momentum is calculated on the basis of Squeeze Momentum Indicator by @LazyBear.
▶ Volatility : Volatility is calculated on the basis of Williams Vix Fix by @ChrisMoody. Here too since we are in trend following mode, lower vix fix is considered ideal.
⬜ Few Notes
Tickers will show data only if selected exchange has them. Some tickers are not available in all exchanges. In that case, it will show NAN. This is kind of unavoidable as we need to have fixed size arrays for any calculations.
Indicator works only on crypto tickers which has valid exchange.
Tickers move through the rankings in real time. Background of all stats are based on gradient from green to red.
Tickers on top may not always have better long opportunity or tickers at bottom may not always be optimal for shorting. We need to consider how long the instrument may stay in the position or how fast it is moving in opposite direction. Hence, directions of the ranking movement are also shown on the table.

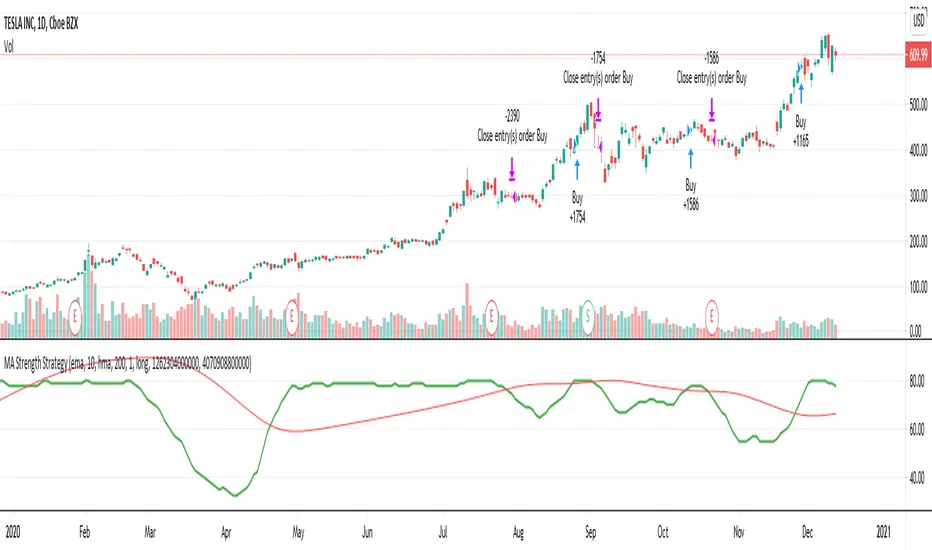
MA Strength StrategyThis is based on Aligned Moving Average Index published earlier:
But, instead of scoring trend based on how many moving averages are aligned, we are considering upside score. Higher scores are assigned for slower moving averages and lower scores for faster moving averages to give more stress to long term trend.
Buy/Sell conditions are based on moving average crossover on the upside score sum of Loopback days.
This is a very rough idea which seems to have been working ok on long only trades. Can be further improved.
TrendRangeIdentifier V2This is the enhanced version of TrendRangeIdentifier:
Highlights of this version are:
Different ATR multiplier used based on trend.
Supertrend is used for trend bias for determining which ATR to use on which side
Crossover is based on option selected. It can be either high, low or close price which is determined by crossover type selected.
Remaining parameters remain same as that of original indicator.

LT Trend 2.0This is a short term trend based indicator which colours the bars blue and red indicating the probable trend: blue indicating the probable upward (or “bullish”) trend and red indicating the probable downward (or “bearish”) trend.
The first criteria (called “volatility trend) colours the bars (blue or red) based on one of the indicators which we use that measures momentum and the key support/resistance level. When price is closed above this level, the bars are coloured blue and when price closes below this level the price bars turn red. The purpose is to show the likely trends, swing in price and path of least resistance, specially in the short term (depending on the timeframe chosen).
The second criteria (optional) uses the average range of the last 7 bars (although the period can be changed by the user). It colours the bars blue or red based on the average range and momentum bias of the past 7 bars. In this respect, it is slower to react to the constant “noise” and volatility in the price action by smoothing out a lot of the noise (depending on which setting one has chosen e.g. period of default 7 or lower). If the volatility or range of the next bar exceeds the average range of the previous 7 bars in an opposite direction (e.g. opposite directional momentum), the colour of the bars may change. For example, if the previous bar has been blue, and the range of the next bar is greater than the average of the previous 7 bars in the downward direction, the colour of the bars could likely turn red. This second (optional) criteria can be chosen by deselecting (unticking) the “volatility trend” criteria in the settings.
The main idea behind the indicator is to be able to observe the probable short term trends in the price, and to smooth out a lot of the bar-by-bar (or candle-by-candle) volatility and up/down action. If the bars are blue, this is a potentially bullish sign, as it often means that “bulls” may have the edge. The reverse is the case for red bars, as it is a bearish sign – or that “bears” may have the edge. Usually 2 consecutive bars of the opposite colour can signify a potential trend change (although one bar of the opposite colour can also suffice).
The indicator also incorporates a “trend following pivot” – shown by a yellow dot. This indicator waits for a pullback (or retracement) to either the 21 and 34 EMA - shown by blue and pink EMA lines respectively - and when the price bounces off or “pulls away” from either of these EMAs by a certain degree, the indicator then shows the yellow trend following pivot as a yellow dot. For example, if price is in an uptrend, then price pulls back to the 21 or 34 EMA, and then bounces off either of these levels by a certain extent, we may then see a yellow dot (or pivot) at the lowest most recent point (which would then become support). The yellow dot (or pivot) can indicate that the uptrend could potentially continue, provided price remains above the pivot (yellow dot). Similarly, in a downtrend example, if price pulls back to either the 21 or 34 EMA, then price gets rejected from these levels by a certain extent (so that price then falls back below these EMAs again), we may see a yellow dot at the highest recent point (which would become resistance). The yellow dot (or pivot) can indicate that the downtrend could potentially continue provided price remains below the pivot (yellow dot).
The “ultra” overbought and oversold signal colours the bars orange when price hits an extreme “overbought” or “oversold” level. Usually the price tends to reverse direction or start a correction when it reaches an extreme “overbought” or “oversold” level. Of course, it is possible for the price to ignore overbought/oversold readings – and if the price ignores the orange “ultra” signal by continuing in its original direction, it can mean that the momentum or trend is stronger than originally anticipated. Often the orange “ultra” signal can also mean that it may be time to tighten stops (specially as the risk or probability of a pullback or reversal increases).
Chartists should be aware of the probabilistic and uncertain nature of price action and the markets, and therefore prepare to limit and control any potential risks.
The indicator can be used on the charts of the majority of markets (e.g. stocks, indices, ETFs, currencies, cryptocurrencies, precious metals, commodities etc.) and any timeframe. It should be noted that the degree of noise and randomness increases significantly on lower timeframes. So the lower the timeframe that is chosen (e.g. 15-min or lower) the greater the degree of noise and randomness and therefore the higher the frequency of false signals or whipsaws. The indicator can be applied to candlestick, bar, line, line break, range and renko charts.
If you would like access, please send me a PM on Tradingview.

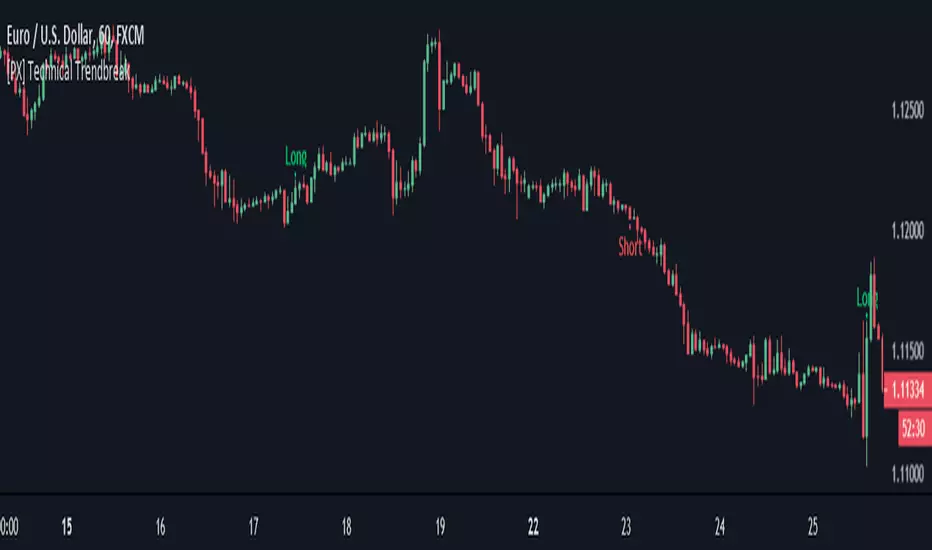
[PX] Technical TrendbreakThis script identifies a technical break of the current trend. Its shows when the swing point before the most recent extreme (high or low) is taken out. The indicator can help you to identify when the current trend is weakening or momentum is slowing down. It is not a standalone script, that you should use for automated trading. It works best when a clear trend is in progress and new extremes are made (such as all-time-high, all-time-low). It should be avoided for sideways movements.
The length parameter determines how many candles should be taken into consideration for calculation of the extremes.
If you are looking for someone to develop your own indicator or trading strategy, don't hesitate to get in touch with me here on TradingView or below.
Contact:
www.pascal-simon.de
info@pascal-simon.de
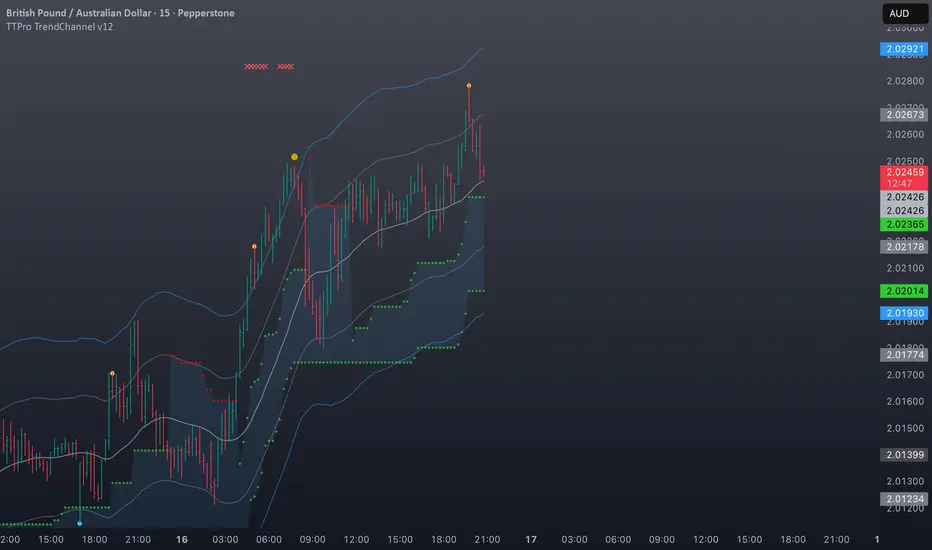
TTPro TrendChannel V12// TTPro TrendChannel is a shaded channel that clearly defines the trend. If price action is below the channel then trend is bearish.
// If candles are within the channel we have a ranging market, and if price action is above the channel, the trend is bullish. This indicator is useful for both range traders and trend trade
TTPro TrendChannel V11An update to V10 .. // TTPro TrendChannel V11 is a shaded channel that clearly defines the trend. If price action is below the channel then trend is bearish.
// If candles are within the channel we have a ranging market, and if price action is above the channel, the trend is bullish. This indicator is useful for both range traders and trend traders.

TTPro TrendChannel V10// TTPro TrendChannel is a shaded channel that clearly defines the trend. If price action is below the channel then trend is bearish.
// If candles are within the channel we have a ranging market, and if price action is above the channel, the trend is bullish. This indicator is useful for both range traders and trend traders.

Dragon Smart Timing (Trend Analysis)Introduction Dragon Smart Timing is a comprehensive "Clean Chart" trading system designed for trend followers who prefer a minimalist workspace. Instead of cluttering your chart with multiple moving averages and noisy signals, this indicator consolidates complex market data into a sleek, real-time Neon Dashboard.
The system identifies high-probability Pullback Entries within a strong trend and includes a built-in Trade Management Assistant to help you decide when to Hold, Take Profit, or Stop Loss.
1. 🛠 How It Works (The 4-Pillar Logic) The system scans for a specific "Confluence" of 4 conditions. An "Entry Now" signal is triggered only when ALL of the following are met:
Trend Filter (The Safety Guard): Price must be ABOVE the EMA 200. This ensures you only trade in the direction of the long-term trend, avoiding counter-trend risks.
Momentum Alignment: Short-term trends must be healthy (EMA 21 > EMA 50 > EMA 100).
Smart Pullback (RSI): RSI (14) must dip into the "Golden Zone" (40 - 55) and bounce upward. We buy the dip, not the top.
Volume Confirmation: Validates the move with a Volume Spike (> 1.5x Average Volume).
2. 🤖 Trade Management Assistant Unlike standard indicators that leave you guessing after the entry, Dragon Smart Timing tracks the trade for you:
🐲 Entry Now: Signal to open a long position.
✊ Holding...: The system recognizes an active trade and monitors price action.
💰 Take Profit: Triggered when the price closes below the EMA 21, signaling momentum weakness.
🛑 Stop Loss: Triggered if the price drops 7% below your entry price to protect capital.
3. 🖥 The Neon Dashboard
Trend: Displays "Strong Up", "Aligned", or "Below EMA200".
RSI / Vol: Shows real-time values without clutter.
Action: The most important row. It lights up in Neon Green (Entry), Orange (Take Profit), or Red (Stop Loss).
⚙️ Settings
Trend Filter: Adjustable EMA 200 (Turn it into EMA 89 or 100 depending on your style).
Dashboard: Fully customizable position (Top/Bottom/Center) and size to fit your screen.
Risk Parameters: Adjustable Stop Loss % and Volume Multipliers.
⚠️ Risk Disclaimer
This script is for educational purposes only and does not constitute financial advice. Trading involves a high degree of risk. Past performance is not indicative of future results.

KING Super Trend Hull (Multi MA)super trende ortalamalar eklendi. alexander ma degisken ortalama gibi..
