Extreme Trend Reversal Points [HeWhoMustNotBeNamed]Using moving average crossover for identifying the change in trend is very common. However, this method can give lots of false signals during the ranging markets. In this algorithm, we try to find the extreme trend by looking at fully aligned multi-level moving averages and only look at moving average crossover when market is in the extreme trend - either bullish or bearish. These points can mean long term downtrend or can also cause a small pullback before trend continuation. In this discussion, we will also check how to handle different scenarios.
🎲 Components
🎯 Recursive Multi Level Moving Averages
Multi level moving average here refers to applying moving average on top of base moving average on multiple levels. For example,
Level 1 SMA = SMA(source, length)
Level 2 SMA = SMA(Level 1 SMA, length)
Level 3 SMA = SMA(Level 2 SMA, length)
..
..
..
Level n SMA = SMA(Level (n-1) SMA, length)
In this script, user can select how many levels of moving averages need to be calculated. This is achieved through " recursive moving average " algorithm. Requirement for building such algorithm was initially raised by @loxx
While I was able to develop them in minimal code with the help of some of the existing libraries built on arrays and matrix , I also thought why not extend this to find something interesting.
Note that since we are using variable levels - we will not be able to plot all the levels of moving average. (This is because plotting cannot be done in the loop). Hence, we are using lines to display the latest moving average levels in front of the last candle. Lines are color coded in such a way that least numbered levels are greener and higher levels are redder.
🎯 Finding the trend and range
Strength of fully aligned moving average is calculated based on position of each level with respect to other levels.
For example, in a complete uptrend, we can find
source > L(1)MA > L(2)MA > L(3)MA ...... > L(n-1)MA > L(n)MA
Similarly in a complete downtrend, we can find
source < L(1)MA < L(2)MA < L(3)MA ...... < L(n-1)MA < L(n)MA
Hence, the strength of trend here is calculated based on relative positions of each levels. Due to this, value of strength can range from 0 to Level*(Level-1)/2
0 represents the complete downtrend
Level*(Level-1)/2 represents the complete uptrend.
Range and Extreme Range are calculated based on the percentile from median. The brackets are defined as per input parameters - Range Percentile and Extreme Range Percentile by using Percentile History as reference length.
Moving average plot is color coded to display the trend strength.
Green - Extreme Bullish
Lime - Bullish
Silver - range
Orange - Bearish
Red - Extreme Bearish
🎯 Finding the trend reversal
Possible trend reversals are when price crosses the moving average while in complete trend with all the moving averages fully aligned. Triangle marks are placed in such locations which can help observe the probable trend reversal points. But, there are possibilities of trend overriding these levels. An example of such thing, we can see here:
In order to overcome this problem, we can employ few techniques.
1. After the signal, wait for trend reversal (moving average plot color to turn silver) before placing your order.
2. Place stop orders on immediate pivot levels or support resistance points instead of opening market order. This way, we can also place an order in the direction of trend. Whichever side the price breaks out, will be the direction to trade.
3. Look for other confirmations such as extremely bullish and bearish candles before placing the orders.
🎯 An example of using stop orders
Let us take this scenario where there is a signal on possible reversal from complete uptrend.
Create a box joining high and low pivots at reasonable distance. You can also chose to add 1 ATR additional distance from pivots.
Use the top of the box as stop-entry for long and bottom as stop-entry for short. The other ends of the box can become stop-losses for each side.
After few bars, we can see that few more signals are plotted but, the price is still within the box. There are some candles which touched the top of the box. But, the candlestick patterns did not represent bullishness on those instances. If you have placed stop orders, these orders would have already filled in. In that case, just wait for position to hit either stop or target.
For bullish side, targets can be placed at certain risk reward levels. In this case, we just use 1:1 for bullish (trend side) and 1:1.5 for bearish side (reversal side)
In this case, price hit the target without any issue:
Wait for next reversal signal to appear before placing another order :)
Cari dalam skrip untuk "trend"

Auto Harmonic Pattern - UltimateX [Trendoscope]IMPORTANT NOTE: (Read this before looking at any other thing on this indicator)
This indicator is created to supersede existing Auto-Harmonic-Pattern-Ultimate-Trendoscope invite only script. The script deviates a lot from the original Auto Harmonic Patterns Ultimate script in terms of number of available patterns, trading type and few other things. Hence, instead of updating the existing script, we have just decided to release as new script. Few FAQs in this regard are as below
What it means for users of AHPU and new users?
▶ Subscription of this script is not sold separately, but will be offered along with existing AHPU script. Meaning, there will be single subscription for both scripts together.
▶ All existing subscribers of AHPU will also get access to this script for the duration of their subscription term. Will start adding access to users starting from lifetime subscribers first.
▶ Any new subscriptions to AHPU will also get access to both the scripts together. We will eventually look to phase out existing AHPU once users are accustomed to new script and any possible bugs are resolved.
▶ Any trial requests will also get access to both scripts. You can request trial even if you have recently requested trial for AHPU.
Why did we create new script instead of updating the existing one?
▶ As mentioned before, this script deviates a lot from the original AHPU. Hence, it is released as new version to make sure smoother transition of users. If anyone is not comfortable using the new version, they can continue using the existing AHPU script until things settle down.
▶ Since the script is new implementation, it may also have initial bugs. It will help us resolve it in more streamlined way.
What are the main differences between these scripts?
▶ Uses single zigzag instead of multi as algorithm is further improved to detect almost everything using single zigzag.
▶ More number of patterns added. But, new patterns are disabled by default as some of them have very wide PRZ. Users can enable it via settings.
▶ Trading type with trailing entry - With wide PRZs, we also had to implement different method for calculating entry/stop. This is explained later in the script.
▶ Matrix implementation and enhanced stats - Entire implementation is redesigned to use matrix data structure instead of arrays. This allows lots of possibilities including enhanced closed trade stats.
▶ Support/Resistance widget is removed as it is proving to be bit of overhead. Users can make use of Support Resistance widget script which is a free to use script instead.
Let's get to the details of indicator now.
🎲 Indicator Components
🎯 Patterns Covered
● Classic Patterns
Gartley
Bat
Butterfly
Crab
Deep Crab
Cypher
Shark
Nenstar
● Anti/Alternate Patterns
Anti Nenstar
Anti Shark
Anti Cypher
Anti Crab
Anti Butterfly
Anti Bat
Anti Gartley
Navarro200
● Non-Standard Patterns (Disabled by default)
Five Zero
Three Drives
White Swan
Black Swan
Sea Pony
Leonardo
121
Snorm
Total
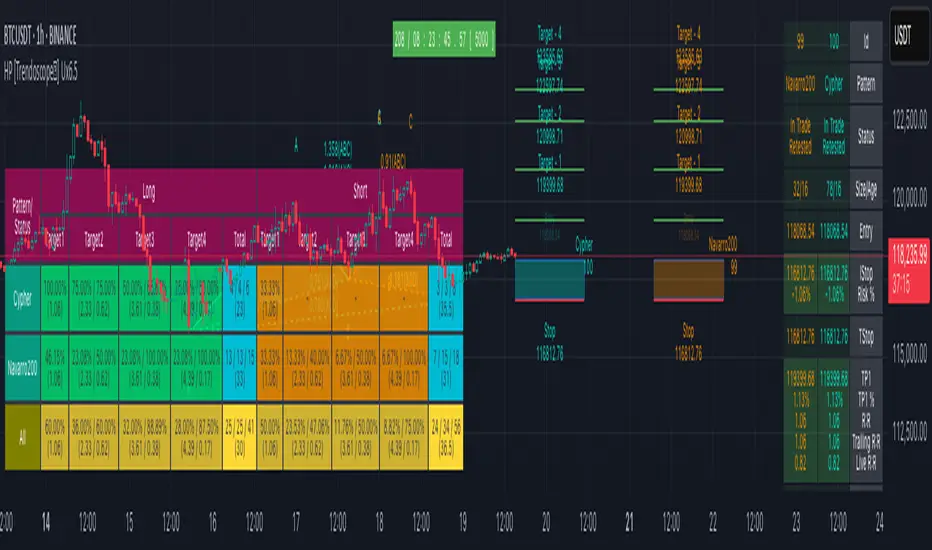
Below is a quick snapshot of indicator components.
Now, lets look at some of the individual components:
🎯 Open trade stats helps recognise trades in motion.
Apart from regular stats, it also contain different types of risk reward ratios.
Regular RR : RR calculated from entry to reach target with initial stop for risk consideration
Trailing RR : This is RR calculated for price to reach from one target to next target considering trailing stop for calculating risk
Live RR : This is calculated based on current price as entry and with given targets and stop levels. Live RR will be blank for targets which are already reached.
Targets are calculated only when entry is made. Hence, target details are not shown for patterns where it is still awaiting entry.
🎯 Closed trade stats helps understand historical performance of patterns.
By default closed stats are displayed in Compact mode. Which means, only total stats are shown. But, users can change this to show detailed stats via settings. Detailed stats take up entire screen most of the time. So, keep them only if it is required.
Closed stats present average Risk Reward, Trailing Risk Reward, Average Win Rate, and Average Trailing Win Rate for all the possible levels. As discussed before.
Regular RR : RR calculated from entry to reach target with initial stop for risk consideration
Trailing RR : This is RR calculated for price to reach from one target to next target considering trailing stop for calculating risk
Win Rate : Simple win rate calculation based on number of patterns reached target and number of valid patterns.
Trailing Win Rate : This is win rate calculated based on previous target to current target.
For example, if there are 48 valid patterns and out of which 24 patterns reach target1 and 12 patterns out of 24 reach target 2
Target1 WR : 50% (24/48)
Target1 TWR : Not applicable as there is no target before Target1
Target2 WR : 25% (12/48)
Target2 TWR : 50% (12/24)
🎲 Settings
Tooltips are provided to help with each and every settings. And they are as below.
🎲 Fully Customisable Alerts - Placeholders
Alerts are created via alert() method of pine. Hence, users will not see message box for alert template on alert widget.
Instead alerts widget look something like this:
To overcome this issue, script provides alert template placeholders as part of settings. In settings, you can already see Alert section where you can enable/disable alerts for different events.
▶ New Pattern Detection
▶ Entry Reached
▶ Target1-4 Reached
▶ Stop price reached
▶ Trade Complete - either by stop or reaching target 4
You can use following placeholders in the given text boxes to create your own alert template.
🎯 Common placeholders which are applicable for all alerts
{type} - Alert Type
- New Harmonic Pattern
- Harmonic Pattern Status Update
- Harmonic Pattern Trade Closure
{id} - Pattern Id. This is not fully unique id. But, this will be unique for all open trades. Once trade is closed, Ids are reused whenever feasible.
{ticker} - Ticker information
{timeframe} - Timeframe information
{price} - Current close price
{patterns} - Possible patterns for the projections or PRZ.
{direction} - Trade direction - Bullish or bearish
{entry} - Calculated entry for pattern
{stop} - Calculated stop for pattern
{tstop} - Trailing stop for the pattern in trade
{target1} - Target1 for pattern in trade
{target2} - Target2 for pattern in trade
{target3} - Target3 for pattern in trade
{target4} - Target4 for pattern in trade
🎯 There are few specific placeholders, which are applicable for some alert types.
Harmonic Pattern Status Update
{status} - Status of the Pattern in trade
{laststatus} - Previous status of the Pattern in trade
Harmonic Pattern Trade Closure
{result} - Trade result upon closure
Skrip berbayar
Auto Harmonic Projection - Ultimate [Trendoscope]Hello traders, Many who used Auto Harmonic Pattern - Ultimate had enquired with me about having option to project PRZ before patterns formed. We always replied that it is in pipeline but will not be part of existing script. Finally, we decided to utilise part of our Christmas and new year break to make it happen.
Lets get started..
⬜ Process
▶ Unlike Auto Harmonic Patterns Ultimate, instead of scanning whole XABCD for harmonic pattern, this script only collects XABC and projects PRZs (Possible D zones)
▶ Once possible patterns are found, lines are drawn to connect XABC and boxes to project PRZs. There can be more than 1 PRZs for XABC combination. If PRZs of multiple patterns overlap, they are joined and shown as single PRZ where all patterns are listed against it.
▶ If price crosses C, pattern is considered as failed. If price stays between C and PRZs for long time, patterns are timed out. In either case, patterns and projections are removed from chart.
▶ Pattern is considered to be active once price reach B. Until then Pattern is inactive.
▶ PRZs are tracked individually even if they belong to same pattern. PRZ is considered active only if price hits PRZ and completes the pattern. Till then PRZ is considered inactive.
▶ After activating, PRZs can either reach successful level if price moves in reversal direction. Or it can reach failure if price reaches stop.
▶ PRZs are removed from chart once it either reaches stop or success level. But, if more PRZs are present for pattern, pattern will still be there on chart.
▶ Pattern is kept active till all the PRZs are either hit stop or success or pattern itself is either failed or timed out.
Note:
Whenever we refer pattern - consider it as lines joining X, A, B, C and D if PRZ is active.
Wherever we refer PRZ - consider it as box representing potential reversal zones.
⬜ Screen components
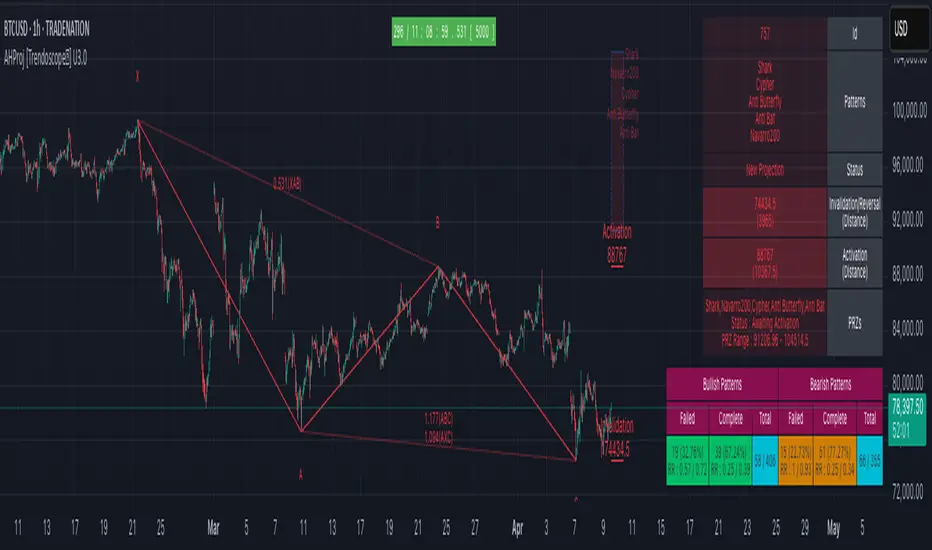
▶ Inactive Patterns and PRZ - Patterns with inactive PRZs are represented as lines joining XABC. There will not be line connecting D and PRZs are shown with faded colour and smaller fonts.
▶ Active Patterns and PRZ - Patterns with active PRZ are represented with full pattern and line fills. PRZ will also show stop and success level. Note that success level is not target level - but a position used for validating the outcome.
▶ Stats table - Open stats table contains patterns and corresponding PRZ levels. Stats will have red background for bearish patterns/projections and green background for bullish patterns/projections. Content text colour is matched with that of PRZ and Pattern line colors so that users can identify the matching stats easily.
▶ Run timer - Tells how long the script backtest is running. Run timer will have red background for TRIAL access or if right access key is not used. Otherwise, it will have green background colour. This does not have much significance now as there are no closed stats available. It will be added in the future versions.
▶ Watermark - Watermark appears only if valid key is not used or TRIAL access key is used.
Bit more details about open stats table here
⬜ Settings
⚪ Alert Key
Alert key is given for active subscribers. This key is required in order to set alerts or in order to run the script for more than 30 bars on single instrument without interruption. Not having alert key will not stop users from using the indicator once they acquire access - but it will only limit few capabilities. Key is not given for trial access.
Key is prompted every time users add indicator to chart. If you are provided with key, please use it instead of the TRIAL access key.
If you are using valid key,
You will see run timer in green instead of red background
No TRIAL ACCESS watermark on the chart.
⚪ Zigzag and pattern detection settings
⚪ Pattern Selection settings
⚪ Stats and Display
⚪ Colors and themes
⚪ Backtest Settings
Not important for now as there are no closed pattern stats. Kept for future usage. Will impact the timer widget.
⚪ Alerts
▶ Types and settings
▶Setting alerts is simple. When indicator is loaded on chart (Make sure you are using the right alert key), goto alerts and select the AHProjection from Condition dropdown. Update other parameters such as alert name, webhook details as required and press create
▶ Examples of alerts
⬜ Status Tracking
Script tracks two types of statuses.
⚪ Harmonic Pattern Projection Status : Tracks projection as a whole for each combination of X, A, B, C. Different states available are
Awaiting Activation : Any pattern projection when formed by default goes into Inactive State and hence set to Awaiting Activation.
Projection Active : Once price reach B, then pattern projection is considered active
Entry Reached : Once price reach the nearest PRZ level, it is considered as Entry reached. Status will remain as entry reached even if PRZ is removed and next PRZ level is yet to be reached.
Projection Invalidated : If price goes beyond C level, then pattern projection is considered invalidated. It can happen at any stage and even after successful completion of few PRZ ranges.
Projection Timed Out : If price keeps between PRZ and C for considerable time, it will timed out and removed from chart.
⚪ Harmonic Pattern Projection PRZ Status Tracks individual PRZs separately which may or may not belong to same patterns. Different states available are
Awaiting Activation : Any PRZ is considered inactive before price reaching the PRZ level.
Active : Once price reaches PRZ, it will become active. Active PRZs are highlighted with line fill on chart. Active PRZ also display success and stop levels. PRZ is not removed unless price hits one of these levels or the entire pattern is timed out.
Successful : If an active PRZ price reaches success level, then PRZ projection is considered successful. Once successful, PRZ will removed from chart
Failed : If an active PRZ price reaches stop level, then PRZ projection is considered failure. Once failed PRZ will be removed from chart.
Skrip berbayar
Multi-ZigZag Multi-Oscillator Trend DetectorThis table is intended to give you snapshot of how price and oscillators are moving along with zigzag pivots.
This is done in the same lines of Zigzag-Trend-Divergence-Detector
But, here are the differences
Table shows multiple oscillator movements at a same time instead of one selected oscillator
Divergence is not calculated and also supertrend based trend. Trend can be calculated based on zigzag movements. However, lets keep this for future enhancements.
This system also uses multiple zigzags instead of just one.
⬜ Process
▶ Derive multiple zigzags - Code is taken from Multi-ZigZag
▶ Along with zigzags - also calculate different oscillators and attach it to zigzag pivot.
▶ Calculate directions of zigzag pivots and corresponding oscillators.
▶ Plot everything in the table on last bar.
⬜ Table components
Table contains following data:
Directional legends are:
⇈ - Higher High (Green)
⇊ - Lower Low (Red)
⭡- Lower High (Orange)
⭣ - Higher Low (Lime)
⬜ Input Parameters
▶ Source : Default is close. If Unchecked - uses high/low data for calculating pivots. Can also use external input such as OBV
▶ Stats : Gives option to select the depth of output (History) and also lets you chose text size and table position.
▶ Oscillators : Oscillator length is derived by multiplying multiplier to zigzag length. For example, for zigzag 5, with 4 as multiplier, all oscillators are calculated with length 20. But, same for zigzag 8 will be 32 and so on.
▶ Available oscillators :
CCI - Commodity Channel Index
CMO - Chande Momentum Oscillator
COG - Center Of Gravity
MFI - Money Flow Index (Shows only if volume is present)
MOM - Momentum oscillator
ROC - Rate Of Change
RSI - Relative Strength Index
TSI - Total Strength Index
WPR - William Percent R
BB - Bollinger Percent B
KC - Keltner Channel Percent K
DC - Donchian Channel Percent D
ADC - Adoptive Donchian Channel Percent D ( Adoptive-Donchian-Channel )
⬜ Challenges
There are 12 oscillators and each zigzag has different length. Which means, there are 48 combinations of the ocillators.
First challenge was generating these values without creating lots of static initialization. Also, note, if the functions are not called on each bar, then they will not yield correct result. This is achieved through initializer function which runs on every bar and stores the oscillator values in an array which emulates multi dimensional array oscillator X zigzag length.
Next challenge was getting these values within function when we need it. While doing so I realized that values stored in array also have historical series and calling array.get will actully get you the entire series and not just the value. This is an important takeaway for me and this can be used for further complex implementations.
Thanks to @LonesomeTheBlue and @LucF for some timely suggestions and interesting technical discussions :)

Zigzag Trend/Divergence DetectorPullbacks are always hardest part of the trade and when it happen, we struggle to make decision on whether to continue the trade and wait for recovery or cut losses. Similarly, when an instrument is trending well, it is often difficult decision to make if we want to take some profit off the table. This indicator is aimed to make these decisions easier by providing a combined opinion of sentiment based on trend and possible divergence.
⬜ Process
▶ Use any indicator to find trend bias. Here we are using simple supertrend
▶ Use any oscillator. I have added few inbuilt oscillators as option. Default used is RSI.
▶ Find divergence by using zigzag to detect pivot high/low of price and observing indicator movement difference between subsequent pivots in the same direction.
▶ Combine divregence type, divergence bias and trend bias to derive overall sentiment.
Complete details of all the possible combinations are present here along with table legend
⬜Chart Legend
C - Continuation
D - Divergence
H - Hidden Divergence
I - Indeterminate
⬜ Settings
▶ Zigzag parameters : These let you chose zigzag properties. If you check "Use confirmed pivots", then unconfirmed pivot will be ignored in the table and in the chart
▶ Oscillator parameters : Lets you select different oscillators and settings. Available oscillators involve
CCI - Commodity Channel Index
CMO - Chande Momentum Oscillator
COG - Center Of Gravity
DMI - Directional Movement Index (Only ADX is used here)
MACD - Moving average convergence divergence (Can chose either histogram or MACD line)
MFI - Money Flow Index
MOM - Momentum oscillator
ROC - Rate Of Change
RSI - Relative Strength Index
TSI - Total Strength Index
WPR - William Percent R
BB - Bollinger Percent B
KC - Keltner Channel Percent K
DC - Donchian Channel Percent D
ADC - Adoptive Donchian Channel Percent D ( Adoptive-Donchian-Channel )
▶ Trend bias : Supertrend is used for trend bias. Coloring option color candles in the direction of supertrend. More option for trend bias can be added in future.
▶ Stats : Enables you to display history in tabular format.
Overview of settings present here:
⬜ Notes
Trend detection is done only with respect to previous pivot in the same direction. Hence, if chart has too many zigzags in short period, try increasing the zigzag length or chart timeframe. Similarly, if there is a steep trend, use lower timeframe charts to dig further.
Oscillators does not always make pivots at same bar as price. Due to this some the divergence calculation may not be correct. Hence visual inspection is always recommended.
⬜ Possible future enhancements
More options for trend bias
Enhance divergence calculation. Possible options include using oscillator based zigzag as primary or using close prices based zigzag instead of high/low.
Multi level zigzag option - Can be messy to include more than one zigzag. Option can be added to chose either Level1 or Level2 zigzags.
Alerts - Alerts can only be added for confirmed pivots - otherwise it will generate too many unwanted alerts. Will think about it :)
If I get time, I will try to make a video.

Breakout Trend Trading Strategy - V2This is an alternate version of Breakout Trend Trading Strategy - V1
Only difference is, this strategy places stop orders based on calculated targets whereas V1 waits for price to close target levels and then places market orders. Hence, you will receive the target prices before trade executes in strategy.
Parameters are same as that of Breakout Trend Trading Strategy - V1
There is one additional parameter on Trade Type - which permits user to allow only breakout, pullback or reverse trading or combination of all.
Backtesting parameters remain same :
Capital and position sizing : Capital and position sizing parameters are set to test investing 2000 wholly on certain stock without compounding.
Initial Capital : 2000
Order Size : 100% of equity
Pyramiding : 1
Test cases remain same :
Positive : AAPL , AMZN , TSLA , RUN, VRT , ASX:APT
Negative Test Cases: WPL , WHC , NHC , WOW, COL, NAB (All ASX stocks)
Special test case: WDI
Negative test cases still show losses in back-testing. I have attempted including many conditions to eliminate or reduce the loss. But, further efforts has resulted in reduction in profits in positive cases as well. Still experimenting. Will update whenever I find improvements. Comments and suggestions welcome :)

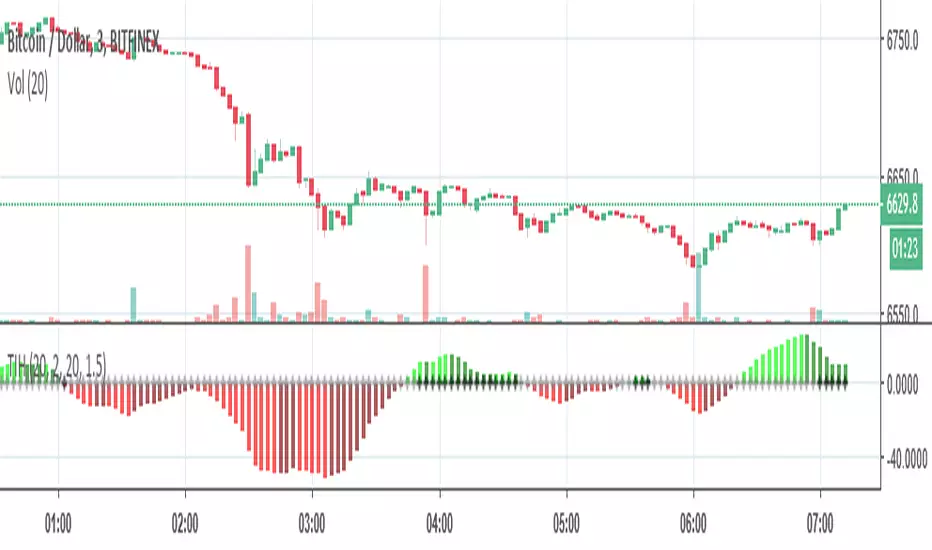
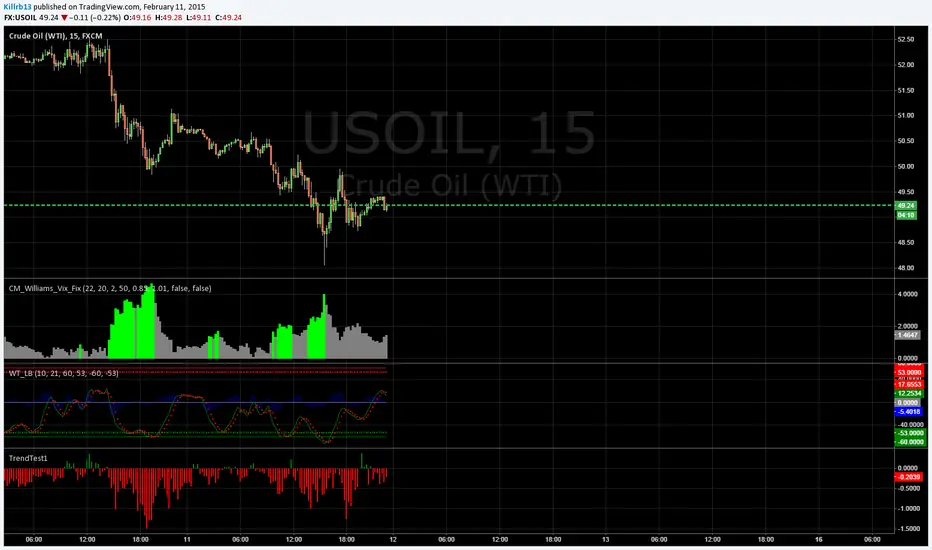
Trend Indicator in Histogramtrend indicator in histogram lets you know if its up trending or down trending.
Trend Confirmation Dow TheoryTrend Confirmation as per Dow Theory
Summary of Logic:
✅ Bullish Trend:
Setup Bar: High > Previous High AND Low ≥ Previous Low
Confirmation Bar: High > Highest High of last 3 candles, Low ≥ Setup Bar Low
Trend Continues Until: Latest candle breaks 2nd last candle’s low → then trend becomes Bearish
🔻 Bearish Trend:
Setup Bar: Low < Previous Low AND High ≤ Previous High
Confirmation Bar: Low < Lowest Low of last 3 candles, High ≤ Setup Bar High
Trend Continues Until: Latest candle breaks 2nd last candle’s high → then trend becomes Bullish
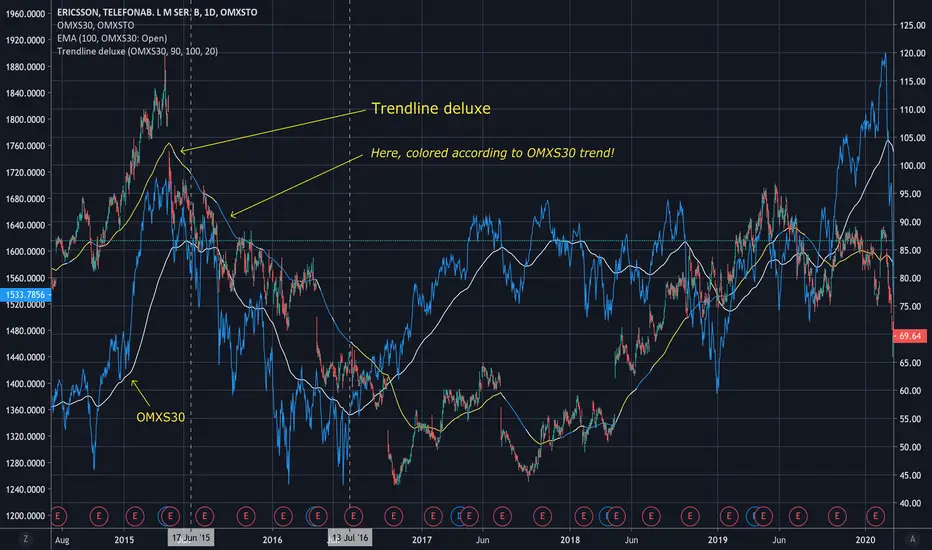
Trendline deluxeTrendline deluxe
As someone said:
"The best trend indicator is when you print the chart, put it on the wall
and take a few steps back. If you now can identify the trend you're done!"
This is an attempt of doing the same thing...
I find it handy to switch the color of the trendline depending on the where
the Trend is going. Especially when zooming in on the chart, the color tells
you what the overall Trend is.
Trendline deluxe comes with an extra twist in that it can be colored according
to your Stock index of choice, but still be plotted according to the Stock at hand.
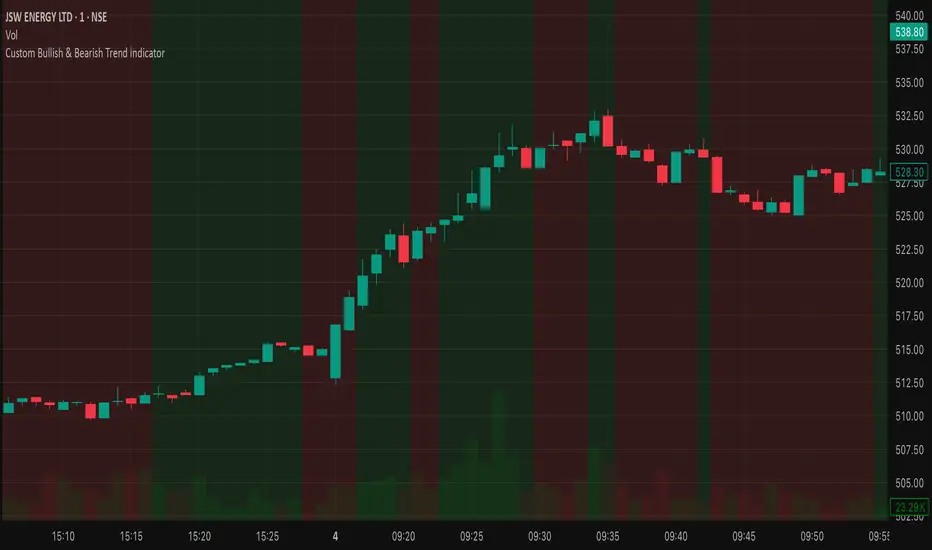
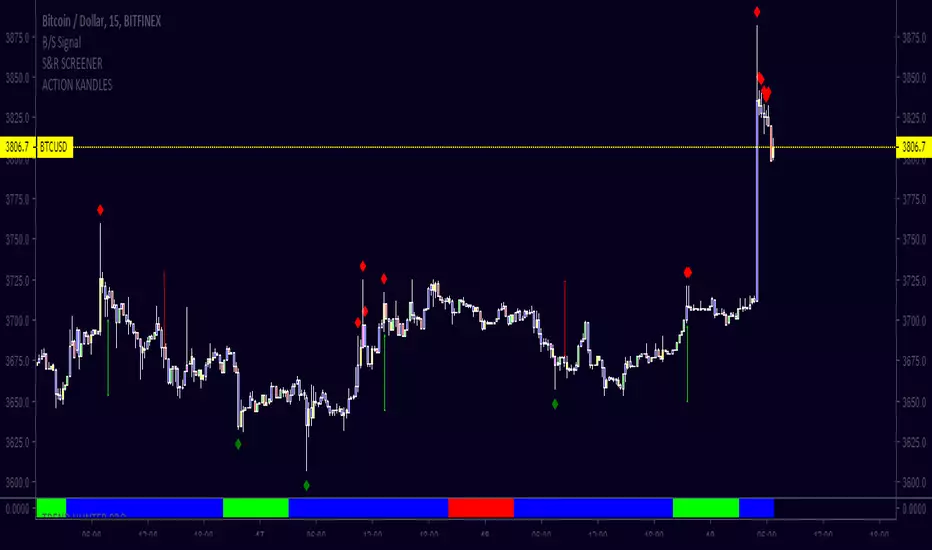
TREND HUNTER PROTrend trading is a trading strategy that attempts to capture gains through the analysis of a security's momentum in a particular direction. Trend traders enter into a long position when a security is trending upward (LIME COLOR) and/or enter a short position when a security is trending lowerRED COLOR).
Trend Quality Score (Options-Friendly)Trend Quality Score for options entry that signals with background coloring for good movement or chop, to avoid theta burn. Toggle for conservative, balanced or aggressive with triggers.

Trend Regime Bias v1.0Trend Regime Bias is a visual trading overlay that helps you instantly identify the current market environment so you can apply the right strategy at the right time. It highlights four distinct phases of market behavior using subtle background color cues and a floating strategy label:
🟢 Weak Trend (Reversal Mode): Favor reversal setups like traps, divergences, and fades.
💚 Growing Strength (Watch Mode): Trend may be forming — stay patient and alert.
🔵 Strong Trend (Trend Mode): Use trend-following strategies like pullbacks or breakouts.
🔷 Weakening Trend (Exhaustion Mode): Trend is losing strength — tighten stops or consider fading extremes.
This tool is ideal for day traders and swing traders who switch between mean reversion and trend continuation setups. By visually identifying the strength and phase of the trend, you avoid trading against the current regime and reduce emotional or impulsive decisions.
Use it as a bias filter, entry confirmation, or a "do-not-trade" warning system depending on your trading style.
No inputs or settings require adjustment unless you prefer to customize the zone thresholds, background colors, or ADX timeframe.

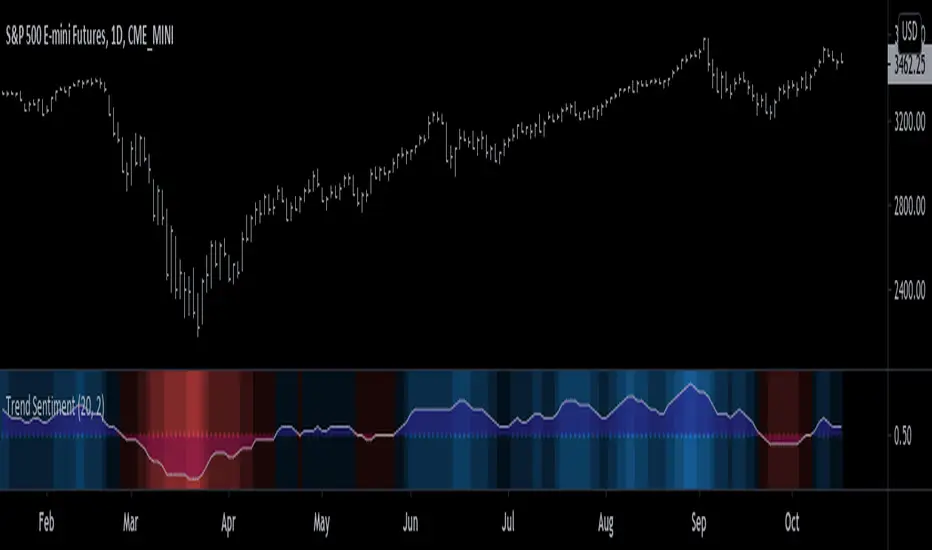
Trend Sentiment [racer8]Trend Sentiment is a trend indicator with enhanced graphics, that is, it has many different shades of blue and red.
The brighter the blue, the more bullish.
The brighter the red, the more bearish.
It is a simple indicator with a basic formula:
a = close > prev.close? ---> If yes, a = 1, otherwise a = 0.
b = sma of a over n periods -----1st parameter, n...."Length"
c = sma of b over j periods ----- 2nd parmeter, j..."Smoothing"
plot (c)
Is c > 0.5? ---> If yes, background color = blue, otherwise red.
plot background color.
plot 0.5 as dotted midline.
The Trend Sentiment value represents the percentage of bullish force in the market.
Signals are generated when it crosses the 50% mark.
Values above 0.50 are bullish and values below 0.50 are bearish.
Enjoy and hit the like button :)
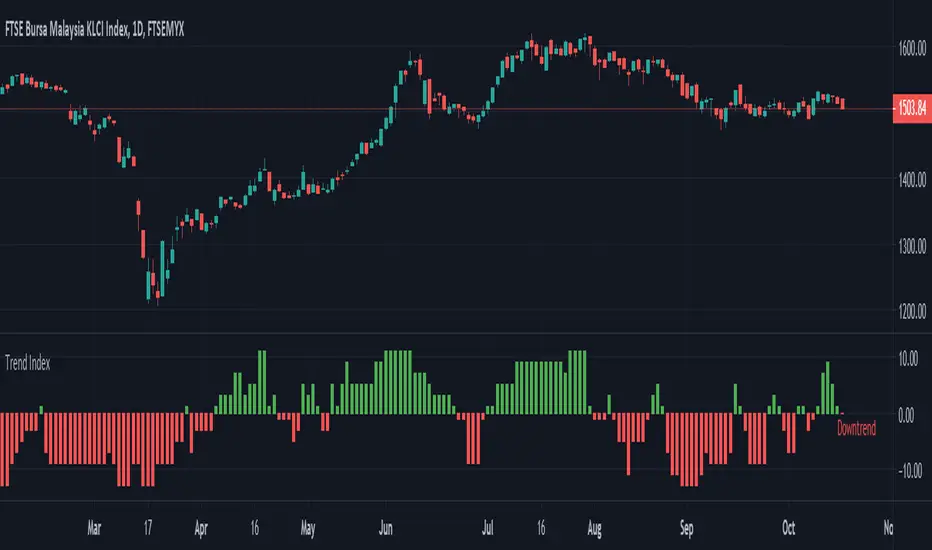
Trend Index Trend Index show trend of the instrument based on multiple indicators
- Green --> Uptrend
- Red --> Downtrend
- Gray --> No trend
Indicators used:-
Relative Strength Index (RSI)
Commodity Channel Index (CCI)
William Percent Range (WPR)
Directional Movement Index (DMI)
Elder Force Index (EFI)
Momentum
Demarker
Parabolic SAR

Trend Overlay 2 [SSTEAM]- Trend Overlay
- Kelner channels
- EMA 100
this indicator helps to detect elliot waves, and trend.

Tight Entry Trend Engine Strategy═══════════════════════════════════════
TIGHT ENTRY TREND ENGINE
═══════════════════════════════════════
A breakout-based trend-following system designed to capture explosive
moves by entering at precise resistance/support breakouts with minimal
entry risk and massive profit potential.
⚠️ LOW WIN RATE, HIGH REWARD SYSTEM ⚠️
This is NOT a high win-rate strategy. Expect 25-35% winners, but
when it hits, winners are typically 10X+ larger than losers.
═══════════════════════════════════════
🎯 WHAT THIS SYSTEM DOES
═══════════════════════════════════════
The Tight Entry Trend Engine identifies powerful breakout opportunities
by detecting when price breaks through established trendlines with
confirmation from higher timeframe trends:
1. DYNAMIC TRENDLINE DETECTION (3 BANKS)
• Automatically draws support and resistance trendlines
• 3 separate "banks" capture short-term, medium-term, and long-term levels
• Each bank has configurable parameters (required pivot touch count,
angle limits, lengths)
2. BREAKOUT ENTRY TIMING
• Enters LONG when price breaks ABOVE resistance trendlines
• Enters SHORT when price breaks BELOW support trendlines
• Entry Alert occurs at the exact moment of breakout = "tight entry"
• Stop-loss placed just below/above the broken trendline (configurable)
3. HIGHER TIMEFRAME TREND FILTER
• Uses Hull Moving Average (HMA) on higher timeframe for trend following
• Auto-adjusts HTF based on your chart timeframe
• Optional filters prevent entries against major trend
• Optional "overextension" filter avoids buying parabolic moves
4. VOLATILITY-ADAPTIVE RISK MANAGEMENT
• Stop-loss calculated using Average True Range (ATR)
• Tighter stops = better R:R
• Profit targets adjust dynamically with volatility
• Breakeven stop moves automatically when in profit
• Extended profit targets when far from HTF trend
═══════════════════════════════════════
📊 HOW IT WORKS (METHODOLOGY)
═══════════════════════════════════════
STEP 1: TRENDLINE FORMATION
The system continuously scans for pivot highs and pivot lows to
construct trendlines. You control:
BANK 1 (Short-Term):
- Pivot Length: How many bars to look back for swing points
- Min Touches: How many pivots needed to form a line (default: 3)
- Max Length: How far back lines can reach (default: 180 bars)
- Angle Limits: Maximum steepness allowed for valid trendlines
- Tolerance: How close pivots must align to form horizontal lines
BANK 2 (Medium-Term):
- Slightly longer pivot periods for more significant levels
- Captures medium-term trend structure
- Default Max Length: 200 bars
BANK 3 (Long-Term):
- Focuses on major support/resistance zones
- Often uses horizontal levels (angled lines disabled by default)
- Default Max Length: 300 bars
The system draws RESISTANCE lines (red) above price and SUPPORT
lines (green) below price. These adapt in real-time as new pivots form.
STEP 2: BREAKOUT DETECTION
LONG SIGNALS:
- Price closes above a resistance trendline
- Higher timeframe trend is up (optional filter)
- Price not overextended from HTF trend (optional filter)
- No position currently open
SHORT SIGNALS:
- Price closes below a support trendline
- Higher timeframe trend is down (optional filter)
- Price not overextended from HTF trend (optional filter)
- No position currently open
The "tight" aspect: Because you're entering right at the trendline
break, your stop-loss can be placed very close (just below the
broken resistance for longs), creating exceptional risk/reward ratios.
STEP 3: POSITION SIZING
Choose between:
- Fixed $ Risk Per Trade: Risk same dollar amount every trade
- % Risk Per Trade: Risk percentage of current equity
Position size automatically calculated based on:
- Your risk amount
- Distance to stop-loss (ATR-based)
- Works with stocks, futures, crypto (auto-adjusts for contract multipliers)
STEP 4: EXIT MANAGEMENT
Multiple exit methods working together:
- PROFIT TARGET: Exits when profit reaches 100x your risk
- EXTENDED PROFIT: Earlier exit (80R) when very far from HTF trend
- STOP LOSS: Fixed ATR-based stop below entry
- HTF TREND EXIT: Exits when price crosses below HTF trend with profit
- BREAKEVEN PULLBACK: Exits if profit drops below 0.6R after reaching breakeven
- PARTIAL PROFITS: Optional - take partial profits at specified R-multiple
═══════════════════════════════════════
🔧 KEY COMPONENTS EXPLAINED
═══════════════════════════════════════
HULL MOVING AVERAGE (HMA)
A smoothed moving average that reduces lag compared to traditional
MAs. The system uses HMA on a higher timeframe to determine the
dominant trend direction. You can choose:
- Auto HTF: System picks appropriate HTF based on your chart timeframe
- Manual HTF: You specify the higher timeframe
AVERAGE TRUE RANGE (ATR)
Measures current market volatility. Used for:
- Stop-loss distance (tighter when volatility low)
- Profit targets (larger when volatility high)
- Position sizing (smaller positions in volatile conditions)
- Breakeven trigger distance
TRENDLINE ANGLE FILTERING
Each trendline bank has angle limits to ensure quality:
- Resistance lines: Max downward/upward slope allowed
- Support lines: Max downward/upward slope allowed
- Angles automatically adjust based on current volatility
- Prevents overly steep/unreliable trendlines
SENSITIVITY CONTROL
One master slider adjusts multiple parameters:
- Trendline detection sensitivity
- HTF MA length
- Exit timing
- Auto-adjusts for daily+ timeframes (60% increase)
═══════════════════════════════════════
⚙️ WHAT YOU SEE ON YOUR CHART
═══════════════════════════════════════
TRENDLINES:
✓ Red resistance lines above price
✓ Green support lines below price
✓ Orange broken lines (past breakouts)
✓ Lines extend to show current levels
HTF TREND:
✓ Thick colored line showing higher timeframe trend
✓ Color gradient: Red (bearish) → Orange → Yellow → Green (bullish)
✓ 250-bar smoothed curve for visual clarity
ENTRY/EXIT SIGNALS:
✓ Small green dot below bar = Long entry
✓ Small red dot above bar = Short entry
✓ Small red dot above = Long exit
✓ Small black dot below = Short exit
OPTIONAL DETAILED LABELS:
✓ Bank number that triggered entry (Bank 1, 2, or 3)
✓ Exit reason (Profit Target, Stop Loss, HTF Exit, etc.)
✓ Partial profit notifications
POSITION TRACKING:
✓ Yellow dashed line at entry price (extends right)
✓ Green/red fill showing current profit/loss zone
✓ Lime arrows at top = Currently in long position
✓ Red arrows at bottom = Currently in short position
✓ Gray background = No position (flat)
STATS TABLE (Top Right):
✓ Current position (LONG/SHORT/FLAT)
✓ Risk per trade ($ or %)
✓ Entry price
✓ Unrealized P/L in dollars
✓ P/L in R-multiples (how many R's profit/loss)
✓ Average winner/loser R ($ mode) OR CAGR (% mode)
═══════════════════════════════════════
📈 OPTIMAL USAGE
═══════════════════════════════════════
BEST ASSETS:
- NASDAQ:QQQ on 1-hour (reg) chart ⭐ (PRIMARY OPTIMIZATION)
- Strong trending stocks: NVDA, AAPL, TSLA, MSFT, GOOGL, AMZN
- High volatility tech stocks
- Crypto: BTC, ETH
- Any liquid asset with clear trends and momentum (GOLD)
AVOID:
- Low volatility stocks
- Ranging/choppy markets
- Penny stocks or illiquid assets
- Assets without clear directional movement
BEST TIMEFRAMES:
- PRIMARY: 1-hour charts (optimal for QQQ)
- ALSO EXCELLENT: 2H, 4H, 8H
- WORKS: 15min, 30min (only momentum leaders, more noise)
- WORKS WITH ADJUSTMENTS: 1D, 2D (decrease trendline pivot lengths)
═══════════════════════════════════════
📊 BACKTEST RESULTS (QQQ 1H (Reg hours), 1999-2024)
═══════════════════════════════════════
The system showed on NASDAQ:QQQ 1-hour timeframe (regular hours):
- Total Return: 1,100,000%+ over 24 years
- Total Trades: 500+
- Win Rate: ~20-24% (LOW - this is by design!)
- Average Winner: 8-15% gain
- Average Loser: 2-4% loss
- Win/Loss Ratio: 10:1 (winners much bigger than losers)
- Profit Factor: 3+
- Max Drawdown: 45-50%
- Risk per trade: 3% of capital
KEY INSIGHT: This is a LOW WIN RATE, HIGH REWARD system. You will
lose more trades than you win, but the few winners are so large
they more than compensate for many small losses.
IMPORTANT: These are backtested results using optimal parameters
on historical data. Real trading results will vary based on:
- Your execution and timing
- Slippage and commissions
- Your emotional discipline
- Market conditions during your trading period
═══════════════════════════════════════
🎓 WHO IS THIS FOR?
═══════════════════════════════════════
IDEAL FOR:
✓ Swing traders comfortable holding winners for longer period
✓ Part-time traders (1H = check 2-3x per day)
✓ Traders seeking exceptional risk/reward ratios
✓ Those comfortable with low win rates if winners are huge
✓ Technical analysis enthusiasts
✓ Breakout traders
✓ Trend followers
═══════════════════════════════════════
🚀 GETTING STARTED - STEP BY STEP
═══════════════════════════════════════
STEP 1: APPLY TO YOUR CHART
- Search "Tight Entry Trend Engine" in indicators
- Click to apply to your chart
- Trendlines and HTF line will appear immediately
STEP 2: CHOOSE YOUR SETTINGS
For BEGINNERS - Use These Settings First:
1. Trade Direction & Filters:
• ENABLE LONGS: ✓ ON
• ENABLE SHORTS: ✗ OFF (start with longs only)
• Sensitivity: 1.0 (default)
• HTF Trend Entry Filter: ✓ ON (safer entries)
• Block Entries When Overextended: ✓ ON (avoid parabolic tops)
2. Position Sizing & Risk:
• Position Sizing: "Per Risk"
• RISK Type: "$ Per Trade"
• Risk Amount: $200 (or 1-3% of your account)
3. Visual Settings:
• Show Support Lines: ✗ OFF (unless trading shorts)
• Show Detailed Entry/Exit Labels: ✓ ON
• Show Stats Table: ✓ ON
• Show Entry Line & P/L Fill: ✓ ON
4. Leave everything else at DEFAULT for now
STEP 3: UNDERSTAND WHAT YOU SEE
When trendlines appear:
- RED lines above = Resistance (watch for price breaking UP through these)
- GREEN lines below = Support (watch for price breaking DOWN)
- When price breaks a red line = Potential LONG entry
- When price breaks a green line = Potential SHORT entry
The HTF trend line (thick colored):
- Green/lime = Strong uptrend (favorable for longs)
- Red = Strong downtrend (favorable for shorts if enabled)
- Orange/yellow = Transitioning
STEP 4: OBSERVE SIGNALS
- Small GREEN dot below bar = System entered LONG
- Small RED dot above bar = System exited LONG
- Check the label to see which "Bank" triggered (Bank 1, 2, or 3)
- Watch the yellow entry line and colored fill show your P/L
STEP 5: PAPER TRADE FIRST
- Use TradingView's paper trading feature
- Watch how signals perform on YOUR chosen asset
- Understand the win rate will be LOW (20-35%)
- Verify that winners are indeed much larger than losers
- Test for at least 20-30 signals before going live
STEP 6: OPTIMIZE FOR YOUR ASSET (OPTIONAL)
If default settings aren't working well:
For FASTER signals (more trades):
- Reduce Pivot Length 1 to 3-4
- Reduce Max Length 1 to 120-150
- Increase Sensitivity to 1.2-1.5
For SLOWER signals (higher quality):
- Increase Pivot Length 1 to 7-10
- Increase Max Length 1 to 250+
- Decrease Sensitivity to 0.7-0.9
For DAILY timeframes:
- Increase all Pivot Lengths by 30-50%
- Increase all Max Lengths significantly
- Sensitivity: 0.6-0.8
═══════════════════════════════════════
⚙️ ADVANCED SETTINGS EXPLAINED
═══════════════════════════════════════
TRENDLINE BANK SETTINGS:
Each bank (1, 2, 3) has these parameters:
- Min Touches: Minimum pivots to form a line
- Lower (2) = More lines, earlier detection
- Higher (4+) = Fewer lines, higher quality
- Pivot Length: Lookback for swing points
- Lower (3-5) = Reacts to recent price action
- Higher (10+) = Only major swing points
- Max Length: How old a trendline can be
- Shorter (100-150) = Only recent lines
- Longer (300+) = Include historical levels
- Tolerance: Alignment strictness for horizontal lines
- Lower (3.0-3.5) = Very strict horizontal
- Higher (4.5+) = More forgiving alignment
- Allow Angled Lines: Enable diagonal trendlines
- ON = Catches sloped support/resistance
- OFF = Only horizontal levels
- Angle Limits: Maximum steepness allowed
- Lower (1-2) = Only gentle slopes
- Higher (4-6) = Accept steeper angles
- Automatically adjusts for volatility
ATR MULTIPLIERS:
- STOP LOSS ATR (0.6): Distance to stop-loss
- Lower (0.4-0.5) = Tighter stops, stopped out more
- Higher (0.8-1.0) = Wider stops, more room
- PROFIT TARGET ATR (100): Main profit target
- This is 100x your risk = 10,000% R:R
- Lower (50-80) = Take profits sooner
- Higher (120+) = Let winners run longer
- BREAKEVEN ATR (40): When to move stop to breakeven
- Lower (20-30) = Protect profits earlier
- Higher (60+) = Give more room before protecting
HIGHER TIMEFRAME:
- Auto HTF: Automatically selects appropriate HTF
- 5min chart → uses 2H
- 15-30min → uses 6H
- 1-4H → uses 2D
- Daily → uses 4D
- HTF MA Length (300): HMA period for trend
- Lower (150-250) = More responsive
- Higher (400-500) = Smoother, less whipsaw
- HTF Trend Following Exit: Exits when crossing HTF
- ON = Additional exit method
- OFF = Rely only on profit targets/stops
- HTF Trend Entry Filter: Only trade with HTF trend
- ON = Safer, fewer signals
- OFF = More aggressive, more signals
- Block Entries When Overextended: Prevents chasing
- ON = Avoids parabolic tops/bottoms
- OFF = Enter all breakouts regardless
═══════════════════════════════════════
💡 TRADING PHILOSOPHY & EXPECTATIONS
═══════════════════════════════════════
This system is built on one core principle:
"ACCEPT SMALL, FREQUENT LOSSES TO CAPTURE RARE, MASSIVE WINS"
What this means:
- You WILL lose 65%-75% of your trades
- Most losses will be small (1-2R)
- Some winners hit 80R+
- Over time, math works in your favour

Trend Break Targets [MarkitTick]Trend Break Targets
Trend Break Targets is a technical analysis tool designed to assist traders in identifying trendline breakouts and projecting potential price targets based on market geometry. Unlike fully automated indicators that guess trendlines, this tool provides you with precise control by allowing you to manually Pivot Point the trendline to specific points in time, while automating the complex math of target projection and structure mapping.
Theoretical Basis & Concepts
This indicator is grounded in classic technical analysis principles found in foundational trading literature. It automates the following methodology:
Drawing a trend line between two key points to represent dynamic support or resistance.
Identifying a breakout when the price closes above or below this line, potentially signaling a change in trend.
Calculating a price target by measuring the vertical distance between the breakout line and the last high/low (pivot), then projecting that same distance in the direction of the breakout.
This concept is based on methods and "Measured Move" theories explained in classic books such as "Technical Analysis of Stock Trends" by Edwards & Magee, "Technical Analysis of the Financial Markets" by John Murphy, and in Thomas Bulkowski's Price Pattern Studies.
How It Works
Pivot Pointed Trendline Construction The script draws a trendline between two user-defined points in time (Start Date and End Date). It calculates the slope between these points and extends the line infinitely to the right, allowing you to define the exact structure (e.g., a resistance trendline on a wedge).
Breakout Detection The script monitors the "Price Source" (High, Low, or Close) relative to the extended trendline.
A Bullish Breakout (BC) occurs when the Close crosses above a bearish trendline.
A Bearish Breakout (BC) occurs when the Close crosses below a bullish trendline.
Dynamic Target Projection (The Math) Upon a confirmed breakout, the script automatically calculates three distinct targets by identifying the most significant "Swing Point" (Pivot) prior to the breakout.
Distance (D): The vertical distance between the Trendline and the Pivot Price at the specific bar where the pivot occurred.
Target 1 (T1): The Breakout Price +/- (Distance × 1.0). This represents a classic 1:1 measured move.
Target 2 (T2): The Breakout Price +/- (Distance × 1.618). Based on the Golden Ratio extension.
Target 3 (T3): The Breakout Price +/- (Distance × 2.618).
Market Structure (CHOCH) The script includes an optional Change of Character (CHOCH) module. This runs independently of the trendline logic, identifying local Swing Highs and Swing Lows based on the "Swing Detection Length." It plots dashed lines and labels to visualize immediate shifts in market structure.
How to Use This Tool
This is an interactive tool that requires user input to define the setup.
Identify a Setup: Locate a clear trend, wedge, or flag pattern on your chart.
Set Pivot Points: Go to the Indicator Settings. Input the exact Start Date and End Date corresponding to the two main touches of your trendline.
Monitor for Breakout: The script will extend the line. Wait for a "BC" label to appear.
Trade Management: Once "BC" prints, the T1, T2, and T3 lines will instantly render. These can be used as potential take-profit zones or areas to tighten stop-losses.
Settings & Configuration
Indicator Settings
Start/End Date: The timestamp Pivot Points for your trendline.
Price Source: Determines what price (High or Low) Pivot Points the line and triggers the breakout.
Pivot Left/Right: Adjusts the sensitivity for finding the "Pivot Before Break" used for target calculations.
Extend Target Line: How far forward the target lines are drawn.
Visual Style
Colors: Fully customizable colors for the Trendline, Breakout Labels, and each Target level (T1, T2, T3).
Gold Bullish Reversal
This analysis dissects a confirmed bullish reversal on Gold using a custom Trend Break system. The setup identifies a transition from a bearish corrective phase to bullish momentum, validated by a structural break and a geometric target projection.
Trend Identification (The Pivot Points) The descending white trendline serves as the primary dynamic resistance, defining the bearish correction.
Pivot Points: The line is drawn connecting two significant swing highs, marked by Label 1 and Label 2.
Logic: These points represent the "lower highs" characteristic of the previous downtrend. As long as price remained below this trajectory, the bearish bias was intact.
The Trigger: Breakout & Confirmation The transition occurs at the candle marked BC (Breakout Candle).
Breakout Criteria: The indicator logic dictates that a signal is only valid when the bar closes above the trendline. This filters out intraday wicks and ensures genuine buyer commitment.
CHOCH Confluence: Immediately following the breakout, a CHOCH (Change of Character) label appears. This signals a shift in market structure, indicating that the internal lower-high/lower-low sequence has been violated, adding probability to the reversal.
Target Projection: The Measured Move The vertical green lines (T1, T2) represent profit objectives derived from the depth of the prior move. The logic calculates the distance between the breakout line and the lowest pivot prior to the break.
T1 (Standard Target): This is a 1:1 projection of the pre-breakout volatility. We see price action initially stalling near this level, confirming it as a zone of interest.
T2 (Golden Ratio Extension): The second target is calculated as the initial distance multiplied by 1.618 (Fibonacci Golden Ratio). The chart shows the price rallying aggressively through T1 to tap the T2 zone, often considered an exhaustion or major take-profit level in harmonic extensions.
Conclusion Gold has successfully invalidated the 4-hour bearish trendline. The confluence of a confirmed close above resistance (BC) and a structural shift (CHOCH) provided a high-probability long setup. The price has now fulfilled the T2 (1.618) extension, suggesting traders should watch for consolidation or a reaction at this key Fibonacci resistance level.
Bearish Trendline Breakdown
The image displays a Bearish Trendline Breakdown on the Gold (XAUUSD) 4-hour chart. The indicator is actually functioning in "Low" mode here (connecting swing lows to form support), which triggers the bearish logic found in the code. Here is the step-by-step breakdown:
The Setup: Pivot Points & Trendline
Visual: The Blue Labels "1" and "2" connected by a white diagonal line.
Code Logic: These are the user-defined start and end points.
Pivot Point 1 (startDate): The starting pivot of the trendline.
Pivot Point 2 (endDate): The ending pivot.
Trendline: The code draws a line between these two points and extends it to the right (extend.right). In this specific image, the line acts as a Support Trendline.
The Trigger: Break Candle (BC)
Visual: The Red Label "BC" appearing just below the white trendline.
Code Logic: This is the execution signal. The code detects a "Down Break" (dnBreak) because the Price Source was likely set to "Low" and the candle's Close was lower than the Trendline Price at that specific bar (close < currLinePrice). This confirms the support level has been breached.
The Projection: Targets (T1 & T2)
Visual: The Green Labels "T1" and "T2" with dotted horizontal lines projected downward.
Code Logic: These are profit targets based on a "Measured Move."
Pivot Calculation: The script looks back for a recent "Pivot High" (the peak before the crash) to calculate the volatility/distance (dist) between that peak and the trendline.
T1 (Conservative): The price is projected downward by 1x that distance (currLinePrice - dist).
T2 (Extended): The price is projected downward by 1.618x that distance (Golden Ratio extension).
Market Context: CHOCH
Visual: The small Red/Orange "CHOCH" labels appearing above the price action.
Code Logic: This is a secondary confirmation system running independently of the trendline. It detects a Change of Character (structural shift). The red labels indicate a "Bearish CHOCH," meaning the price broke below a significant prior swing low (last_swing_low). This supports the bearish bias of the trendline break.
Disclaimer This tool is for educational and technical analysis purposes only. Breakouts can fail (fake-outs), and past geometric patterns do not guarantee future price action. Always manage risk and use this tool in conjunction with other forms of analysis.

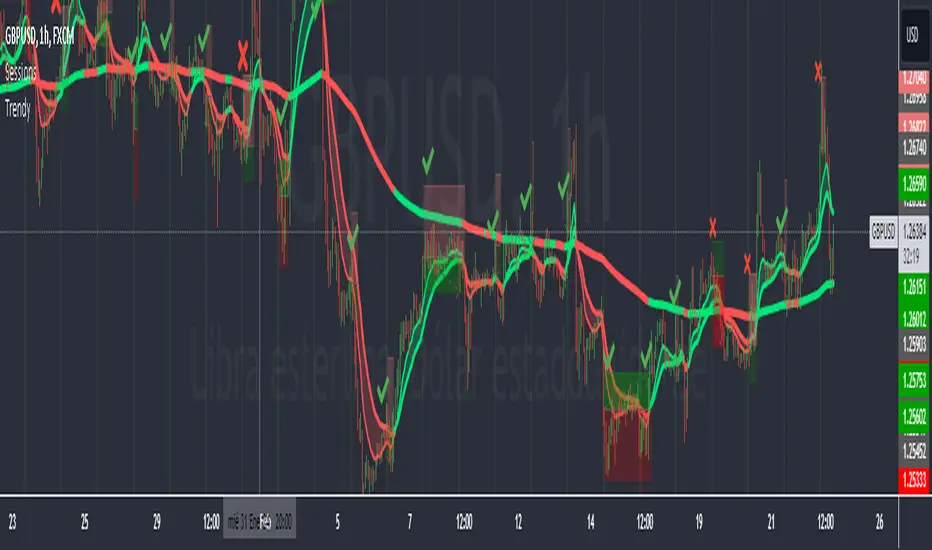
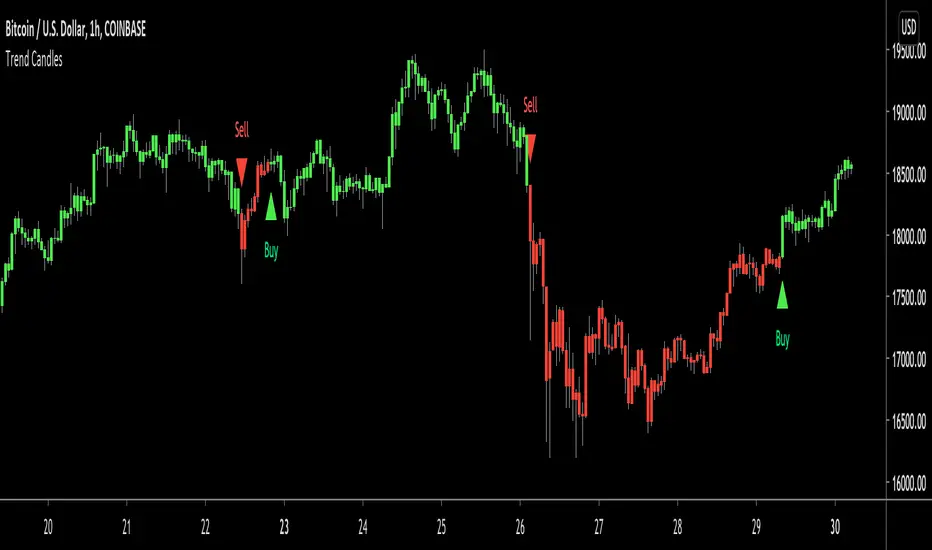
Trend CandlesTrend Candles is a simple indicator based on the trend following strategy that shows you exactly when to buy, sell and close trades on every chart, market and timeframe. It's always in a trade, either long or short as indicated by the color of the candles, when the candles are green that means go long, when they switch to red that means go short until the next green candle appears.
It's best used on markets that tend to trend a lot like currencies, futures and cryptos, however it also works well on stocks and ETFs (long-only).
How Is It Different From Other Indicators?
- Designed specifically for the trend following strategy
- Color coded candles for visually appealing chart guidance
- Signals are based on current and past volatility
- They aren't as sensitive to false signals after periods of contracted volatility
- Helps to keep you in the trend without being "shaken out"
- Can be applied to all markets and timeframes
How To Use The Indicator?
1) Visit our website URL shown below this description and subscribe
2) We will then grant your TradingView username permission to use our indicators
3) Go to your Indicators window, then the Invite-Only section and add our indicators to your chart
4) Our indicators will then show on every chart you now look at
5) You can set up alerts to be notified in real time of trading signals from our indicators
6) Read our user manual for all the best tips on how to use our indicators
7) Feel free to reach out to us for personal one-on-one help with getting setup
What Markets and Conditions Does It Work Best On?
All markets cycle between trending and ranging modes, and the key to successfully using these indicators is identifying when the market is in or likely to go into a trending mode, and as such it can be applied to all markets and timeframes. After a market has contracted for a period of time in a tight range, the 1st entry signal after the period of consolidation can become the start of a powerful trend. On the flip side taking every signal when a market is ranging will result in churn.
Our indicators are primarily designed for day trading and swing trading, however they can also be used for position trading and investing by keeping you invested in the trend which can be very difficult to do without a good indicator due to all of us being vulnerable to getting "shaken out" of a trend. This indicator will always respond to changes in price and will never keep you in a trend going against you, and like all good trend following it adheres to the principles of cutting your losses and letting your winners run so long as the trend is intact. It's the top 1-5% of your trades that account for 80-90% of your profits, as fat tail moves happen more often in markets than a normal distribution would suggest and that's why trend following albeit difficult to practice, will always work.
With stocks and ETFs, we recommend sticking to long only as shorting stocks is very difficult no matter the strategy or indicator used. If you're an investor you can use Trend Candles on the daily or weekly charts to help keep you in good stocks and industries and avoid holding onto perpetual losers.
As always indicators should be used as part of a trading strategy to assist in making decisions, instead of just blindly following every signal they produce you should always seek to compliment technical trading signals with additional analysis to reduce your risk and increase your odds of making a winning trade.
Examples Of Trend Candles On Various Markets and Timeframes
FOREX - EURJPY (5 Minute Chart)
CRYPTOCURRENCY - ETHUSD (30 Minute Chart)
STOCKS - TSLA (Daily Chart)
COMMODITIES - GOLD (Daily Chart)

To gain access to Trend Candles today visit our website shown below.
Happy Trend Following :)
TrendMaster, v. 5.1TrendMaster (ver 5.0, a.k.a. "Mr. T") is a trend-anticipating system which shows eye-popping results. Rather than a simple "trend-rider" which continually lags, TrendMaster uses pattern recognition to anticipate trend changes. It hunts for turns in market cycles using a proprietary decision matrix of 27 "trade triggers" (variants of classic technical indicators). In backtesting the annualized return (July 2017-July2018) of the top 100 largest capitalized equities, not only did its results beat the indexes, but it outstripped a buy-and-hold strategy by a whopping 700%: i.e., while the 100 largest equities had an average annual yield of 17%, the strategy produced a 129% return across the entire range of stocks.* Even more staggering results can be seen when using the system in strongly-trending markets like cryptos. (See, for instance, the particularly stunning results for Bitcoin Cash in the screen shot at the end). [ ]
The following charts give you some sample tests of best performing (top chart) and worst performing (bottom chart) equities, ETFs, and cryptos (July 2017-July2018 time range).
TrendMaster / "Mr T" 5.1, Example Annualized returns
>>> Higher Performing Instruments (best performing interval between 15min - 1 day) <<<
Symbol Description Interval % Return Trades % Profitable Profit Factor Max Drawdown Sharpe Ratio Buy & Hold
DUST 3x Short Gold miners 30 min 3050% 421 43% 1.5 ( -17% ) 1.8 ( - 27 % )
NUGT 3x Long Gold miners 15 min 3300% 423 44 1.2 ( -11% ) 1.2 ( - 10 % )
APPL Apple, Inc 1 hour 118% 354 46 2.2 ( -6% ) 1.3 32%
GOOG Alphabet, Inc 30 min 128% 660 44 1.9 ( -5% ) 1 27%
BABA Alibaba Group 30 min 389% 642 46 2.3 ( -3% ) 1.6 37%
BTC/USDT Bitcoin 1 hour 1000000% 1573 53 3.1 ( -8% ) 1 57%
ETH/USDT Ethereum 1 hour 13000000% 1533 55 3.2 ( -12% ) 1.2 56%
LTC/ USDT Litecoin 30 min 5000000% 1946 54 2.8 ( -12% ) 1.2 ( - 71% )
>>> Lower Performing Instruments and/or Lower Performing Market Settings (worst performing interval between 15 min - 1 day) <<<
Symbol Description Interval % Return Trades % Profitable Profit Factor Max Drawdown Sharpe Ratio Buy & Hold
PSQ Short Nasdaq ETF 5 min ( - 14% ) 1894 28% ( - 0.9 % ) ( -20% ) ( -0.3 ) ( - 20 % )
SH Short S&P ETF 1 day 20% 35 51% 2.8 ( -7% ) 0.5 ( - 12 % )
MSFT Microsoft 1 hour 37% 249 37% 1.4 ( -4% ) 0.5 45%
AZN Astrazeneca, PLC 1 day 22% 32 50% 1.9 ( -6% ) 0.3 ( - 4 % )
MUFG Mitsubishi UFJ 1 day 296% 1255 39% ( - 0.6 ) ( -27% ) ( - 0.3 ) ( - 16 % )
BTC/USDT Bitcoin 1 min ( - 33 % ) 1349 25% ( - 0.5 ) ( - 33% ) ( - 1.1 ) 5%
ETH/USDT Ethereum 1 min ( - 40 % ) 1595 24% ( - 0.6 ) ( -40% ) ( - 1.1 ) 6%
LTC/USDT Litecoin 1 day 123 14 57% 4.8 ( - 5% ) 1.1 ( - 48% )
Note, of course, that any trend-anticipating bot has limitations. The Lower Performing results above show that because the system seeks gains in trends, it can underperform in choppy, aimless markets. Similarly, very short time frames (i.e. 1 - 5 minutes) can provide too many gaps and too few runs for it to reliably track. Backtesting is therefore essential to make sure this system is suitable for your (a) market, (b) time frame, and (c) trading mindset. On the other hand, a broad range of data show that almost any trending market, in almost any time frame, can be very productive.
Contact us if you would like to experience this bot.

Trend FilterTrend Filter
Summary
Trend Filter is a multi-factor trend-confidence indicator that produces a simple, actionable output: Direction (Up / Down / Ranging) and a normalized Confidence %. It is intended as a decision-support overlay to help traders quickly identify whether a market is trending or rangebound, and how strong that directional bias is.
What it shows
A single line in the on-chart table: Direction (Up / Down / Ranging).
A Confidence % (0–100) that combines multiple normalized market signals into a single score.
Optional notification row when a manually-selected reference timeframe does not match the chart timeframe.
Alert conditions when direction changes to Up, Down, or Ranging.
How the indicator works (concise, non-proprietary explanation)
Trend Filter computes a weighted confidence score from several complementary components, each normalized to a 0–100 scale and combined into a single confidence value. The components and their roles are:
EMA structure & spread (trend breadth)
-Uses three EMAs (fast / mid / slow) computed at lengths that scale with the selected/reference timeframe. The EMA spread (fast vs slow) quantifies directional separation.
HH/HL structure and streaks (price structure)
-Counts higher highs/higher lows (and the reverse) across a scaled lookback to measure whether price structure is predominantly bullish, bearish or mixed.
EMA slope (momentum of trend)
-A robust slope approximation (smoothed) measures whether the short EMA is rising/falling relative to its own smoothed history.
ADX / DMI (trend strength)
-Uses a standard ADX-style component to capture directional persistence and dampen the confidence score when the ADX is weak.
ATR (volatility context)
-ATR expressed as a percentage of price helps detect abnormal volatility regimes which affect the validity of trend signals.
Volume context
-Simple volume vs a short SMA gives a participation signal that increases confidence when moves occur with higher volume.
Each component is capped to avoid outsized influence. Components are scaled by a set of weights (configurable in code) and then combined. The final confidence is lightly smoothed before being used to determine direction and to feed alert conditions.
Important implementation & safety design choices (why it’s not a simple mashup)
Adaptive timeframe scaling: EMA lengths and lookbacks are proportionally scaled based on the chosen reference timeframe (Auto or manual). This preserves relative indicator behavior across 1-minute → Daily timeframes without manual retuning of each parameter.
HH/HL structure plus streaks: Instead of relying solely on moving averages or ADX, the script explicitly measures price structure (HH/HL counts and streaks) and blends that with slope/ADX. This reduces false trending signals on noisy price action.
Normalized, weighted combination with caps: Each component is normalized (0–100) and combined by predefined weights; cap thresholds prevent extreme component values from dominating the result. This is a design intended to produce interpretable confidence % rather than opaque binary outputs.
History and loop safety: The code enforces a cap and protects loop lengths against available historical bars to avoid runtime errors and to ensure the script remains stable on short data series.
Practical guardrails: The script includes notification behavior to highlight manual timeframe mismatches and avoids dynamic indexing patterns that can cause unreliable results on small bar histories.
These design decisions — adaptive scaling, structural HH/HL scoring, capped normalization and explicit safety limits — are the elements that distinguish Trend Filter from simple, single-indicator overlays (EMA-only, ADX-only, etc.) and form the basis for why closed-source protection is reasonable for commercial/invite-only publication.
User controls & recommended usage
Reference Timeframe: Auto (uses chart TF) or choose a manual reference TF (1min → D). When manual TF is selected, the table shows a mismatch warning if the chart TF differs.
Table placement & colors: Positioning and appearance of the on-chart table are configurable.
Confidence thresholds: The indicator uses internal thresholds to mark high/medium/low confidence. Users can interpret the Confidence % relative to those ranges.
Alerts: Built-in alerts fire only on direction changes (to Up, Down, or Ranging). Use alerts as a signal to review the chart rather than an instruction to trade automatically.
How traders typically use it
Add Trend Filter as an overlay to your chart.
Confirm that the recommended reference timeframe is appropriate (Auto will adjust automatically).
Use Direction and Confidence % together: high Confidence + Up (or Down) suggests staying with trend; Ranging suggests avoiding trend-following entries.
Combine this filter with your entry/exit rules (price structure, support/resistance, or your preferred signal generator).
Disclaimers & limitations
This is a decision-support indicator, not an automated execution strategy. It does not place orders and does not provide P/L or backtesting statistics.
Confidence % is an aggregated measure — treat it as context, not a guarantee.
Results vary across symbols and timeframes; use appropriate position sizing and risk controls.
The code intentionally includes history and loop safeguards; on very short histories the indicator may display conservative results.
