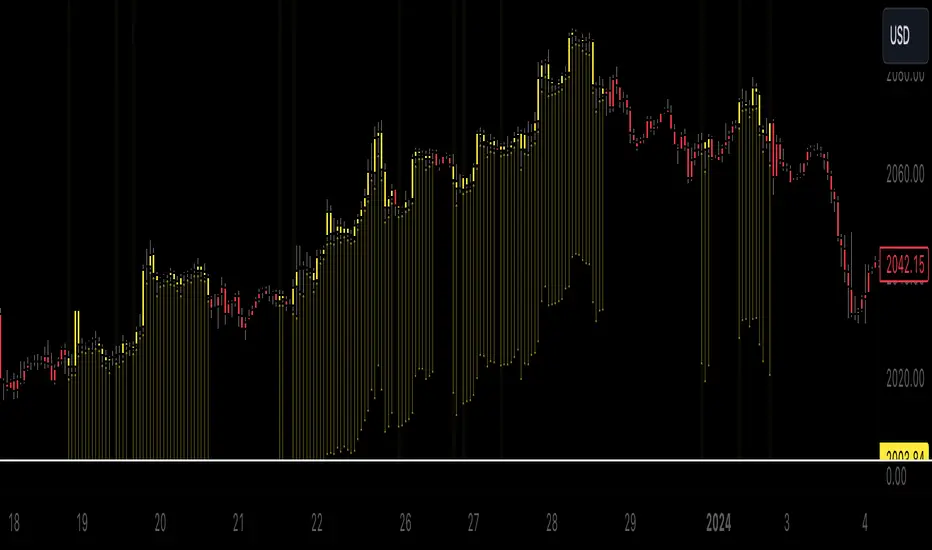
Trend Degree Dashboard (Table)📈 Trend Degree Dashboard (Table) — v1.0
This indicator calculates and displays the trend angle (in degrees) based on the linear regression of the selected source (default: close) over a user-defined lookback period (default: 21 bars).
The trend angle gives a quick visual reference of the current market slope — positive (uptrend) or negative (downtrend).
A dashboard table shows the trend angle directly on the chart, with a background color:
🟩 Green background for positive angles (uptrend)
🟥 Red background for negative angles (downtrend)
🔧 Features:
Customizable Lookback Period: Set the number of candles to consider for trend calculation.
Source Selection: Apply the analysis to close, open, high, low, or any other price series.
Dashboard Positioning: Choose where the dashboard appears (Top Left, Top Right, Bottom Left, Bottom Right).
Clean Table Design: Minimalistic and easy-to-read dashboard with automatic background color highlighting based on trend direction.
⚙️ How It Works:
It uses Linear Regression to measure the slope between two consecutive points.
Converts the slope into degrees using the arctangent function (atan) for a geometric interpretation of trend strength and direction.
Updates the dashboard table live with the latest angle value.
✅ Script Highlights:
Non-repainting: Once a bar closes, its value is fixed.
Efficient performance: Lightweight table visualization with no heavy calculations.
Clear trading signals: Positive angles suggest bullish momentum, negative angles suggest bearish momentum.
⚠️ Disclaimer:
This script is a technical analysis tool designed to assist in decision-making but does not guarantee results.
Please use it alongside other tools and practice proper risk management. Always test any indicator on demo accounts before applying it to live trading.
Cari dalam skrip untuk "trend"

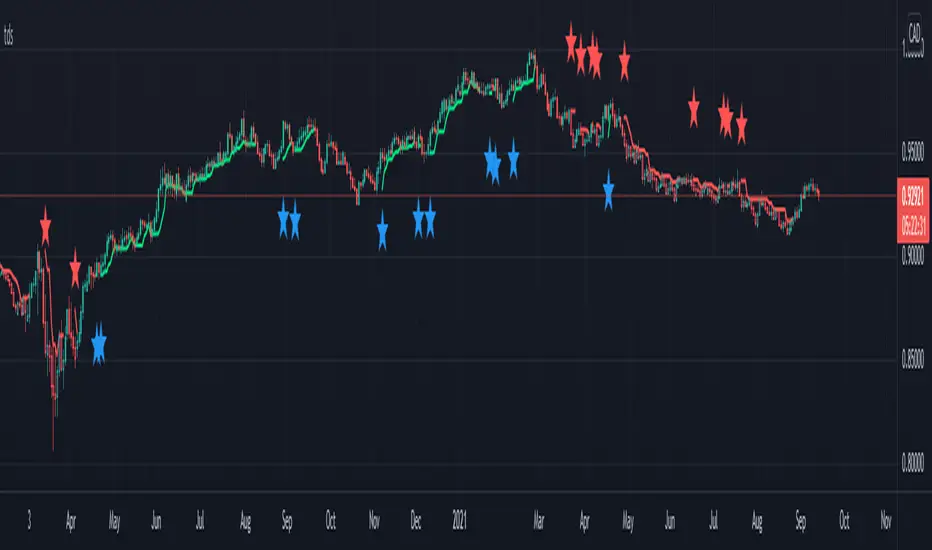
Trend with Mathematical Approach GOLD [AstroHub]
Welcome to the Trend with Mathematical Approach! 🚀
This tool uses a unique mathematical approach to help you spot potential trend beginnings in the market.
By analyzing the derivative of closing prices and applying a specialized moving average, SmartTrend identifies
key points where a new trend might be starting.
🟢 Green arrows show potential BUY opportunities when a new uptrend begins.
🔴 Red arrows indicate potential SELL opportunities when a new downtrend starts.
Additionally, the indicator provides easy-to-read colored backgrounds to highlight potential trend zones.
Green means a potential uptrend, and red suggests a potential downtrend.
To make it even more user-friendly, SmartTrend adds clear labels for BUY and SELL signals directly on the chart,
making it easy for you to spot opportunities at a glance.
💡 Pro Tip: Use the built-in alerts to get notified when SmartTrend identifies a potential trade opportunity.
Enjoy using SmartTrend and happy trading! 📈💰

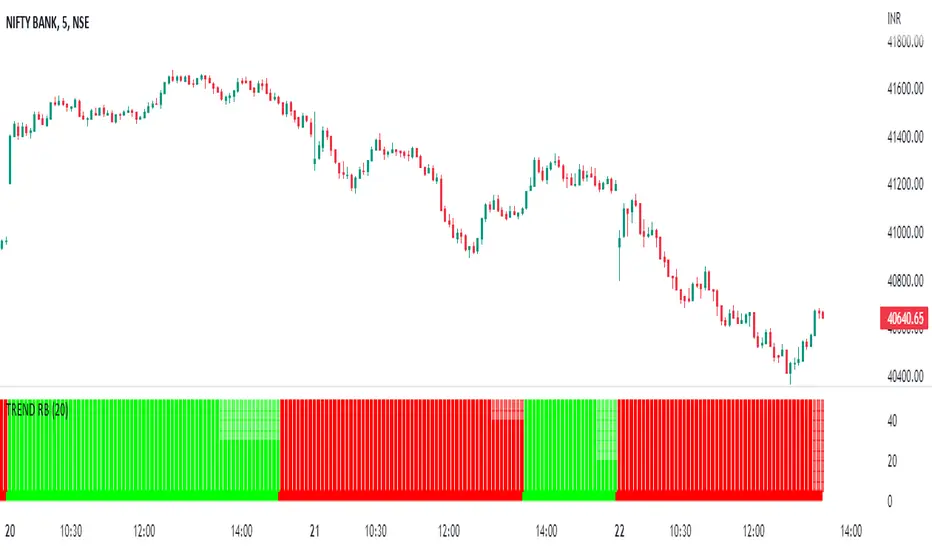
TREND RBReduce Fake Signals, and identify the trend and use as double confirmation
How Does it work ?
- it calculates main trend direction by using the length that is user-defined. so you can change it as you wish
- then it calculates trend direction for each 9 lower lengths. if you set the length = 20 then the lengths are 19, 18,...11
- and it checks if the trend directions that came from lower lengths is same or not with main trend direction.
- it changes the trend color of the ribbon.
Trend Ravi TrialTrial for trend analysis
it was not difficult to convert to look like and work like Trend Trader Karan's Tool, who invested " Lakho Rupaya" and works on the basis of price action trading also.
Let me tell you guys, this is nothing but an ATR based system which people already traded as Half Trend, Super Trend and various names. Half Trend is no more a copyrighted indicator, which stopped marketing after being exposed, but people are still cheating with such indicators.
TrendLineThis is a tool to see trend lines on charts. This code takes two maximum and two minimum and draws a line between them.

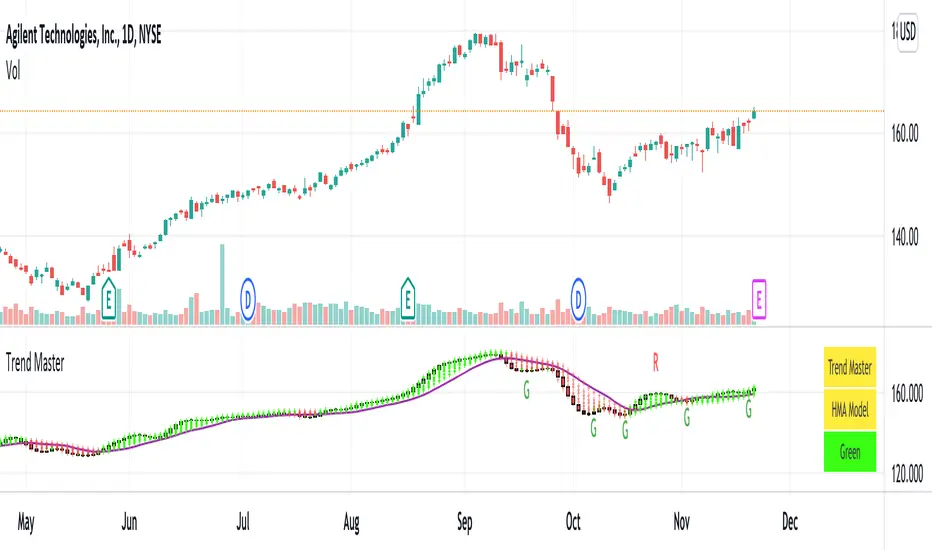
Trend MasterNotes:
Tradingview has strict house rules of not allowing Heikin Ashi charts (and others beside normal price chart) to be used together with the indicator for trend analysis.
However, there may be users already using previous version of Trend Master but unfortunately has been hidden by Tradingview.
In view of this I decided to re-post the updated version, with the use of normal price chart only. Hope this help.
1. Trend Master, an indicator for trend analysis with the use of normal price chart.
2. Trend Master candle is in the form of solid candle without upper and lower tails.
The candle is in green color during an uptrend and red color during a downtrend.
When candle changes from red color to green color, it may signify the potential change from a down trend to an uptrend, vice versa.
3. Users can select the trend analysis model as they see fit, namely EMA , SMA , WMA and HMA .
4. Moving average lines of Trend Master are also included. Default is SMA13, the rest are SMA5, SMA21.
5. Users can turn on Rainbows if needed, it may help to detect the small changes of trend, if any.
6. A table of Indicator Name, Trend Model and Trend status is included. User can turn on to see the details.
Comments are welcome to further improve the accuracy of indicator that will benefit public users. Hope this help.
Disclaimer : attached chart is for the purpose of illustrating the indicator, no recommendation on buy/sell
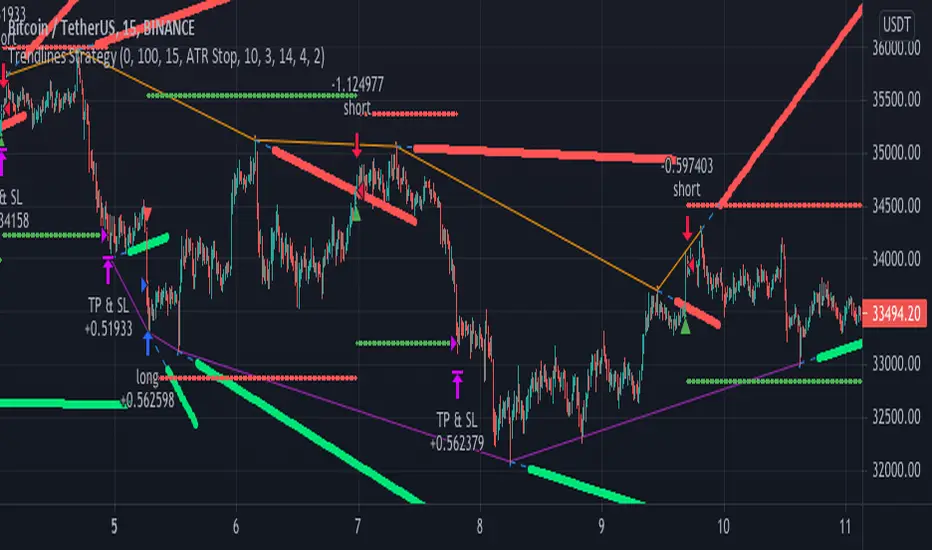
Trendlines StrategyUsing the clever calculations and code by BacktestRookies, here is a strategy that buys
when the price breaks above the trend line and sells (or shorts) when it crosses below.
This logic can be reversed, which seems to work better with recent market conditions.
trend detection systemFX:USDCHF time frame of chart shown is 1hr candles
this indicator has been designed to sniff out trends and plot its findings on the candles directly
when all of the confluences line up it will colour the candles green in the case of a bullish idea or red in the case of a bearish idea
it develops its signal by adding a multitude of tools together and waiting for the response to be positive
the tools it uses are
a heavily modified rsi that has been converted to a long term trend flow tool
multiple moving averages all of which are hidden as they are just used as a part of the calculation
pip hunter bacd which is another one of my indicators that takes 2 moving averages and through some complex calculation gets a signal on whether it is bullish or bearish
the combination of all of these tools into one easy to use item allows you as a trader to take your mind off the charts and frees up space to use other things you might like
Trend Indicators CollectionAnalyses MACD crosses with Ichimoku cloud direction and state
General idea:
- MACD crosses usually point to a change in trend direction and Kumo state and direction often act as a confirmation as well as a trend strength indicator. Using this, the script points out where there were was or can be a point where the trend change may have the strength to carry on.
Buy warnings:
- This warning will be triggered in two ways, both of them only if MACD is above EMA and the current close price is over Kumo:
- Senku span A crosses over Senku B (Kumo turns positive) when MACD is already positive
- MACD turns positive when Kumo is already positive
Sell warnings
- Triggered in two ways:
- Kumo turns negative when the current close price is bellow EMA
- The inverse of the above, the current close price falls bellow EMA when the Kumo is already negative
Trend Indicators Collection (TIC) contains:
- MACD, EMA, ADX, Mass index, Ichimoku Cloud, and Pivot points
- Best suited for monthly charts with 30m bars

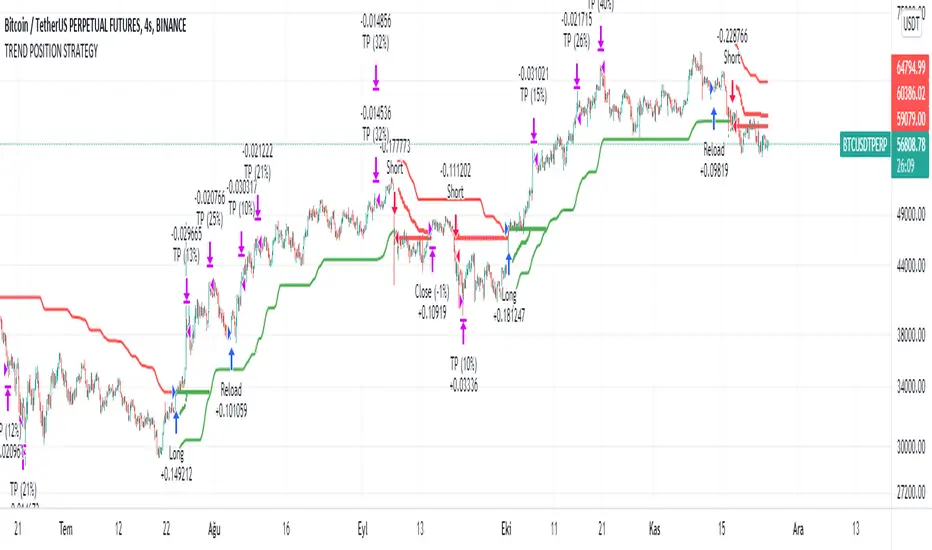
TREND POSITION STRATEGYThis indicator gives buy and sell signal using HMA , RMA, RVI, SMA , HULLMA.
This strategy signals is based on the market close price from multiple time frames, and uses composite technical indicators to filter out the best buying and selling points.This indicator should be used to see trend, range zones, evaluate the best areas to enter the market, use higher time frames to confirm a direction can be useful.
It designed for automatic crypto trade systems.
For use message me.
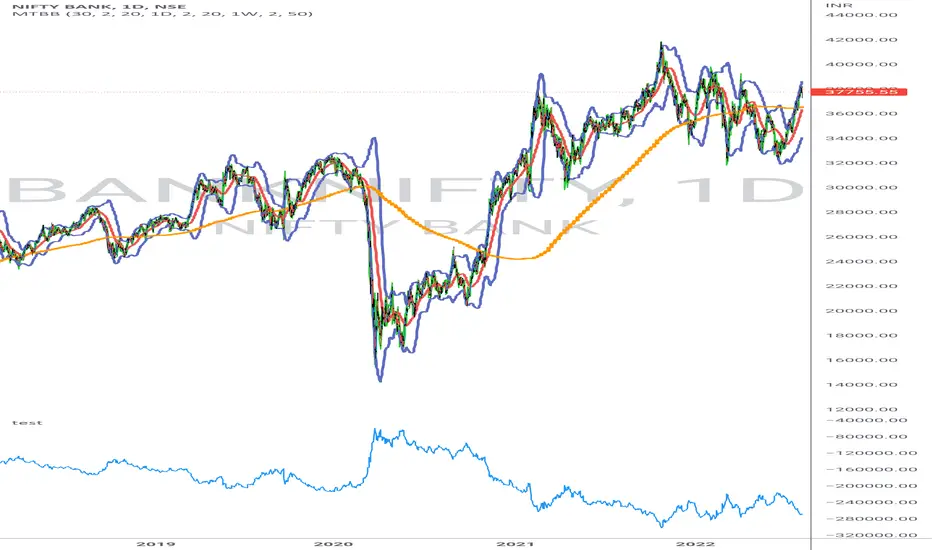
Trend M ver1this simple tool a helper for trader in order to put your target at the correct places:)
so script based on Trend M (open script in my page)
the script based on non security MTF that allow us to detect the M = mean average of resistance and support by MTF
best setting is either monthly or weekly
when you go on lower chart just put in the min the exact TF that you on. 60 min =60
2 hour 120
5 min =5
etc
when ever the trend is above the mean or M then it bullish =lime color. bellow the M is bearish =red color
the R1 and S level are % from the mean . so it can act for us either target or as stop loss
you can set the R1 or S1 as you like by % ratio . so 0.01 is 1%
0.1 is 10 % etc
all you need to find is the weekly or monthly range of the asset then put the % ratio that you wish up or down
you can use it with trend lines or other method .it just another tool to make you trade smarter

trend folowing study► Description
This strategy is based on the famous turtle system and tried to stay true
to the rules within the confines of what pinescript will allow me to do.
So i have adapt that pinescript and the code to the lower timeframe which was not the system of the turtle system.
The ATR and the lookback is adapt to the lower timeframe and is reducing the risk on the trade.
This indicator is based on the study mode with alert on long, short and exits.
The turtle system, is meanly a breaking trend following study use on fix low timeframe for certain pair and in day pair that you would like.
So in other word the system is trying to catch the next big pump or dump and ride it.
So it show the next trade to take manually or even automatically and the next take profit also to set up.
The next trade is automatically recalculate so the ideal is to take the next trade when the signal is close to the market price.
► Strategy results
The result exposed on exemple are based on the reversal only. The recommanded strategy is to used the Take Profit(TP) to limit the risk on each trade.
The TP receommanded are 0,3;1;5;10% set as default but you could modify it at you own caution in the settings.
The exemple you should take profit.
The setting and the paire trade must be selected in the setting.
► Configuration
So there is a window who show you the trade in progress, and on the bottom the trade to take at the bottom.
This trade at the bottom keep changing with the time so the best is to set up a alert with long and short to keep you posted.
The paires have a specific configuration, so you will need to select the trading pair and the timeframe to execute the script.
► Vendor requirements
PM us to obtain access

TE - TREND ANTICIPATORTREND ANTICIPATOR has been designed to assist the traders during the live market hours in their decision-making process. Along with Multitimeframe Trend Analyzer, this system supports the traders to quickly decide ENTRY & EXIT prices while trading intraday.
TimeFrame: Works best in 3mins & 5mins TF.
LOGIC:
Power Candles are the high momentum candles that are coded by taking price-movements w.r.t volume in a particular timeframe into consideration.
Plots are 9/21/50 EMAs which are colour coded to represent a multi-timeframe trend in 5min/15min/30mins respectively.
PB (Pull-Back Indicator) considers the volume & price change in adjacent during the breakout to judge the confirmation of pullback.
LEGENDS:
BLUE CANDLE - Bullish momentum
BLACK CANDLE - Bearish momentum
SILVER CANDLES - Ordinary Candles
PB - Shows a high probability of PULL-BACK from that candle.
How to take entry:
1. Confirm Trend using Multitimeframe Trend Analyzer.
COLOURED PLOT - REPRESENTS CURRENT TREND IN THE SELECTED TIME-FRAME (BLUE: BULLISH / BLACK: BEARISH )
2. FOR BULLISH ENTRY
1st BLUE candle shows probable BUYING ENTRY. 2nd BLUE candle closing above the 1st BLUE candle gives CONFIRMATION.
After CONFIRMATION, BUY at candle's HIGH with last wave's LOW as SL for TARGET R:R - 1:1.
9/21/50 EMAs can be used to make exit decisions as well.
Remember to keep booking profits partially and trail SL for the next target.
3. FOR BEARISH ENTRY - Follow the same rules.
THIS IS A PAID SCRIPT. FOR ACCESS PLEASE SEND A PRIVATE MESSAGE OR WHATSAPP ME (NUMBER IN SIGNATURES)
AS PER TRADINGVIEW POLICY, PLEASE DO NOT ASK FOR ACCESS IN COMMENTS SECTION.

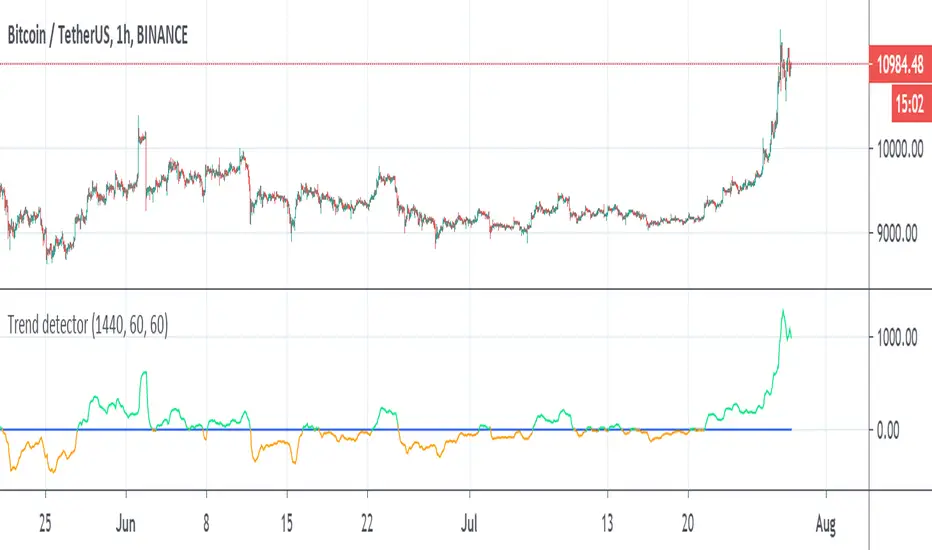
Trend detectorThis is trend detector
buy above 0 sell bellow zero (lime and orange color)
you can set it using min distance (now set to 1440)
The MTF sytem source original idea by Duyck
perfect indicator for the day trader
you can use the Low scanner that i put early for entry or use this system for it
tesla
Trend Up\DownThis indicator is used to visually determine the trend on a chart, signaling a likely change of Up or Down trend.
The indicator can also signal that the asset is likely to be oversold by signaling the emerging triangle from below.
It is recommended to be used in conjunction with the graphical technical analysis and at oversold is well read with bollinger bands .
To gain access to this indicator, you may contact me via direct message on Tradingview or Telegram.

Trend FactorThis indicator is based of a series of averages using different lengths plotted at the same time on a chart.
The thin line is a no lagging average which is to be used when trading with renkos.
The none lagging average is not needed when trading with candles and can be turned off in the settings
At quick glance this will allow you to understand trend direction increasing your probability of winning trades
This indicator is to be used as part of a system
Use the link below to obtain access to this indicator.
Trending Band IndicatorThis indicator shows the trend of the market. The middle line is the 200-day moving average because it shows the long term trend of the market. However, since the market does give fake signals of going up and down through the 200-day moving average, I had to put a band on it to push through the fake signals. The first band around the middle line is 1 standard deviation of historical volatility which gives an area of cushion to prevent fake signals. The goal is if the stock is above the first top band, then the stock is in an uptrend. If the stock is below the first bottom band, then the stock is in a downtrend. If it is the middle of the first bands, then the stock is known to be rangebound.
The top most and bottom most yellow lines are 4 standard deviations of historical volatility which give an idea of where the floor and ceiling are. This helps investors and traders identify good buy and sell zones using the yellow lines to see overbought and oversold sides.

Trend Follower NNFXThis is a trend following system that combines several indicators which provide different functions, concept based on No Nonsense FX.
1. Baseline ( red and blue line)
- Market is either bullish or bearish when price closes above or below baseline.
-turns red when bearish
-turns blue when bullish
2. Trend Strength
- Lighted Squares shows strength
-Blue - Bullish Strength
-Red - Bearish Strength
3.Bar Color
- Blue for longs, Red/White for shorts, Grey when in ranging periods.
4. Pivot Point trendline filter for shorts and longs
-keeping you in the trend more
Still working on the script, please PM me for testing purposes.

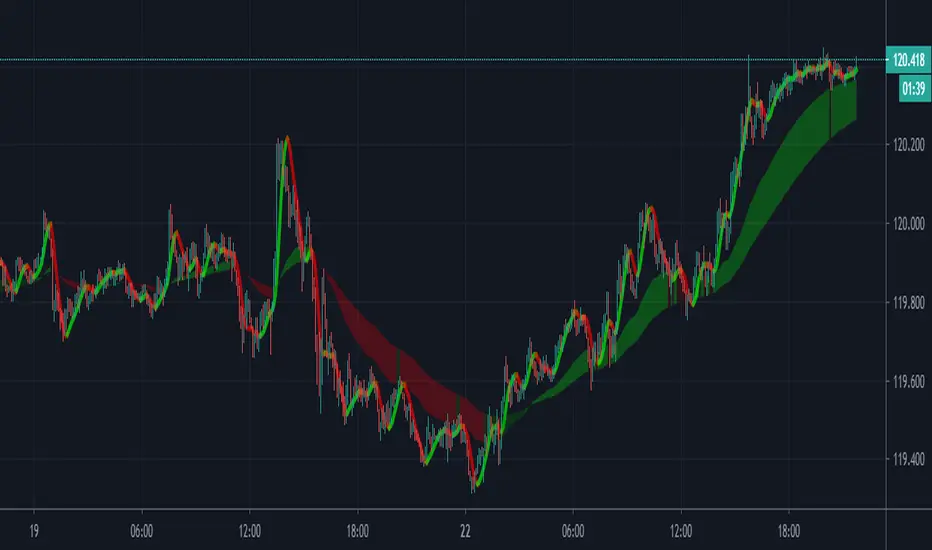
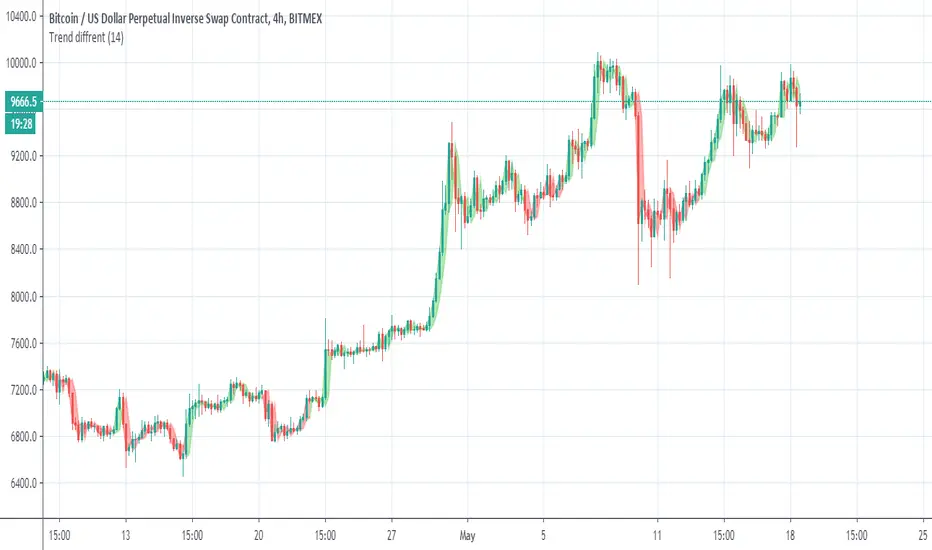
Trend diffrentSo I make this trend indicator . the trend base on length
so I set it to 14. but try to set it set to your optimal length that you like.
The idea here is to make the trend line over the candles so in this way we can disregard unwanted ups or low that are not part of the overall trend
So i hope you like it
Trend Trading Indicator V1it is Indicator base of Super-trend and Moving average its identify Trend Generate Signal
Indicator Feature
Long signal with Alerts
Short signal with Alerts

