Strategi Pine Script®
Cari dalam skrip untuk "bot"

Crypto Wave Rider Indicator - Bitcoin & Crypto SignalerAfter months of research and testing, I have developed the first public beta of my Crypto trading script.
Note the following:
1.) This algo works best with /USD pairings (e.g. ETH/USD). Doesn't work as well with /BTC pairings (e.g. ETH/BTC). I believe this is because USD is stable and allows for better data (rather than comparing two very volatile assets to each other).
2.) This algo works best on swing trading time frames (4 hour - 12 hour) but can also be used on lower time frames (although lower than 1 hr is not recommended). For reference, I've found the best time frames to be as follows: BTC - 6 hour, LTC - 4 hour, ETH - 12 hr
So far, the results have been far better than the other bots/indicators I've come across.
This indicator has been optimized for use on Bitcoin with 6 hour candles just because Bitcoin is the oldest crypto & has the most backtesting data available. And 6 hour time frame because I prefer swing trading over day trading.
Feel free to test on different time frames and coins to see what gets the best results.
Comments and feedback appreciated!!
************Note: Please do not ask me for the source code. It is protected for a reason....I won't be giving it out to anyone.*************
Strategi Pine Script®

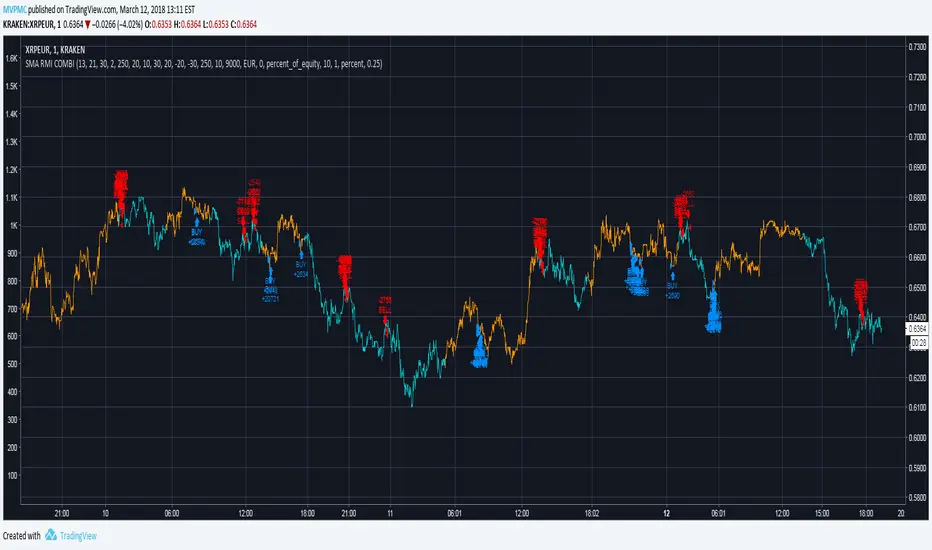
CMYK XIAM◊ Introduction
This is project XIAM, a trading bot based on SMA and RMI
◊ Origin
Based on 'The Relative Momentum Index' by Roger Altman : February, 1993 issue of Technical Analysis of Stocks & Commodities magazine.
While RSI counts up and down days from close to close, the Relative Momentum Index counts up and down days from the close relative to a close x number of days ago.
This results in an RSI that is smoother. The input has been changed to the change of a smoothed close multiplied by a smoothed volume .
In addition SMA is used to detect an up/downwards phase.
◊ Adjustments
CMYK color theme applied.
◊ Usage
Automatic trading strategy
◊ Future Prospects
Remove jitter.
Take Variance into account
Auto adjusting settings evaluated on previous placements.
Proper asset management.
Strategi Pine Script®
BB/StochRSI Strategy Backtest For Crypto BotThumbs Up for access
Buy is triggered when the price reaches chosen percent of lower Bollinger Band, Stoch RSI is oversold and there's a K/D signal crossover. The exit is when StochRSI is Overbought or K/D Crossover (toggle) AND/OR (toggle) price is greater than or equal to Top or Mid Bollinger Band (toggle).
Use 15m charts. It works excellent for consolidating/sideways markets and good for bullish impulsive moves but takes losses during impulsive downside market moves.
Results will be better in real-time. The script calculates the price based on the close, but a bot would calculate in real-time. Entries would be better. I recommend manually testing the strategy by using the "Date and Price Range" tool in TradingView.
I'll share the source code to those who wish to collaborate for improving profitability.
Strategi Pine Script®

Strategi Pine Script®
Grahn Gyllene Kors [Alerts]Grahn Gyllene Kors is the companion study for the Grahn Gyllene Kors strategy...
This is an EMA / Trend Explorer & Strategy useful for identifying trends before EMA's cross and also identifying and experimenting with various EMA lengths and candle trends. There is also a companion Alerts study for this in which trend signals may be sent to the user via sms or email AND/OR buy and sell alerts may be sent to bots for automated trading of this strategy. Once you have optimized your settings and backtested with this strategy, apply your same settings into the Alerts study and create your alerts.
NOTICE: This script does not require access from me, simply open Indicators on chart and search for "Grahn". By accessing this script you acknowledge that you have read and understood that this is for research purposes only and I am not responsible for any financial losses you may incur by using this script!
EMA Fast and EMA Slow - may be adjusted in length and color.
Bullish F>S % - controls what percentage the EMA Fast should be above EMA Slow before considered bullish and is represented by the Green band on the chart.
Neutral % - is what percentage surrounding the EMA Slow should be considered neutral and is represented by the Yellow band on the chart.
Bearish F
Penunjuk Pine Script®

BTC MTF Directional average (1h/2h res)1h or 2h resolution
Any market without multiple weekly binary data events and enough liquidity (eg. Bitcoin)
**For bitcoin use preferably on bitfinex or an index of all exchanges and exchange volume. Most of the price manipulation occurs at bitfinex, other exchanges will often be slightly behind.
V 0.0.1
** KNOWN ISSUES
Around the time of the new daily candle (2AM GMT+1 on BTC) false signals may occur due to 24 hours being the highest resolution.
Repainting: due to the nature of tradingview's pinescript these false signals will disappear after 2-3 new candles and refreshing the page.
** UPDATES
Added browser alerts (untested)
Tip: Don't always wait for the bot to flip to risk off when volatility kicks in (eg. during wash trades).
Strategi Pine Script®

Moonbot - Cryptocurrency Trading StrategyThis is a greatly improved upon version of my cryptoTurtle. Enough has changed I didn't think it was appropriate to just update cryptoTurtle. I will possibly be selling this bot on bitcointalk in the future, stay tuned!
Setup:
Buy: Above green line and green up arrow.
Sell: Sell when above top red line or bottom red line. Also sell if arrow turns down and red.
Strategi Pine Script®

GunbotThis is based on the bot found here . It isn't as smart as gunbot due to limitations of pinescript, but I am posting up for anyone using gunbot as it might help with finding good pairs to trade and good settings for those pairs as you can use this to backtest. Also, I am only guessing at some things that his strategy does, based off the instructions and examples he gave in this thread.
Strategi Pine Script®

simple botthe AI=
value of close of candle < value of close of candle previous by 1 = sell
close > close1 = buy
closeorder on SL
closeorder on AutoProfit
closeorder on signal reverse (if openorder not in profit)
Strategi Pine Script®

Bot Scalping XAUUSD(Volatilidad + TP Parcial + Modo Intermedio)Probar un nuevo bot.
En oro dando entradas para scalping con TP, SL Y BE
Strategi Pine Script®

Bot MasterSqueeze 1.1 (crypt)Countertrend strategy for correction to the average value. The strategy is designed primarily for crypto.
The principle of operation is that with a rapid price change, the strategy tends to take a reverse position to return to the average value, which statistically often happens. It is enough for you to determine the percentage of the offset about the average price and the size of the averaging position as a percentage of the deposit.
With the settings, you determine how to determine the average opening price. It can be MA at the price of opening, closing, etc., and DCMA. Soon I will add a few more options for determining the average opening price
You can also choose the average price at which the transaction will try to close.
Now there are 3 methods:
- closing when returning to the average price
- closing on the first correction candle
- opening on an abnormally large candle in the direction of correction and closing on the first one is opposite
Search for the settings by the selection method for each pair separately. It is better to trade using signals via a bot.
The strategy shows itself best on volatile coins paired with the dollar for 1 hour or more.
Soon I will add new options for opening and closing deals, as well as determining the average price.
ATTENTION: the strategy involves averaging, so be careful with levers and overestimating the percentage of the transaction from the deposit. It is best to allocate no more than 25 percent to the risk of the transaction.
Strategi Pine Script®

Bot go_up strategyHello. This strategy is based on go_up alerts.
Our task is to find the local minimum. The trade is entered on the basis of RSI and SMA according to a specific formula, which is embedded in the code. When the RSI crosses the SMA upside down, a long position is entered. You can change the length of the RSI . The longer the length, the less frequent, but more accurate the entrance, and vice versa. You can use a different time frame.
The settings have:
1) RSI length, the lower the length, the more often the entry.
2) Testing results for any period of time
3) Take profit for any percentage
4) Stop order for any percentage
5) If there is a check mark ✅, then purchases will always be made, and if not, then purchases will be made, BUT, if the next payback is lower than the previous one, it does not matter by what percentage.
6) If there is a check mark ✅, then each trace of the purchase will be made provided that it is lower by the percentage specified, even if the conditions of the purchase are triggered.
7) The filled area is made for visual display of consolidation zones
Default settings:
RSI length 15, step 1.5, take profit 15, stop order 30.
Also in the settings there is a pyramid of the order, keep this in mind. Enter a deal for a small part of the deposit, and not for all the money at once! You can remove pyramiding and see the results with one entry.
For a more visual understanding, overlay the go_up script.
You can choose a strategy for yourself based on history! If you need examples of strategies, then write to me, my contacts are in the column: instructions from the author.
Successful trades, dear friends, I am glad that you trust me!
Strategi Pine Script®

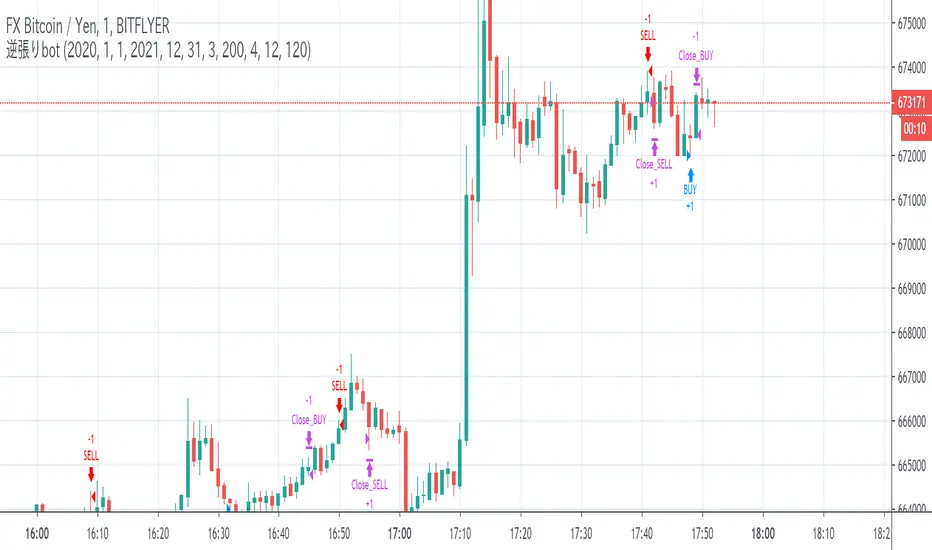
bot strategy1分足逆張りです.この前公開したのよりは遥かに高性能(なはず)です.strategy.exitでstop使ってます.少し詳しくは英文で.
This strategy is the counter trade strategy that I am actually trying to implement, and is realized by a simple combination of 3 indicators (maybe 2 ?. eg. sma ). There is no plan to release the strategy, but it is a script that I personally expect because I am hooked on how to stop the contrarian and the timing of entry. I don't use "security" ,but using strategy.enter(limit) and strategy.exit(stop). It seems that the performance is better than the publicly available "stoploss" because it is not a specific price (eg. 500) range but a variable according to the market price. Since all entry, close, and stop values are shown in the graph, it is possible to find the value back from that value. Good luck.
※Tested environment : FXBTCJPY , 1min
Strategi Pine Script®
Bot Study v7 OverlayShowing the direction of price, based on candlestick patterns. Working similarly as PSAR or Supertrend.
Penunjuk Pine Script®

Penunjuk Pine Script®
Strategi Pine Script®

BOT O/C-EMA-SAR-ADX-ICHIMOKUIt is a study based on Open Close, crossing of EMA's, ADX, PARABOLIC SAR, RSI and VOLUME. He also has alerts and does not repaint.
Penunjuk Pine Script®

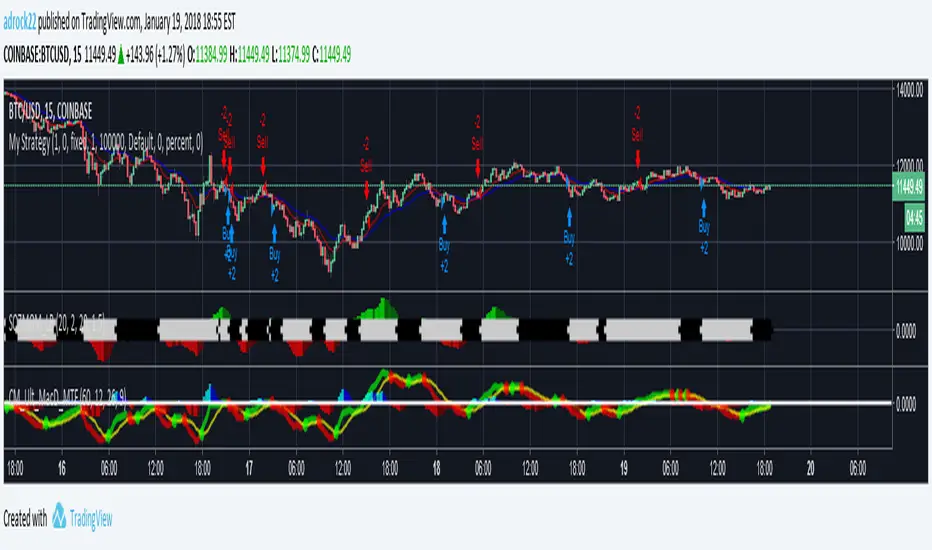
MACDouble + RSI (rec. 15min-2hr intrv) Uses two sets of MACD plus an RSI to either long or short. All three indicators trigger buy/sell as one (ie it's not 'IF MACD1 OR MACD2 OR RSI > 1 = buy", its more like "IF 1 AND 2 AND RSI=buy", all 3 match required for trigger)
The MACD inputs should be tweaked depending on timeframe and what you are trading. If you are doing 1, 3, 5 min or real frequent trading then 21/44/20 and 32/66/29 or other high value MACDs should be considered. If you are doing longer intervals like 2, 3, 4hr then consider 9/19/9 and 21/44/20 for MACDs (experiment! I picked these example #s randomly).
Ideal usage for the MACD sets is to have MACD2 inputs at around 1.5x, 2x, or 3x MACD1's inputs.
Other settings to consider: try having fastlength1=macdlength1 and then (fastlength2 = macdlength2 - 2). Like 10/26/10 and 23/48/20. This seems to increase net profit since it is more likely to trigger before major price moves, but may decrease profitable trade %. Conversely, consider FL1=MCDL1 and FL2 = MCDL2 + (FL2 * 0.5). Example: 10/26/10 and 22/48/30 this can increase profitable trade %, though may cost some net profit.
Feel free to message me with suggestions or questions.
Strategi Pine Script®

3Commas DCA Strategy Backtesting [The Quant Science]This strategy is an advanced Dollar Cost Averaging (DCA) simulator designed to replicate the logic of 3Commas algorithmic trading bots directly within TradingView. This streamlined version showcases the power of Pine Script in developing high-efficiency backtests. By deep-diving into the data before going live, users can stress-test their setups and avoid costly mistakes.
The following 3Commas configuration is assumed for this template:
Direction: Long | Order Type: Limit | Exchange: Binance (BTC/USDT
Initial Order Size: Set to 1000 USDT.
Entry Logic: Our custom TradingView signal triggers on an RSI bearish cross of the 35 level, initiating a Long DCA sequence on oversold conditions.
The Averaging orders logic for this template is configured as follows:
Deviation to open first averaging order: 1%
Averaging order size: 100 USDT
Deviation step multiplier: 1.5
Order size multiplier: 1.5
Averaging orders per trade: 11
Limit averaging orders placed on exchange: 11
Critical Note: Max amount for bot usage & Backtesting Accuracy
When configuring 3Commas, always prioritize the Max amount for bot usage parameter. This is essential to ensure your backtesting data remains realistic and avoids "illusory" results.
As shown in this setup, the Max amount for bot usage is approximately 8,500 USDT. This represents the maximum amount of funds the bot can trade. To maintain high-fidelity backtesting on TradingView, we have set the Initial Capital to 10,000 USDT.
By utilizing ~85% of the available equity (8,500 out of 10,000 USDT), the simulation closely mirrors real-world trading conditions.
If your Max amount for bot usage exceeds your account balance, you must adjust your configuration. Always align your bot settings with your specific trading goals and financial capacity to avoid liquidation or failed order execution.
🧠 Workflow Description
This strategy automates 3Commas-style Dollar Cost Averaging (DCA), operating exclusively on the Long side. The first order is triggered when the 7-period RSI crosses down the oversold threshold (default: 35), signaling a potential local bottom. Upon entry, the system simultaneously calculates and places 10 averaging orders via limit orders at progressively lower price levels to manage the position. The spacing between these orders is dynamic; it increases exponentially through a deviation multiplier, allowing the strategy to cover deep drawdowns effectively. Simultaneously, the volume of each subsequent purchase grows according to an amount multiplier, aggressively pulling the average entry price downward. The trade is closed either at a take profit target triggered once the total position equity reaches the set value or via a stop loss calculated from the initial entry price.
Backtesting Considerations & Performance Analysis
Despite the positive net profit shown in the strategy report, this specific configuration underperforms when compared to a simple Buy & Hold approach. In this scenario, a Buy & Hold investor who simply hold 10,000 USDT worth of the asset would have achieved a significantly higher return than the trader executing this DCA strategy. This indicates that while the bot is "profitable" in absolute terms, it is not capital-efficient under these specific market conditions.
❌ To keep this simulator streamlined and focused on core DCA logic, the current version does not include the following features:
Base Template Only: This is a foundational framework designed for educational and initial testing purposes.
No Leverage Backtesting: All calculations assume a 1x spot-trading margin (no liquidation or margin cost simulation).
No Short Selling: This version is strictly long-only.
Simplified DCA Settings: Advanced 3Commas parameters (such as Minimum Deviation Step or Non-linear Volume Scaling) are not included.
Fixed Order Count: The strategy is hardcoded to 11 total orders (1 Base Order + 10 Averaging Orders).
Standard Profit Logic: Take Profit % is calculated based on the Average Price, while Stop Loss % is anchored to the Initial Base Order price.
No Reinvestment (Compounding): The strategy uses a fixed position size and does not automatically reinvest profits into subsequent deals.
Feel free to swap the trigger logic or optimize the averaging settings to discover a configuration that outperforms a simple Buy & Hold strategy.
Strategi Pine Script®

6E Sniper - Prop Elite StealthThe 6E Sniper: Elite Prop-Ready Stealth Bot
Precision Flag Trading During High-Volume Sessions
The 6E Sniper is not just another indicator—it’s a comprehensive execution system engineered specifically for Euro FX Futures (6E) traders. Built to navigate the strict rules of modern Prop Firms, this bot combines structural price action with professional-grade risk management.
Core Strategy: The "London-NY" Flag
The bot targets the most reliable setup in the futures market: the Session Breakout & Flag Reclaim. It identifies the "Pole" (a break of the Previous Day High or Low) and strikes only when price pulls back to form a high-probability "Flag" during the London and NY Open.
Key Features for Professional Scaling
• Prop Firm Consistency Guard: Never worry about the "20% Rule" again. Input your account size and profit goal, and the bot automatically calculates your daily cap to keep your account compliant.
• Stealth Execution Mode: Hide your hand from the market. The bot manages your $300 risk and $550 target locally, executing market orders only when levels are hit to avoid "Stop Hunting" by HFT algorithms.
• Aggressive Scaling Logic: When a trade moves 10 ticks into profit, the bot adds a second position to reach your $550 target faster, while simultaneously moving your stop to break-even to protect your capital.
• Structural Stop Losses: No blind tick-stops. The bot places your exit strictly above or below the flag channel, ensuring you are protected by actual market structure.
Strategi Pine Script®

Livermore's Pyramiding Trading - 3Commas [SwissAlgo]
📊 J. LIVERMORE'S PYRAMIDING TRADING - 3Commas Integrated
A Trading Approach Inspired by Jesse Livermore's Position Building Principles
━━━━━━━━━━━━━━━━━━━━━━━━━━━━━━━━━━━━━━━━━━━
DISCLAIMER
This indicator is an educational tool based on historical trading principles. Past performance is not indicative of future results. Trading involves substantial risk of loss. Only trade with capital you can afford to lose. You are responsible for all trading decisions.
━━━━━━━━━━━━━━━━━━━━━━━━━━━━━━━━━━━━━━━━━━━
📚 WHO WAS JESSE LIVERMORE?
Jesse Livermore (1877-1940) was one of the greatest traders in history.
His core insight: "Most traders do everything backward."
♦ "They deploy all capital at once" → Livermore entered with a small fraction of his capital (he started with a 'test position' to validate his trade idea and waited for market confirmation to deploy more, building positions in steps = "pyramiding")
♦ "They average down" (DCA) → Livermore added to trades showing good results only, and never to losing trades, as the trend kept aligning with his trade idea
♦ "They use arbitrary % stops" → Livermore exited when structure appeared broken (he trailed his stop loss to try to protect unrealized profit - if any)
♦ "They take profits too early or set arbitrary TP%" → Livermore let trades showing positive results run until proven wrong (trial take profit)
💬 "I always made money when I was sure I was right before I began. What beat me was not having enough brains to stick to my own game."
— Jesse Livermore
This indicator tries to translate his principles into a SYSTEMATIC FRAMEWORK :
BO = Base Order (first order, base of the pyramid)
PO = Pyramid Orders (additional layers of capital deployed as long as the 'tape' does not invalidate the trade idea)
♦ Test First (BO - 20%) - Small entry to test your idea. If wrong, lose small. If right, can consider pyramiding into strength.
♦ Build Position Size (PO1-3 - 80%) - Add only as trend unfolds favorably (the indicator uses specific Fibonacci levels to track milestones - 0.618, 1.0, 1.272 - and looks for strong confluence among price, volume, trend, momentum, break of resistance/support levels to suggest and trigger actions: entries, exit)
♦ Attempt to Protect Capital - Dynamic stops: the indicator trails the stop loss, to try to protect potential gains from previous steps (if any)
♦ Discipline - Trades fire only when ALL conditions align
━━━━━━━━━━━━━━━━━━━━━━━━━━━━━━━━━━━━━━━━━━━
🎯 INDICATOR FEATURES
You map 3 points on the chart → The indicator generates a systematic trading plan structure based on your wave analysis.
✓ Auto-detects trade direction: Uptrend wave (A➚B➘C) = Long signals | Downtrend wave (A➘B➚C) = Short signals
✓ Entry/exit prices: BO, PO1, PO2, PO3, and dynamic EXIT (trailing stop)
✓ Real-time condition monitoring: Live ✓/✗ checks for each order (price closes + volume + trend + pivot breaks + candle quality + sequence)
✓ Visual trade execution: Green labels mark entries (BO/PO1/PO2/PO3), red labels mark EXIT
✓ Optional 3Commas automation: JSON webhooks for hands-free execution via Signal Bots
⏰ Recommended Timeframes: 1H, 4H, Daily
(Lower timeframes like 15m/5m produce excessive noise and false signals)
💬 "Watch the market leaders, the stocks that have led the charge. That is where the action is and where the money is made."
— Jesse Livermore
━━━━━━━━━━━━━━━━━━━━━━━━━━━━━━━━━━━━━━━━━━━
⚙️ SETUP IN 3 STEPS
🟡 STEP 1: Map Your Wave (Points A → B → C)
Identify a completed wave pattern:
For LONGS:
♦ Point A = Swing low (wave start)
♦ Point B = Swing high (impulse end)
♦ Point C = Pullback low (retrace end - where next wave may begin)
For SHORTS:
♦ Point A = Swing high (wave start)
♦ Point B = Swing low (impulse end)
♦ Point C = Pullback high (retrace end - where next wave may begin)
How to set points:
Settings → Enter dates manually OR drag the vertical lines directly on the chart (easier - just click and drag the pre-mapped A/B/C lines)
Requirements (auto-validated by code):
✓ All dates must be in the past (Point C = completed retrace, not forming)
✓ Clear impulse A→B (minimum 5% move)
✓ Clear retrace B→C (minimum 3% pullback)
───────────────────────────────────────────
🟡 STEP 2: Set Budget & Allocation
Settings → "TRADE PARAMETERS"
♦ Total Budget: $10,000 (example - capital for THIS trade only, not your entire account)
♦ Allocation (must total 100%):
BO = 20% ($2,000) - test position
PO1 = 25% ($2,500) @ Fib 0.618
PO2 = 30% ($3,000) @ Fib 1.0
PO3 = 25% ($2,500) @ Fib 1.272
💬 "It was never my thinking that made big money for me. It was always my sitting. Men who can both be right and sit tight are uncommon."
— Jesse Livermore
───────────────────────────────────────────
🟡 STEP 3: Monitor Your Trade Plan Table
The table (top-right corner) has 4 sections that guide your execution:
BUDGET DEPLOYMENT
♦ Trigger prices for each order (BO auto-calculated at 0.5 Fib between B-C)
♦ Dollar amount per entry
♦ Fibonacci level assigned to each PO
ENTRY/EXIT CONDITIONS
Each column (BO, PO1, PO2, PO3) shows live status (✓ or ✗) for:
♦ Price: 2 consecutive closes (BO) | 3 consecutive closes (POs)
♦ Volume: OBV directional alignment OR volume spike above average
♦ Trend: Normal or Strong Bull/Bear (no entries in Uncertain trend)
♦ Pivot: Nearest resistance (longs) or support (shorts) broken
♦ Clean Candle: Momentum without reversal wicks <30% (POs only)
♦ Sequence: Prior order must have fired first (POs only - no skipping levels)
TRIGGERED?
Shows execution status for each order (✓ = fired, ✗ = waiting)
If using 3Commas: ✓ confirms JSON alert was sent to your bot for real execution
VALIDATIONS
✓ Green = All checks passed, setup is valid
⚠️ Yellow = Warning (e.g., budget doesn't equal 100%, deep retrace)
✗ Red = Error (e.g., dates in wrong order, invalid wave structure)
⚠️ Wait for ALL ✓✓✓✓✓ (or ✓✓✓✓✓✓) to align in a column before that order fires at bar close
💬 "The game of speculation is the most uniformly fascinating game in the world. But it is not a game for the stupid, the mentally lazy, the person of inferior emotional balance, or the get-rich-quick adventurer."
— Jesse Livermore
━━━━━━━━━━━━━━━━━━━━━━━━━━━━━━━━━━━━━━━━━━━
📊 CHART VISUALS - READING THE INDICATOR
Fibonacci Extension Lines
After mapping A-B-C, horizontal lines extend to the right:
♦ Solid green/red lines = Active PO entry levels (0.618, 1.0, 1.272)
♦ Dotted gray lines = Reference Fib levels used for exit tracking (2.0, 2.618, 3.0, etc.)
♦ Labels on right = Show level and price: "Fib 0.618 / $67,324 "
Entry/Exit Price Lines
♦ Thick green line (longs) / red line (shorts) = BO entry price with direction label
♦ Dashed red line = Current EXIT price (your trailing stop loss - appears after BO fires and moves as price extends)
Trade Execution Labels
Visual confirmation when orders fire on the chart:
♦ Green labels (below/above candles) = BO, PO1, PO2, PO3 entries executed
♦ Red label = EXIT triggered (position closed)
Trend Strength Indicator (EMA Line)
The thick colored line shows real-time trend status:
♦ Bright lime = Strong bullish trend
♦ Light green = Normal bullish trend
♦ Bright red = Strong bearish trend
♦ Light red = Normal bearish trend
♦ Gray = Uncertain/weak trend (no entries fire in this state)
Entries require at least Normal trend strength aligned with your trade direction.
💬 "I never argue with the tape. Getting sore at the market doesn't get you anywhere."
— Jesse Livermore
━━━━━━━━━━━━━━━━━━━━━━━━━━━━━━━━━━━━━━━━━━━
🔧 ENTRY LOGIC - TECHNICAL DETAILS
💬 "The big money was never made in the buying or the selling. The big money was made in the waiting."
— Jesse Livermore
───────────────────────────────────────────
🟢 BASE ORDER (BO) - TEST POSITION
BO Price Calculation
Auto-calculated at the 0.5 Fibonacci retracement between Point B and Point C
Formula: (Price B + Price C) / 2
Why this level?
♦ Midpoint between impulse end (B) and retrace end (C)
♦ Breakout above/below suggests retrace may be complete
♦ Designed to help position BO below all Fib extensions (to control sequence issues)
───────────────────────────────────────────
BO Entry Conditions - ALL 5 Must Align:
1️⃣ PRICE: 2 Consecutive Closes Beyond BO
♦ Longs: close > BO AND close > BO
♦ Shorts: close < BO AND close < BO
♦ Why: Designed to confirm breakout commitment and filter fakeouts
2️⃣ TREND: Normal OR Strong Trend Aligned
♦ Detection: 18-period EMA + ADX/DMI + higher timeframe slope
♦ States: Strong Bull/Bear (ADX>30), Normal Bull/Bear (price vs EMA), Uncertain
♦ Confirmation: Requires 3 consecutive bars in the same state (to reduce flip-flop)
♦ BO accepts: Normal OR Strong (you're testing early, basic alignment sufficient)
3️⃣ PIVOT: Nearest Resistance/Support Broken
♦ Storage: 60 most recent pivot highs/lows (dynamic lookback per timeframe)
♦ Longs: Nearest pivot HIGH above BO → must break with 2 closes
♦ Shorts: Nearest pivot LOW below BO → must break with 2 closes
♦ Price Discovery: If no pivot exists beyond BO = auto-pass
♦ Why: Aims to confirm momentum has overcome previous rejection zones
4️⃣ VOLUME: OBV Aligned OR Spike
♦ Directional OBV: OBV > 20-EMA (longs) OR OBV < 20-EMA (shorts)
♦ OR Volume Spike: Current volume > 20-period SMA
♦ Why: Checks for institutional participation signals
5️⃣ VALIDATIONS: Setup Valid (✅)
♦ Dates valid (A < B < C, all in past)
♦ Wave structure valid (min 5% impulse, min 3% retrace)
♦ Budget allocation = 100%
♦ Prices detected at all points
⚠️ BO fires once per bar close. Flag set permanently until trade resets.
───────────────────────────────────────────
🔺 PYRAMID ORDERS (PO1-3) - PYRAMIDING INTO STRENGTH
💬 "Never buy a stock because it has had a big decline from its previous high. The big money was never made in the stock market by buying on declines."
— Jesse Livermore
PO Price Calculation
Fixed Fibonacci extensions from Point C:
Formula: Price C ± (Impulse Range × Fib Level)
Where: Impulse Range = |Price B - Price A|
Default Levels:
♦ PO1 @ Fib 0.618 (Golden Ratio)
♦ PO2 @ Fib 1.000 (Full impulse repeat)
♦ PO3 @ Fib 1.272 (Fibonacci sequence extension)
───────────────────────────────────────────
PO Entry Conditions - ALL 6 Must Align (STRICTER):
1️⃣ PRICE: 3 Consecutive Closes Beyond PO
♦ Longs: close > PO AND close > PO AND close > PO
♦ Shorts: close < PO AND close < PO AND close < PO
♦ Why: Higher conviction needed when adding capital (3 vs 2 closes for BO)
2️⃣ TREND: Same as BO
Normal OR Strong trend must remain aligned with trade direction
3️⃣ PIVOT: Per-Level Pivot Break
♦ Each PO checks its OWN nearest pivot (not shared with BO)
♦ Same 2-close break requirement
♦ PO3 Exception: Price discovery allowed (no pivot required if already profitable)
4️⃣ VOLUME: Same as BO
Sustained confirmation required (not weakening)
5️⃣ CLEAN CANDLE: <30% Reversal Wick (NEW)
♦ Filter: Uses ATR(14) - candles < ATR auto-pass (consolidation noise)
♦ Longs: Upper wick < 30% of candle range (no rejection at top)
♦ Shorts: Lower wick < 30% of candle range (no rejection at bottom)
♦ Why: Don't pyramid into weakness/rejection - only add on clean momentum
♦ Not checked for BO: Test position tolerates some wick risk
6️⃣ SEQUENCE: Prior Order Fired
♦ PO1 requires: BO fired
♦ PO2 requires: PO1 fired
♦ PO3 requires: PO2 fired
♦ Why: No skipping levels - disciplined building only
───────────────────────────────────────────
⚙️ KEY DIFFERENCE:
BO (20% capital) = Lighter requirements, testing your idea early
POs (80% capital) = Stricter requirements, adding only to confirmed winners
♦ BO: 2 closes | POs: 3 closes
♦ BO: No candle check | POs: Clean candle required
♦ BO: Independent | POs: Sequential (must follow order)
♦ BO: No price discovery | PO3: Allows price discovery when profitable
💬 "Profits always take care of themselves, but losses never do. The speculator has to ensure himself against considerable losses by taking the first small loss."
— Jesse Livermore
━━━━━━━━━━━━━━━━━━━━━━━━━━━━━━━━━━━━━━━━━━━
🚪 EXIT LOGIC - TECHNICAL DETAILS
🔴 EXIT PHILOSOPHY
The indicator uses TWO INDEPENDENT EXIT TRIGGERS (whichever fires first):
1) Structural Breakdown
Price breaks through the EXIT level with confirmation
2) Trend Reversal
Trend flips against your position AND price breaks EXIT level
Why two methods?
♦ Structure = price-based protection (hard stop)
♦ Trend = momentum-based exit (early warning when market character changes)
♦ Combined: Exit either when proven wrong (structure) or when conditions no longer favor your direction (trend)
───────────────────────────────────────────
🔴 EXIT PRICE CALCULATION
The EXIT price (your stop loss) adjusts dynamically based on position size:
BEFORE PO3 Fires (Fixed Stops):
♦ BO only = Stop at Point C (small position, tight stop near entry)
♦ PO1 fired = Stop at Fib 0.5 (moved to breakeven zone)
♦ PO2 fired = Stop at Fib 0.786 (protecting partial profits)
AFTER PO3 Fires (Trailing Stops):
♦ Tracking: Monitors the highest Fib reached (longs) or the lowest Fib reached (shorts)
♦ Placement: EXIT moves 1-2 Fib levels below the highest (longs) or above the lowest (shorts)
♦ Example: Price reaches Fib 2.618 → EXIT trails up to Fib 2.0
♦ Purpose: Designed to protect accumulated profits while allowing room for normal pullbacks
💬 "It never was my thinking that made the big money for me. It was always my sitting. Men who can both be right and sit tight are uncommon."
— Jesse Livermore
───────────────────────────────────────────
🔴 EXIT CONDITIONS
Exit Speed (Based on Risk Exposure):
♦ Full position (PO3 fired) = 1 close required (fast exit - more capital at risk)
♦ Partial position (BO/PO1/PO2 only) = 2 closes required (confirmation - less urgency)
METHOD 1: Structural Breakdown
Price violates the EXIT level with clean momentum:
For Longs:
♦ Price closes BELOW EXIT level (1 or 2 closes depending on position size)
♦ Clean candle required (lower wick < 50% of range - no false breakdown)
For Shorts:
♦ Price closes ABOVE EXIT level (1 or 2 closes depending on position size)
♦ Clean candle required (upper wick < 50% of range - no false breakout)
Why clean candle check?
Designed to reduce exits on wicks/fakeouts. If there's a large reversal wick (>50%), it suggests buyers/sellers are defending the level - not a true breakdown.
METHOD 2: Trend Reversal
Market character shifts against your position:
For Longs:
♦ Trend shifts from Bull → Normal Bear OR Strong Bear
♦ AND price breaks below EXIT level (same close requirements)
For Shorts:
♦ Trend shifts from Bear → Normal Bull OR Strong Bull
♦ AND price breaks above EXIT level (same close requirements)
Why this matters?
♦ Proactive exit before structural stop is hit
♦ If the trend that confirmed your entries reverses, the setup is invalidated
♦ Livermore principle: Exit when market proves you wrong, don't wait for max pain
───────────────────────────────────────────
⚠️ EXIT BEHAVIOR
♦ Fires once per bar close (same as entries)
♦ Resets all tracking after exit (ready for fresh trade setup)
♦ Clears flags: boSignalFired, po1/po2/po3SignalFired, highestFib/lowestFib tracking
♦ If using 3Commas: Sends exit_long or exit_short JSON (market order closes 100% position)
💬 "I never argue with the tape. Getting sore at the market doesn't get you anywhere."
— Jesse Livermore
━━━━━━━━━━━━━━━━━━━━━━━━━━━━━━━━━━━━━━━━━━━
🤖 3COMMAS AUTOMATION (OPTIONAL)
💬 "There is the plain fool, who does the wrong thing at all times everywhere, but there is also the Wall Street fool, who thinks he must trade all the time."
— Jesse Livermore
Automation designed to help remove emotion and support disciplined execution.
───────────────────────────────────────────
⚡ QUICK SETUP IN 5 STEPS
STEP 1: Create Your Signal Bots
You need 2 SEPARATE BOTS (one for Longs, one for Shorts):
Go to 3Commas → Bots → Create Bot → Select "Signal Bot"
Basic Settings:
♦ Bot Name: "Livermore Long - " (example: "Livermore Long - BTCUSDT")
♦ Exchange: Your connected exchange
♦ Trading Pair: Must match TradingView chart exactly
♦ Strategy: Custom Signal
♦ Direction: LONG (for first bot) or SHORT (for second bot)
♦ Max Active Deals: 1
⚠️ CRITICAL SETTINGS:
Entry Orders:
♦ Toggle ON: "Entry Orders"
♦ Volume per Order: "Send in webhook, quote"
♦ Why: This lets the indicator control exact $ amounts per order (BO=$2K, PO1=$2.5K, etc.)
♦ If you skip this: Orders will use wrong sizes and break your allocation plan
Exit Orders:
♦ Toggle ON: "Exit Orders"
♦ Volume per Order: "100 Position %"
♦ Why: Closes your entire position when EXIT signal fires
♦ Toggle OFF: "Take Profit" (managed by indicator)
♦ Toggle OFF: "Stop Loss" (managed by indicator)
Click "Start Bot" for both Long and Short bots.
───────────────────────────────────────────
STEP 2: Get Your Bot Credentials
For EACH BOT (Long and Short):
♦ Open the bot → Click "Orders" tab
♦ Scroll down to "Webhook Messages" section
♦ Copy these 3 values:
bot_uuid (long string like: a362cbcf-7e68-4379-a83d-ae6e47dba656)
secret (very long token starting with: eyJhbGciOiJ...)
webhook URL (refer to 3commas to get exact webhook - signal bots)
Note: The secret is usually the same for both bots, but the bot_uuid is different.
───────────────────────────────────────────
STEP 3: Enter Credentials in Indicator
Back in TradingView:
♦ Open indicator Settings
♦ Find section: "1️⃣ INTEGRATE 3COMMAS"
♦ Paste:
Long = Your Long bot UUID
Short = Your Short bot UUID
Secret = Your secret token (same for both)
♦ Click "OK"
The indicator now has everything needed to build JSON payloads.
───────────────────────────────────────────
STEP 4: Create TradingView Alert
This alert bridges TradingView → 3Commas. ONE ALERT HANDLES ALL SIGNALS (BO, PO1, PO2, PO3, EXIT).
How to create:
♦ Right-click chart → "Add Alert" (or click clock icon)
♦ Condition: Select this indicator from dropdown
♦ Trigger: "Any alert() function call"
♦ Alert Name: "Livermore Pyramiding - "
♦ Message: Leave default (indicator sends its own JSON)
♦ Webhook URL: Paste your 3Commas webhook URL from Step 2
♦ ⚠️ Alert Frequency: "Once Per Bar Close" (CRITICAL - controls duplicate orders)
♦ Expiration: Open-ended (or set specific date)
♦ Click "Create"
───────────────────────────────────────────
STEP 5: Test Before Going Live
🧪 NEVER TEST WITH REAL CAPITAL FIRST. Use one of these methods:
Test 1: Check Bot Status
♦ 3Commas → Bots → Both bots show "Active" (green)
♦ Click into each bot → Orders tab → Should say "Waiting for signal"
Test 2: Verify Alert Active
♦ TradingView → Alerts panel (bell icon)
♦ Your alert should show "Active" status
Test 3: Paper Trade / Tiny Position
♦ Use 3Commas paper mode if available, OR
♦ Set Total Budget to $10-50 for first real test
♦ Map a wave that's about to trigger
♦ Watch if orders actually appear on 3Commas
Test 4: Check JSON Format
♦ When alert fires → TradingView Alerts → Click your alert
♦ Look at "History" or "Log"
♦ Verify JSON has: bot_uuid, secret, action, price, amount
───────────────────────────────────────────
🛠️ COMMON ISSUES & SOLUTIONS
✗ Problem: Orders not appearing on 3Commas
Possible causes:
♦ Wrong webhook URL → Must be exact 3Commas URL (check for typos)
♦ Bot paused → Check bot status must be "Active" (green)
♦ Wrong bot UUID → Verify you copied Long UUID for longs, Short UUID for shorts
♦ Secret mismatch → Double-check secret is correct
♦ Exchange API issues → Verify exchange connection in 3Commas settings
How to debug:
♦ 3Commas → Your Signal Bot → Orders tab
♦ Look for "Rejected Signals" section
♦ Should show error messages if webhook failed
───────────────────────────────────────────
✗ Problem: Orders executing at wrong prices
Possible causes:
♦ Limit order not filled → Price gapped through your level before order filled
♦ Slippage on exits → Exits use market orders (intentional - speed over exact price)
♦ Exchange minimums → Some exchanges have minimum order sizes
Solution:
♦ Entries use limit orders (wait for exact price - may not fill if price gaps)
♦ Exits use market orders (prioritize fast execution when structure breaks)
♦ This is INTENTIONAL DESIGN following Livermore's principle: exit when proven wrong
───────────────────────────────────────────
✗ Problem: PO orders firing out of sequence or skipping
Possible causes:
♦ Alert not set to "Once Per Bar Close" → Change alert frequency setting
♦ Multiple alerts running → Delete old/duplicate alerts for this indicator
♦ Conditions changed mid-bar → Indicator only fires at bar close (protective feature)
Solution:
♦ Keep only 1 active alert per indicator instance
♦ Always use "Once Per Bar Close" frequency
♦ Wait for full bar to close before signals can fire
───────────────────────────────────────────
✗ Problem: Bot not closing position on EXIT
Possible causes:
♦ Exit order setting wrong → Check bot settings
♦ Wrong JSON action → Should be "exit_long" or "exit_short"
♦ No position open → Can't close what doesn't exist
Solution:
♦ Verify: Bot Settings → Exit Orders → Volume per Order = "100 Position %"
♦ Check alert history for correct JSON payload
♦ If stuck: Manually close position in 3Commas, then fix settings
♦ Delete and recreate alert if JSON format is wrong
───────────────────────────────────────────
🔒 SECURITY BEST PRACTICES
♦ Never share bot UUID or Secret - Treat them like passwords
♦ Use restricted API keys - Limit to specific pairs, disable withdrawals
♦ Start small - Test with $10-50 first, scale up only after success
♦ Monitor first trades - Don't set-and-forget immediately
♦ Delete old alerts - If you change A/B/C points, delete old alert and create new one
───────────────────────────────────────────
📊 PREFER MANUAL TRADING?
Skip 3Commas entirely and use the indicator for planning only:
♦ Watch Trade Plan table for ✓✓✓✓✓ alignment
♦ Manually place limit orders at displayed prices
♦ Manually move stop loss as EXIT price updates
♦ Manually close when EXIT signal fires
Benefits: Full control, no API concerns, can override based on context
Drawbacks: Must watch chart constantly, emotions can interfere, may miss signals
───────────────────────────────────────────
✅ FINAL CHECKLIST BEFORE LIVE TRADING
✓ Both Signal Bots created (Long + Short)
✓ Entry Orders: Volume = "Send in webhook, quote"
✓ Exit Orders: Volume = "100 Position %"
✓ Take Profit and Stop Loss disabled in bots
✓ Bot UUIDs and Secret entered in indicator
✓ TradingView alert created with correct webhook
✓ Alert frequency = "Once Per Bar Close"
✓ Alert status shows "Active"
✓ Tested with small amounts successfully
✓ Trade Plan table shows ✅ (no validation errors)
✓ Understand your risk per trade
Once all checked: You're ready for automated pyramiding execution.
━━━━━━━━━━━━━━━━━━━━━━━━━━━━━━━━━━━━━━━━━━━
💡 KEY REMINDERS - BEFORE YOU TRADE
💬 "The speculator's chief enemies are always boring from within. It is inseparable from human nature to hope and to fear."
— Jesse Livermore
───────────────────────────────────────────
⚠️ COMMON MISTAKES (AVOID THESE)
Mapping Incomplete Waves
♦ Point C must be in the PAST (completed retrace, not currently forming)
♦ Don't map a wave that's still developing - wait for confirmation
♦ Minimum requirements: 5% impulse (A→B), 3% retrace (B→C)
Ignoring Validation Warnings
♦ Never create alerts when status shows ✗ (red) or ⚠️ (yellow)
♦ Fix all errors first: dates in order, budget = 100%, valid wave structure
♦ Common issues: dates in future, Point C above B (longs) or below B (shorts)
Premature Manual Entries
♦ Don't enter just because price touched the level
♦ Wait for ALL ✓✓✓✓✓ (or ✓✓✓✓✓✓) to align in Trade Plan table
♦ Patience pays - partial confluence = partial edge = higher risk of losing trades
Wrong Timeframe Selection
♦ Avoid: 15m, 5m, 1m (too much noise, false signals)
♦ Use: 1H, 4H, Daily (cleaner structure, better confluence)
♦ Lower timeframes require faster decisions and produce more whipsaws
Over-Risking Capital
♦ Trade budget ≠ Account size
♦ Never risk capital you can't afford to lose
♦ One bad trade should NOT destroy your account
───────────────────────────────────────────
✅ LIVERMORE PRINCIPLES IN ACTION
Confirmation > Prediction
♦ Don't predict where price will go
♦ Wait for price to INDICATE direction via pivots + volume + trend
♦ Test first (BO 20%), build only when confirmed (POs 80%)
💬 "A man must believe in himself and his judgment if he expects to make a living at this game."
Pyramid on Strength, Never Weakness
♦ Add only when: 3 closes + clean candles + volume + pivot breaks
♦ Never average down (DCA into losers)
♦ If BO wrong, take small loss fast - don't hope and add more
💬 "Never buy a stock because it has had a big decline from its previous high."
Respect Market Structure
♦ Pivots = where smart money previously acted (support/resistance)
♦ Breaking them = momentum overcoming barriers
♦ Entering before pivot break = entering into known rejection zones
Trend is Your Friend
♦ Never pyramid against the trend
♦ If trend shifts to Uncertain or reverses → no new entries
♦ Exit when trend proves you wrong (don't fight it)
💬 "I never argue with the tape. Getting sore at the market doesn't get you anywhere."
Discipline > Emotion
♦ Can't "almost" have all conditions met
♦ Either 100% aligned (all ✓) or you wait
♦ No exceptions, no "this time is different"
♦ Automation designed to help remove emotion - consider using 3Commas
💬 "It never was my thinking that made the big money for me. It always was my sitting."
───────────────────────────────────────────
🎯 FINAL THOUGHT
This indicator is a SYSTEMATIC FRAMEWORK, not a magic solution. It translates Livermore's century-old principles into actionable rules:
♦ Test small, build big
♦ Add to winners, cut losers fast
♦ Let structure guide exits
♦ Stay disciplined when emotions scream
The market will test your patience, discipline, and conviction. The indicator aims to reduce guesswork - but YOU still need to:
♦ Find valid wave structures
♦ Choose appropriate market conditions
♦ Size positions properly
♦ Accept losses as part of the game
💬 "The game of speculation is the most uniformly fascinating game in the world. But it is not a game for the stupid, the mentally lazy, the person of inferior emotional balance, or the get-rich-quick adventurer."
— Jesse Livermore
Penunjuk Pine Script®

Luxy Momentum, Trend, Bias and Breakout Indicators V7
TABLE OF CONTENTS
This is Version 7 (V7) - the latest and most optimized release. If you are using any older versions (V6, V5, V4, V3, etc.), it is highly recommended to replace them with V7.
Why This Indicator is Different
Who Should Use This
Core Components Overview
The UT Bot Trading System
Understanding the Market Bias Table
Candlestick Pattern Recognition
Visual Tools and Features
How to Use the Indicator
Performance and Optimization
FAQ
---
### CREDITS & ATTRIBUTION
This indicator implements proven trading concepts using entirely original code developed specifically for this project.
### CONCEPTUAL FOUNDATIONS
• UT Bot ATR Trailing System
- Original concept by @QuantNomad: (search "UT-Bot-Strategy"
- Our version is a complete reimplementation with significant enhancements:
- Volume-weighted momentum adjustment
- Composite stop loss from multiple S/R layers
- Multi-filter confirmation system (swing, %, 2-bar, ZLSMA)
- Full integration with multi-timeframe bias table
- Visual audit trail with freeze-on-touch
- NOTE: No code was copied - this is a complete reimplementation with enhancements.
• Standard Technical Indicators (Public Domain Formulas):
- Supertrend: ATR-based trend calculation with custom gradient fills
- MACD: Gerald Appel's formula with separation filters
- RSI: J. Welles Wilder's formula with pullback zone logic
- ADX/DMI: Custom trend strength formula inspired by Wilder's directional movement concept, reimplemented with volume weighting and efficiency metrics
- ZLSMA: Zero-lag formula enhanced with Hull MA and momentum prediction
### Custom Implementations
- Trend Strength: Inspired by Wilder's ADX concept but using volume-weighted pressure calculation and efficiency metrics (not traditional +DI/-DI smoothing)
- All code implementations are original
### ORIGINAL FEATURES (70%+ of codebase)
- Multi-Timeframe Bias Table with live updates
- Risk Management System (R-multiple TPs, freeze-on-touch)
- Opening Range Breakout tracker with session management
- Composite Stop Loss calculator using 6+ S/R layers
- Performance optimization system (caching, conditional calcs)
- VIX Fear Index integration
- Previous Day High/Low auto-detection
- Candlestick pattern recognition with interactive tooltips
- Smart label and visual management
- All UI/UX design and table architecture
### DEVELOPMENT PROCESS
**AI Assistance:** This indicator was developed over 2+ months with AI assistance (ChatGPT/Claude) used for:
- Writing Pine Script code based on design specifications
- Optimizing performance and fixing bugs
- Ensuring Pine Script v6 compliance
- Generating documentation
**Author's Role:** All trading concepts, system design, feature selection, integration logic, and strategic decisions are original work by the author. The AI was a coding tool, not the system designer.
**Transparency:** We believe in full disclosure - this project demonstrates how AI can be used as a powerful development tool while maintaining creative and strategic ownership.
---
1. WHY THIS INDICATOR IS DIFFERENT
Most traders use multiple separate indicators on their charts, leading to cluttered screens, conflicting signals, and analysis paralysis. The Suite solves this by integrating proven technical tools into a single, cohesive system.
Key Advantages:
All-in-One Design: Instead of loading 5-10 separate indicators, you get everything in one optimized script. This reduces chart clutter and improves TradingView performance.
Multi-Timeframe Bias Table: Unlike standard indicators that only show the current timeframe, the Bias Table aggregates trend signals across multiple timeframes simultaneously. See at a glance whether 1m, 5m, 15m, 1h are aligned bullish or bearish - no more switching between charts.
Smart Confirmations: The indicator doesn't just give signals - it shows you WHY. Every entry has multiple layers of confirmation (MA cross, MACD momentum, ADX strength, RSI pullback, volume, etc.) that you can toggle on/off.
Dynamic Stop Loss System: Instead of static ATR stops, the SL is calculated from multiple support/resistance layers: UT trailing line, Supertrend, VWAP, swing structure, and MA levels. This creates more intelligent, price-action-aware stops.
R-Multiple Take Profits: Built-in TP system calculates targets based on your initial risk (1R, 1.5R, 2R, 3R). Lines freeze when touched with visual checkmarks, giving you a clean audit trail of partial exits.
Educational Tooltips Everywhere: Every single input has detailed tooltips explaining what it does, typical values, and how it impacts trading. You're not guessing - you're learning as you configure.
Performance Optimized: Smart caching, conditional calculations, and modular design mean the indicator runs fast despite having 15+ features. Turn off what you don't use for even better performance.
No Repainting: All signals respect bar close. Alerts fire correctly. What you see in history is what you would have gotten in real-time.
What Makes It Unique:
Integrated UT Bot + Bias Table: No other indicator combines UT Bot's ATR trailing system with a live multi-timeframe dashboard. You get precision entries with macro trend context.
Candlestick Pattern Recognition with Interactive Tooltips: Patterns aren't just marked - hover over any emoji for a full explanation of what the pattern means and how to trade it.
Opening Range Breakout Tracker: Built-in ORB system for intraday traders with customizable session times and real-time status updates in the Bias Table.
Previous Day High/Low Auto-Detection: Automatically plots PDH/PDL on intraday charts with theme-aware colors. Updates daily without manual input.
Dynamic Row Labels in Bias Table: The table shows your actual settings (e.g., "EMA 10 > SMA 20") not generic labels. You know exactly what's being evaluated.
Modular Filter System: Instead of forcing a fixed methodology, the indicator lets you build your own strategy. Start with just UT Bot, add filters one at a time, test what works for your style.
---
2. WHO WHOULD USE THIS
Designed For:
Intermediate to Advanced Traders: You understand basic technical analysis (MAs, RSI, MACD) and want to combine multiple confirmations efficiently. This isn't a "one-click profit" system - it's a professional toolkit.
Multi-Timeframe Traders: If you trade one asset but check multiple timeframes for confirmation (e.g., enter on 5m after checking 15m and 1h alignment), the Bias Table will save you hours every week.
Trend Followers: The indicator excels at identifying and following trends using UT Bot, Supertrend, and MA systems. If you trade breakouts and pullbacks in trending markets, this is built for you.
Intraday and Swing Traders: Works equally well on 5m-1h charts (day trading) and 4h-D charts (swing trading). Scalpers can use it too with appropriate settings adjustments.
Discretionary Traders: This isn't a black-box system. You see all the components, understand the logic, and make final decisions. Perfect for traders who want tools, not automation.
Works Across All Markets:
Stocks (US, international)
Cryptocurrency (24/7 markets supported)
Forex pairs
Indices (SPY, QQQ, etc.)
Commodities
NOT Ideal For :
Complete Beginners: If you don't know what a moving average or RSI is, start with basics first. This indicator assumes foundational knowledge.
Algo Traders Seeking Black Box: This is discretionary. Signals require context and confirmation. Not suitable for blind automated execution.
Mean-Reversion Only Traders: The indicator is trend-following at its core. While VWAP bands support mean-reversion, the primary methodology is trend continuation.
---
3. CORE COMPONENTS OVERVIEW
The indicator combines these proven systems:
Trend Analysis:
Moving Averages: Four customizable MAs (Fast, Medium, Medium-Long, Long) with six types to choose from (EMA, SMA, WMA, VWMA, RMA, HMA). Mix and match for your style.
Supertrend: ATR-based trend indicator with unique gradient fill showing trend strength. One-sided ribbon visualization makes it easier to see momentum building or fading.
ZLSMA : Zero-lag linear-regression smoothed moving average. Reduces lag compared to traditional MAs while maintaining smooth curves.
Momentum & Filters:
MACD: Standard MACD with separation filter to avoid weak crossovers.
RSI: Pullback zone detection - only enter longs when RSI is in your defined "buy zone" and shorts in "sell zone".
ADX/DMI: Trend strength measurement with directional filter. Ensures you only trade when there's actual momentum.
Volume Filter: Relative volume confirmation - require above-average volume for entries.
Donchian Breakout: Optional channel breakout requirement.
Signal Systems:
UT Bot: The primary signal generator. ATR trailing stop that adapts to volatility and gives clear entry/exit points.
Base Signals: MA cross system with all the above filters applied. More conservative than UT Bot alone.
Market Bias Table: Multi-timeframe dashboard showing trend alignment across 7 timeframes plus macro bias (3-day, weekly, monthly, quarterly, VIX).
Candlestick Patterns: Six major reversal patterns auto-detected with interactive tooltips.
ORB Tracker: Opening range high/low with breakout status (intraday only).
PDH/PDL: Previous day levels plotted automatically on intraday charts.
VWAP + Bands : Session-anchored VWAP with up to three standard deviation band pairs.
---
4. THE UT BOT TRADING SYSTEM
The UT Bot is the heart of the indicator's signal generation. It's an advanced ATR trailing stop that adapts to market volatility.
Why UT Bot is Superior to Fixed Stops:
Traditional ATR stops use a fixed multiplier (e.g., "stop = entry - 2×ATR"). UT Bot is smarter:
It TRAILS the stop as price moves in your favor
It WIDENS during high volatility to avoid premature stops
It TIGHTENS during consolidation to lock in profits
It FLIPS when price breaks the trailing line, signaling reversals
Visual Elements You'll See:
Orange Trailing Line: The actual UT stop level that adapts bar-by-bar
Buy/Sell Labels: Aqua triangle (long) or orange triangle (short) when the line flips
ENTRY Line: Horizontal line at your entry price (optional, can be turned off)
Suggested Stop Loss: A composite SL calculated from multiple support/resistance layers:
- UT trailing line
- Supertrend level
- VWAP
- Swing structure (recent lows/highs)
- Long-term MA (200)
- ATR-based floor
Take Profit Lines: TP1, TP1.5, TP2, TP3 based on R-multiples. When price touches a TP, it's marked with a checkmark and the line freezes for audit trail purposes.
Status Messages: "SL Touched ❌" or "SL Frozen" when the trade leg completes.
How UT Bot Differs from Other ATR Systems:
Multiple Filters Available: You can require 2-bar confirmation, minimum % price change, swing structure alignment, or ZLSMA directional filter. Most UT implementations have none of these.
Smart SL Calculation: Instead of just using the UT line as your stop, the indicator suggests a better SL based on actual support/resistance. This prevents getting stopped out by wicks while keeping risk controlled.
Visual Audit Trail: All SL/TP lines freeze when touched with clear markers. You can review your trades weeks later and see exactly where entries, stops, and targets were.
Performance Options: "Draw UT visuals only on bar close" lets you reduce rendering load without affecting logic or alerts - critical for slower machines or 1m charts.
Trading Logic:
UT Bot flips direction (Buy or Sell signal appears)
Check Bias Table for multi-timeframe confirmation
Optional: Wait for Base signal or candlestick pattern
Enter at signal bar close or next bar open
Place stop at "Suggested Stop Loss" line
Scale out at TP levels (TP1, TP2, TP3)
Exit remaining position on opposite UT signal or stop hit
---
5. UNDERSTANDING THE MARKET BIAS TABLE
This is the indicator's unique multi-timeframe intelligence layer. Instead of looking at one chart at a time, the table aggregates signals across seven timeframes plus macro trend bias.
Why Multi-Timeframe Analysis Matters:
Professional traders check higher and lower timeframes for context:
Is the 1h uptrend aligning with my 5m entry?
Are all short-term timeframes bullish or just one?
Is the daily trend supportive or fighting me?
Doing this manually means opening multiple charts, checking each indicator, and making mental notes. The Bias Table does it automatically in one glance.
Table Structure:
Header Row:
On intraday charts: 1m, 5m, 15m, 30m, 1h, 2h, 4h (toggle which ones you want)
On daily+ charts: D, W, M (automatic)
Green dot next to title = live updating
Headline Rows - Macro Bias:
These show broad market direction over longer periods:
3 Day Bias: Trend over last 3 trading sessions (uses 1h data)
Weekly Bias: Trend over last 5 trading sessions (uses 4h data)
Monthly Bias: Trend over last 30 daily bars
Quarterly Bias: Trend over last 13 weekly bars
VIX Fear Index: Market regime based on VIX level - bullish when low, bearish when high
Opening Range Breakout: Status of price vs. session open range (intraday only)
These rows show text: "BULLISH", "BEARISH", or "NEUTRAL"
Indicator Rows - Technical Signals:
These evaluate your configured indicators across all active timeframes:
Fast MA > Medium MA (shows your actual MA settings, e.g., "EMA 10 > SMA 20")
Price > Long MA (e.g., "Price > SMA 200")
Price > VWAP
MACD > Signal
Supertrend (up/down/neutral)
ZLSMA Rising
RSI In Zone
ADX ≥ Minimum
These rows show emojis: GREEB (bullish), RED (bearish), GRAY/YELLOW (neutral/NA)
AVG Column:
Shows percentage of active timeframes that are bullish for that row. This is the KEY metric:
AVG > 70% = strong multi-timeframe bullish alignment
AVG 40-60% = mixed/choppy, no clear trend
AVG < 30% = strong multi-timeframe bearish alignment
How to Use the Table:
For a long trade:
Check AVG column - want to see > 60% ideally
Check headline bias rows - want to see BULLISH, not BEARISH
Check VIX row - bullish market regime preferred
Check ORB row (intraday) - want ABOVE for longs
Scan indicator rows - more green = better confirmation
For a short trade:
Check AVG column - want to see < 40% ideally
Check headline bias rows - want to see BEARISH, not BULLISH
Check VIX row - bearish market regime preferred
Check ORB row (intraday) - want BELOW for shorts
Scan indicator rows - more red = better confirmation
When AVG is 40-60%:
Market is choppy, mixed signals. Either stay out or reduce position size significantly. These are low-probability environments.
Unique Features:
Dynamic Labels: Row names show your actual settings (e.g., "EMA 10 > SMA 20" not generic "Fast > Slow"). You know exactly what's being evaluated.
Customizable Rows: Turn off rows you don't care about. Only show what matters to your strategy.
Customizable Timeframes: On intraday charts, disable 1m or 4h if you don't trade them. Reduces calculation load by 20-40%.
Automatic HTF Handling: On Daily/Weekly/Monthly charts, the table automatically switches to D/W/M columns. No configuration needed.
Performance Smart: "Hide BIAS table on 1D or above" option completely skips all table calculations on higher timeframes if you only trade intraday.
---
6. CANDLESTICK PATTERN RECOGNITION
The indicator automatically detects six major reversal patterns and marks them with emojis at the relevant bars.
Why These Six Patterns:
These are the most statistically significant reversal patterns according to trading literature:
High win rate when appearing at support/resistance
Clear visual structure (not subjective)
Work across all timeframes and assets
Studied extensively by institutions
The Patterns:
Bullish Patterns (appear at bottoms):
Bullish Engulfing: Green candle completely engulfs prior red candle's body. Strong reversal signal.
Hammer: Small body with long lower wick (at least 2× body size). Shows rejection of lower prices by buyers.
Morning Star: Three-candle pattern (large red → small indecision → large green). Very strong bottom reversal.
Bearish Patterns (appear at tops):
Bearish Engulfing: Red candle completely engulfs prior green candle's body. Strong reversal signal.
Shooting Star: Small body with long upper wick (at least 2× body size). Shows rejection of higher prices by sellers.
Evening Star: Three-candle pattern (large green → small indecision → large red). Very strong top reversal.
Interactive Tooltips:
Unlike most pattern indicators that just draw shapes, this one is educational:
Hover your mouse over any pattern emoji
A tooltip appears explaining: what the pattern is, what it means, when it's most reliable, and how to trade it
No need to memorize - learn as you trade
Noise Filter:
"Min candle body % to filter noise" setting prevents false signals:
Patterns require minimum body size relative to price
Filters out tiny candles that don't represent real buying/selling pressure
Adjust based on asset volatility (higher % for crypto, lower for low-volatility stocks)
How to Trade Patterns:
Patterns are NOT standalone entry signals. Use them as:
Confirmation: UT Bot gives signal + pattern appears = stronger entry
Reversal Warning: In a trade, opposite pattern appears = consider tightening stop or taking profit
Support/Resistance Validation: Pattern at key level (PDH, VWAP, MA 200) = level is being respected
Best combined with:
UT Bot or Base signal in same direction
Bias Table alignment (AVG > 60% or < 40%)
Appearance at obvious support/resistance
---
7. VISUAL TOOLS AND FEATURES
VWAP (Volume Weighted Average Price):
Session-anchored VWAP with standard deviation bands. Shows institutional "fair value" for the trading session.
Anchor Options: Session, Day, Week, Month, Quarter, Year. Choose based on your trading timeframe.
Bands: Up to three pairs (X1, X2, X3) showing statistical deviation. Price at outer bands often reverses.
Auto-Hide on HTF: VWAP hides on Daily/Weekly/Monthly charts automatically unless you enable anchored mode.
Use VWAP as:
Directional bias (above = bullish, below = bearish)
Mean reversion levels (outer bands)
Support/resistance (the VWAP line itself)
Previous Day High/Low:
Automatically plots yesterday's high and low on intraday charts:
Updates at start of each new trading day
Theme-aware colors (dark text for light charts, light text for dark charts)
Hidden automatically on Daily/Weekly/Monthly charts
These levels are critical for intraday traders - institutions watch them closely as support/resistance.
Opening Range Breakout (ORB):
Tracks the high/low of the first 5, 15, 30, or 60 minutes of the trading session:
Customizable session times (preset for NYSE, LSE, TSE, or custom)
Shows current breakout status in Bias Table row (ABOVE, BELOW, INSIDE, BUILDING)
Intraday only - auto-disabled on Daily+ charts
ORB is a classic day trading strategy - breakout above opening range often leads to continuation.
Extra Labels:
Change from Open %: Shows how far price has moved from session open (intraday) or daily open (HTF). Green if positive, red if negative.
ADX Badge: Small label at bottom of last bar showing current ADX value. Green when above your minimum threshold, red when below.
RSI Badge: Small label at top of last bar showing current RSI value with zone status (buy zone, sell zone, or neutral).
These labels provide quick at-a-glance confirmation without needing separate indicator windows.
---
8. HOW TO USE THE INDICATOR
Step 1: Add to Chart
Load the indicator on your chosen asset and timeframe
First time: Everything is enabled by default - the chart will look busy
Don't panic - you'll turn off what you don't need
Step 2: Start Simple
Turn OFF everything except:
UT Bot labels (keep these ON)
Bias Table (keep this ON)
Moving Averages (Fast and Medium only)
Suggested Stop Loss and Take Profits
Hide everything else initially. Get comfortable with the basic UT Bot + Bias Table workflow first.
Step 3: Learn the Core Workflow
UT Bot gives a Buy or Sell signal
Check Bias Table AVG column - do you have multi-timeframe alignment?
If yes, enter the trade
Place stop at Suggested Stop Loss line
Scale out at TP levels
Exit on opposite UT signal
Trade this simple system for a week. Get a feel for signal frequency and win rate with your settings.
Step 4: Add Filters Gradually
If you're getting too many losing signals (whipsaws in choppy markets), add filters one at a time:
Try: "Require 2-Bar Trend Confirmation" - wait for 2 bars to confirm direction
Try: ADX filter with minimum threshold - only trade when trend strength is sufficient
Try: RSI pullback filter - only enter on pullbacks, not chasing
Try: Volume filter - require above-average volume
Add one filter, test for a week, evaluate. Repeat.
Step 5: Enable Advanced Features (Optional)
Once you're profitable with the core system, add:
Supertrend for additional trend confirmation
Candlestick patterns for reversal warnings
VWAP for institutional anchor reference
ORB for intraday breakout context
ZLSMA for low-lag trend following
Step 6: Optimize Settings
Every setting has a detailed tooltip explaining what it does and typical values. Hover over any input to read:
What the parameter controls
How it impacts trading
Suggested ranges for scalping, day trading, and swing trading
Start with defaults, then adjust based on your results and style.
Step 7: Set Up Alerts
Right-click chart → Add Alert → Condition: "Luxy Momentum v6" → Choose:
"UT Bot — Buy" for long entries
"UT Bot — Sell" for short entries
"Base Long/Short" for filtered MA cross signals
Optionally enable "Send real-time alert() on UT flip" in settings for immediate notifications.
Common Workflow Variations:
Conservative Trader:
UT signal + Base signal + Candlestick pattern + Bias AVG > 70%
Enter only at major support/resistance
Wider UT sensitivity, multiple filters
Aggressive Trader:
UT signal + Bias AVG > 60%
Enter immediately, no waiting
Tighter UT sensitivity, minimal filters
Swing Trader:
Focus on Daily/Weekly Bias alignment
Ignore intraday noise
Use ORB and PDH/PDL less (or not at all)
Wider stops, patient approach
---
9. PERFORMANCE AND OPTIMIZATION
The indicator is optimized for speed, but with 15+ features running simultaneously, chart load time can add up. Here's how to keep it fast:
Biggest Performance Gains:
Disable Unused Timeframes: In "Time Frames" settings, turn OFF any timeframe you don't actively trade. Each disabled TF saves 10-15% calculation time. If you only day trade 5m, 15m, 1h, disable 1m, 2h, 4h.
Hide Bias Table on Daily+: If you only trade intraday, enable "Hide BIAS table on 1D or above". This skips ALL table calculations on higher timeframes.
Draw UT Visuals Only on Bar Close: Reduces intrabar rendering of SL/TP/Entry lines. Has ZERO impact on logic or alerts - purely visual optimization.
Additional Optimizations:
Turn off VWAP bands if you don't use them
Disable candlestick patterns if you don't trade them
Turn off Supertrend fill if you find it distracting (keep the line)
Reduce "Limit to 10 bars" for SL/TP lines to minimize line objects
Performance Features Built-In:
Smart Caching: Higher timeframe data (3-day bias, weekly bias, etc.) updates once per day, not every bar
Conditional Calculations: Volume filter only calculates when enabled. Swing filter only runs when enabled. Nothing computes if turned off.
Modular Design: Every component is independent. Turn off what you don't need without breaking other features.
Typical Load Times:
5m chart, all features ON, 7 timeframes: ~2-3 seconds
5m chart, core features only, 3 timeframes: ~1 second
1m chart, all features: ~4-5 seconds (many bars to calculate)
If loading takes longer, you likely have too many indicators on the chart total (not just this one).
---
10. FAQ
Q: How is this different from standard UT Bot indicators?
A: Standard UT Bot (originally by @QuantNomad) is just the ATR trailing line and flip signals. This implementation adds:
- Volume weighting and momentum adjustment to the trailing calculation
- Multiple confirmation filters (swing, %, 2-bar, ZLSMA)
- Smart composite stop loss system from multiple S/R layers
- R-multiple take profit system with freeze-on-touch
- Integration with multi-timeframe Bias Table
- Visual audit trail with checkmarks
Q: Can I use this for automated trading?
A: The indicator is designed for discretionary trading. While it has clear signals and alerts, it's not a mechanical system. Context and judgment are required.
Q: Does it repaint?
A: No. All signals respect bar close. UT Bot logic runs intrabar but signals only trigger on confirmed bars. Alerts fire correctly with no lookahead.
Q: Do I need to use all the features?
A: Absolutely not. The indicator is modular. Many profitable traders use just UT Bot + Bias Table + Moving Averages. Start simple, add complexity only if needed.
Q: How do I know which settings to use?
A: Every single input has a detailed tooltip. Hover over any setting to see:
What it does
How it affects trading
Typical values for scalping, day trading, swing trading
Start with defaults, adjust gradually based on results.
Q: Can I use this on crypto 24/7 markets?
A: Yes. ORB will not work (no defined session), but everything else functions normally. Use "Day" anchor for VWAP instead of "Session".
Q: The Bias Table is blank or not showing.
A: Check:
"Show Table" is ON
Table position isn't overlapping another indicator's table (change position)
At least one row is enabled
"Hide BIAS table on 1D or above" is OFF (if on Daily+ chart)
Q: Why are candlestick patterns not appearing?
A: Patterns are relatively rare by design - they only appear at genuine reversal points. Check:
Pattern toggles are ON
"Min candle body %" isn't too high (try 0.05-0.10)
You're looking at a chart with actual reversals (not strong trending market)
Q: UT Bot is too sensitive/not sensitive enough.
A: Adjust "Sensitivity (Key×ATR)". Lower number = tighter stop, more signals. Higher number = wider stop, fewer signals. Read the tooltip for guidance.
Q: Can I get alerts for the Bias Table?
A: The Bias Table is a dashboard for visual analysis, not a signal generator. Set alerts on UT Bot or Base signals, then manually check Bias Table for confirmation.
Q: Does this work on stocks with low volume?
A: Yes, but turn OFF the volume filter. Low volume stocks will never meet relative volume requirements.
Q: How often should I check the Bias Table?
A: Before every entry. It takes 2 seconds to glance at the AVG column and headline rows. This one check can save you from fighting the trend.
Q: What if UT signal and Base signal disagree?
A: UT Bot is more aggressive (ATR trailing). Base signals are more conservative (MA cross + filters). If they disagree, either:
Wait for both to align (safest)
Take the UT signal but with smaller size (aggressive)
Skip the trade (conservative)
There's no "right" answer - depends on your risk tolerance.
---
FINAL NOTES
The indicator gives you an edge. How you use that edge determines results.
For questions, feedback, or support, comment on the indicator page or message the author.
Happy Trading!
Penunjuk Pine Script®
