LoFi EMA version 1.3aLoFi EMA version 1.3a
The goal of this indicator is to plot rsi , ema values on any chart. You can also adjust it for larger time frames. Repainting issues have been fixed and updated to pine version 4.0
The script is currently under development and additional updates will be added based on performance from a 24/7 active bot that is using this on 1hr, 4hr, 12hr and daily time frames. This can also be used for degen trading on the 2 min chart. The output may vary slightly between different chart time frames for the same indicator settings.
This is an "Invite Only" script. Contact me for details.
User Interface/Detail Description:
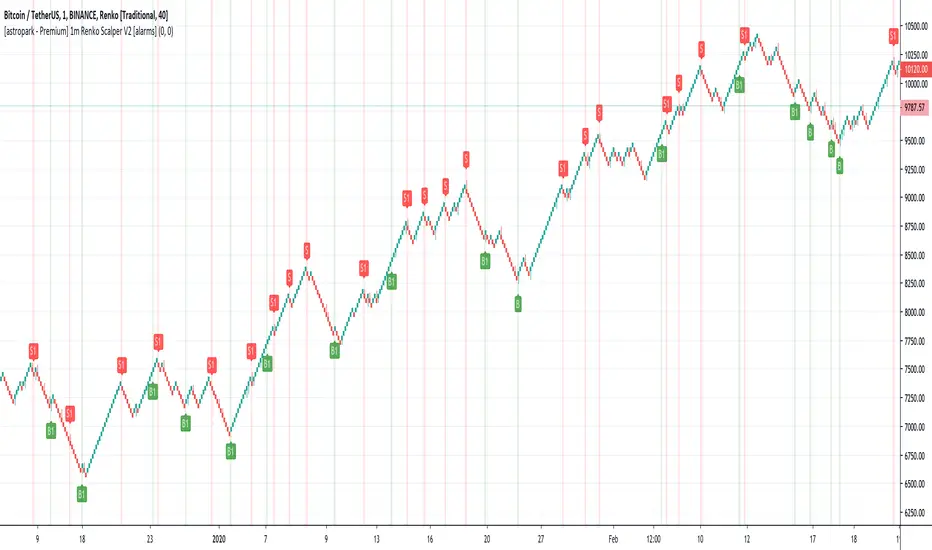
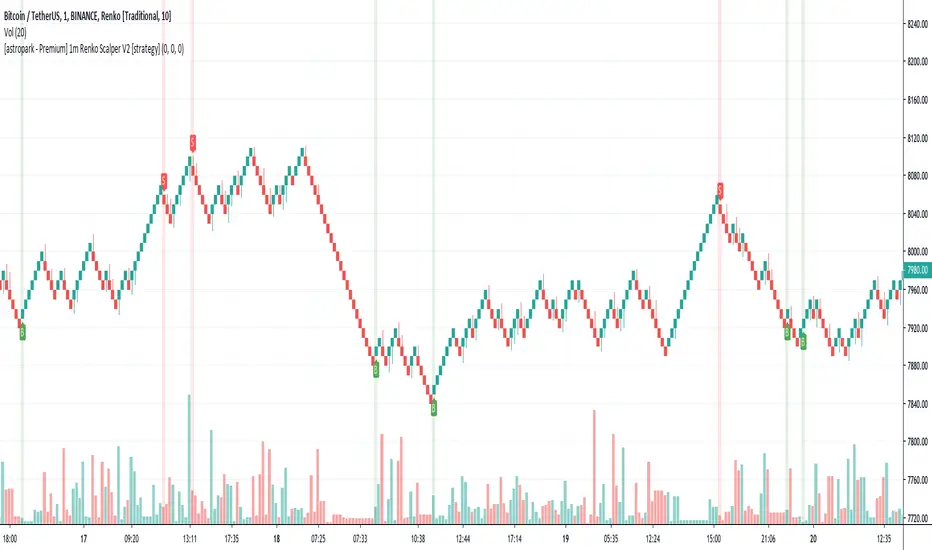
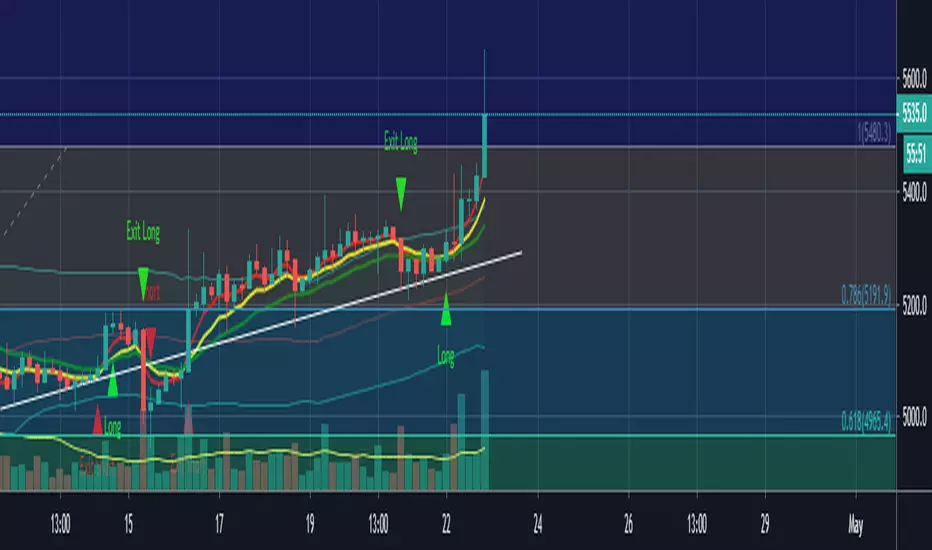
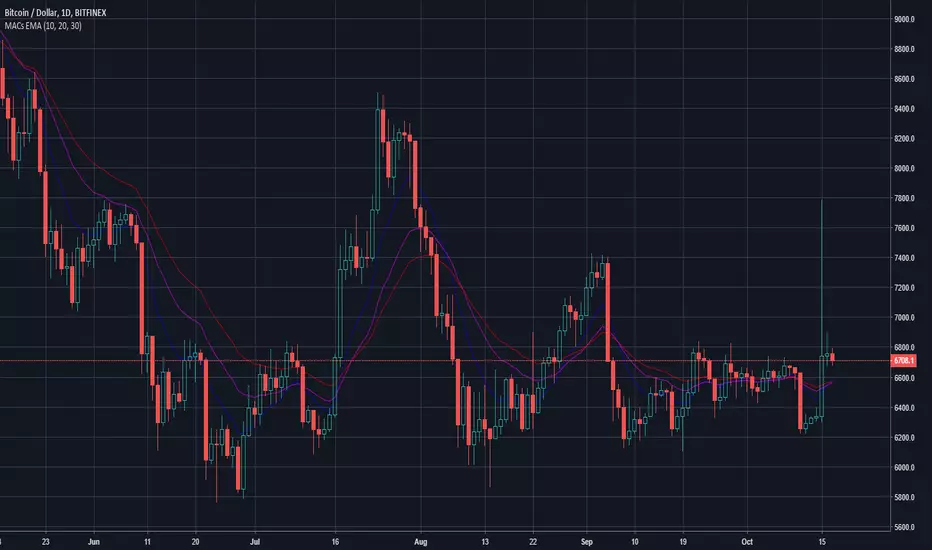
- Green Bar= Buy
- Red BAR = Sell
This indicator can be easily used with popular bot trading platforms. Feel free to contact me for details.
Can be used for all Charts
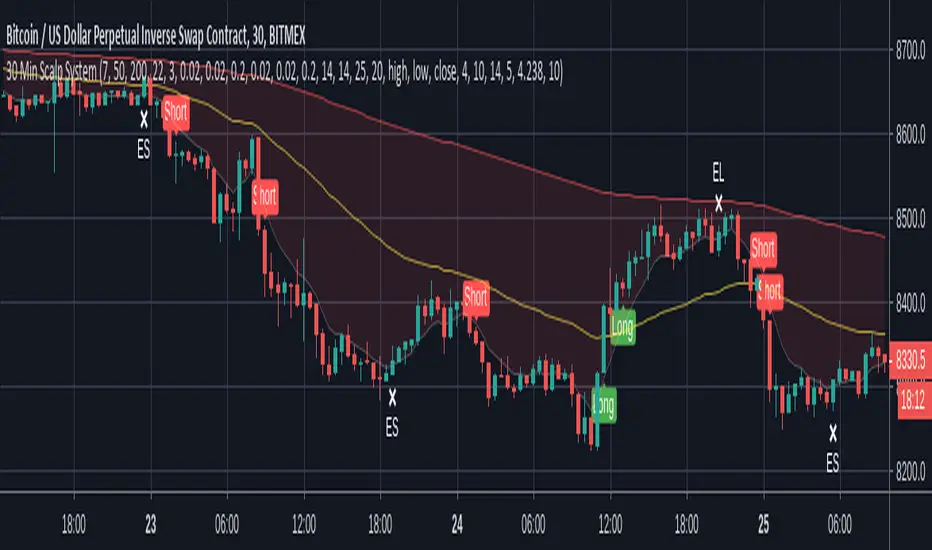
Basic Entry Chart Layout:
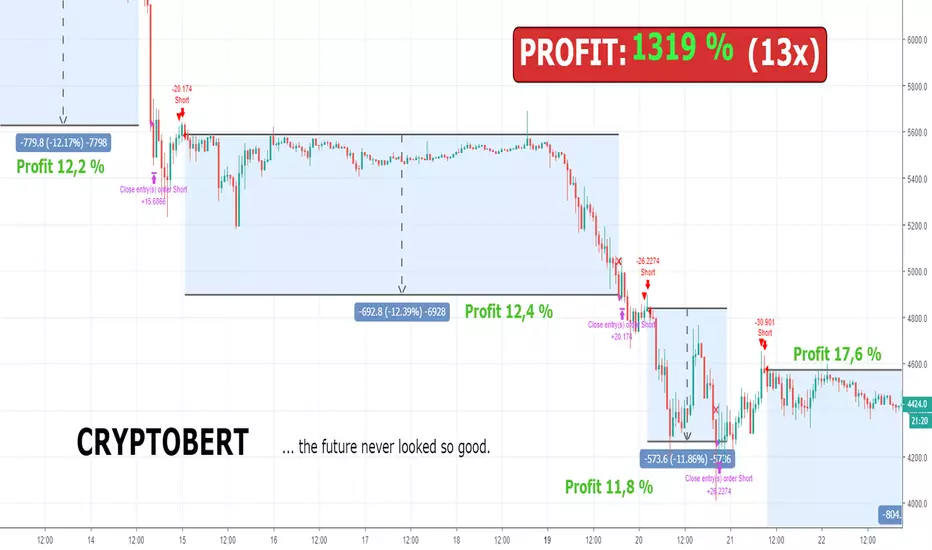
BITMEX:
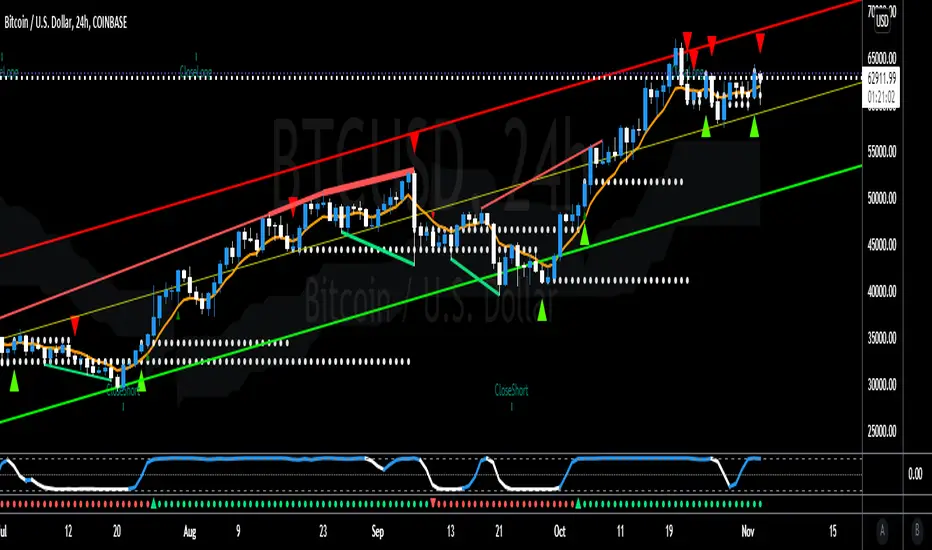
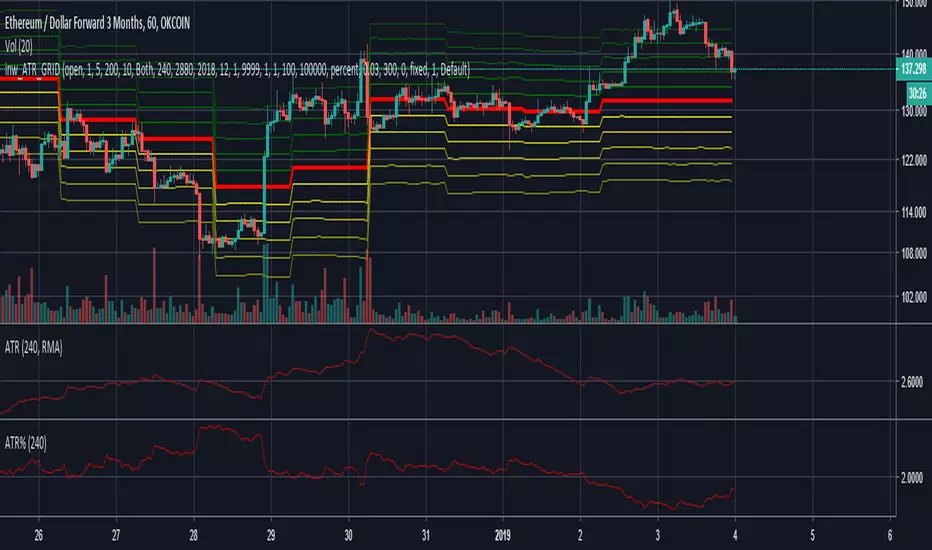
BITCOIN:
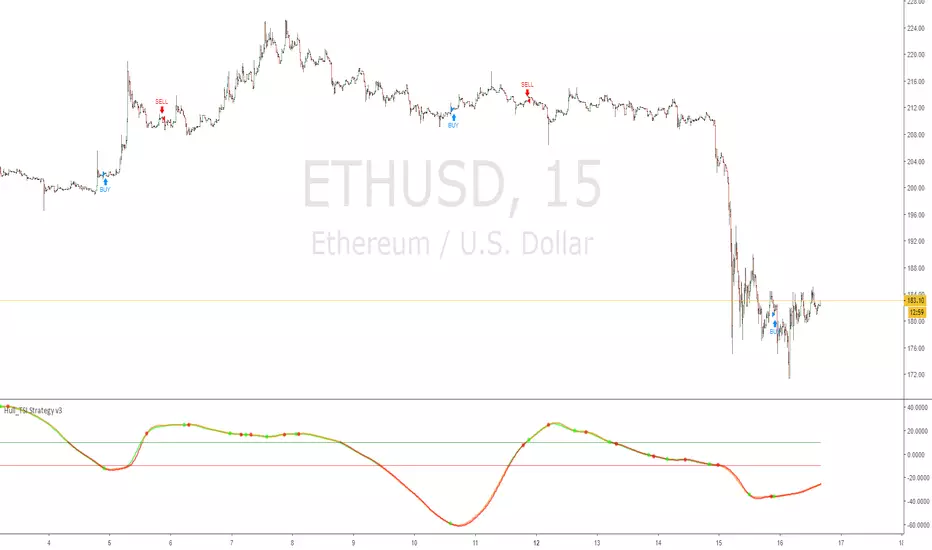
FOREX:
LEGACY:/ STOCKS:
Penunjuk Pine Script®