MACs EasyMoney - Advanced BOT VersionHi All,
Publishing the new version of "Advanced BOT Indicator", with some major code changes/updates to Take Profits signals.
(Implementing this Take Profits part is highly competitive and challenging code architecture)
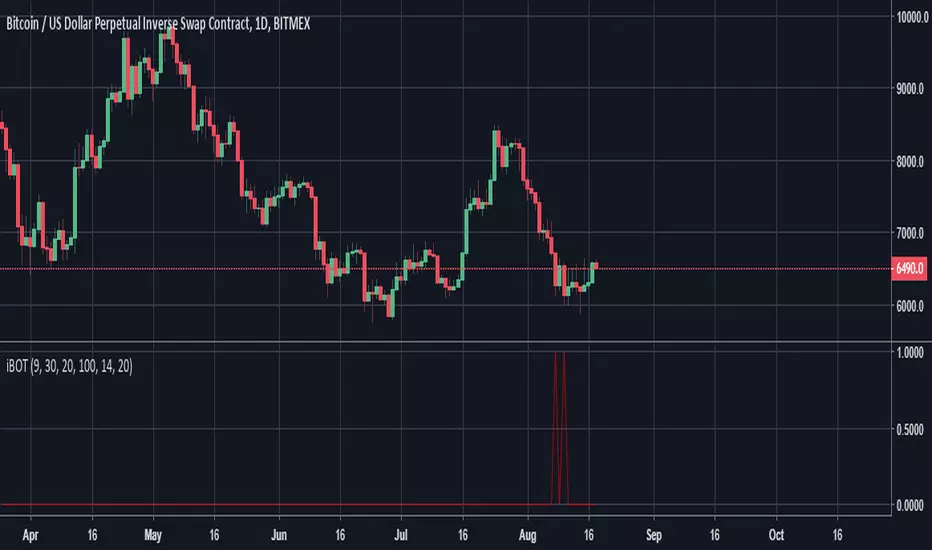
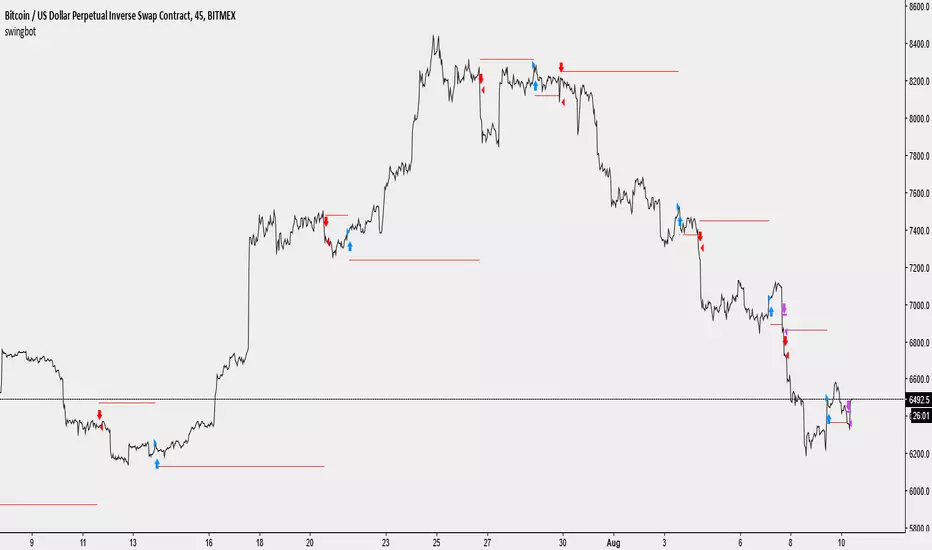
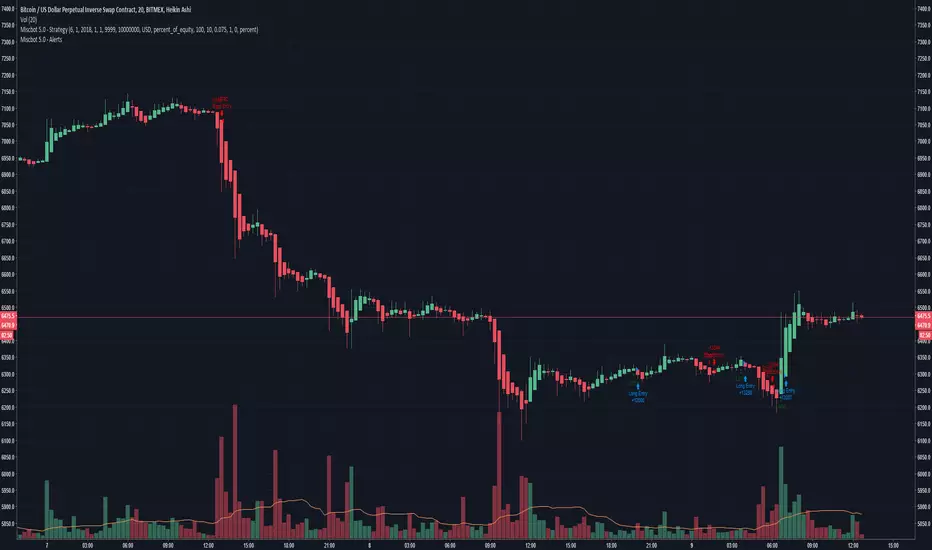
BITMEX:XBTUSD
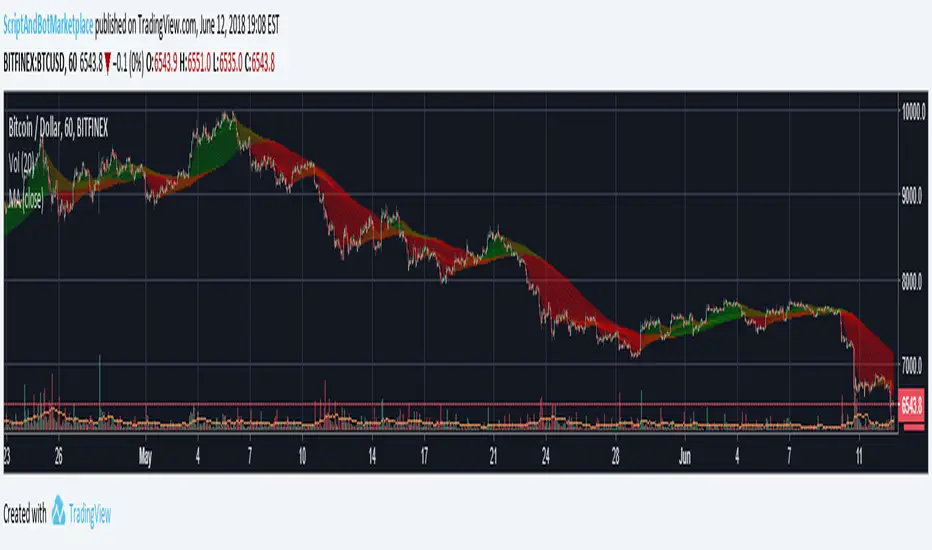
BITFINEX:BTCUSD
=============================================================================================
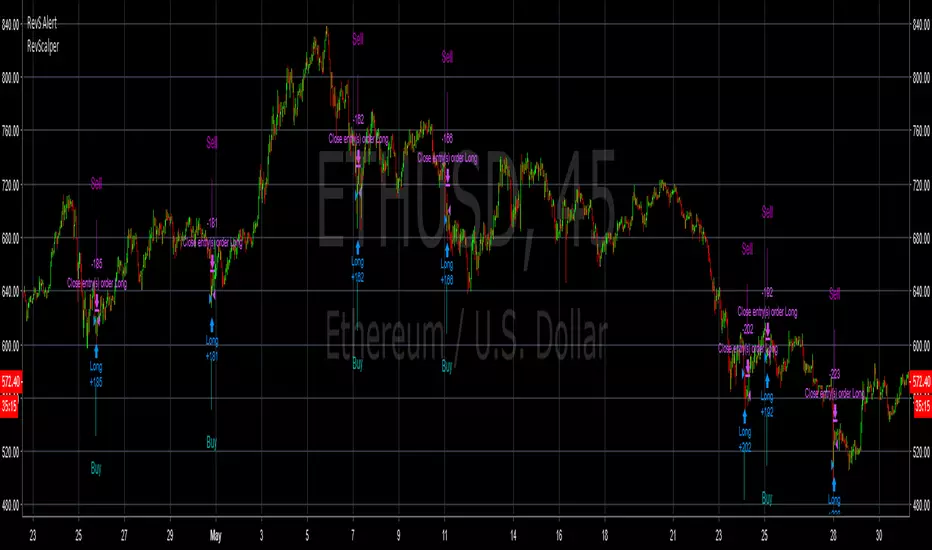
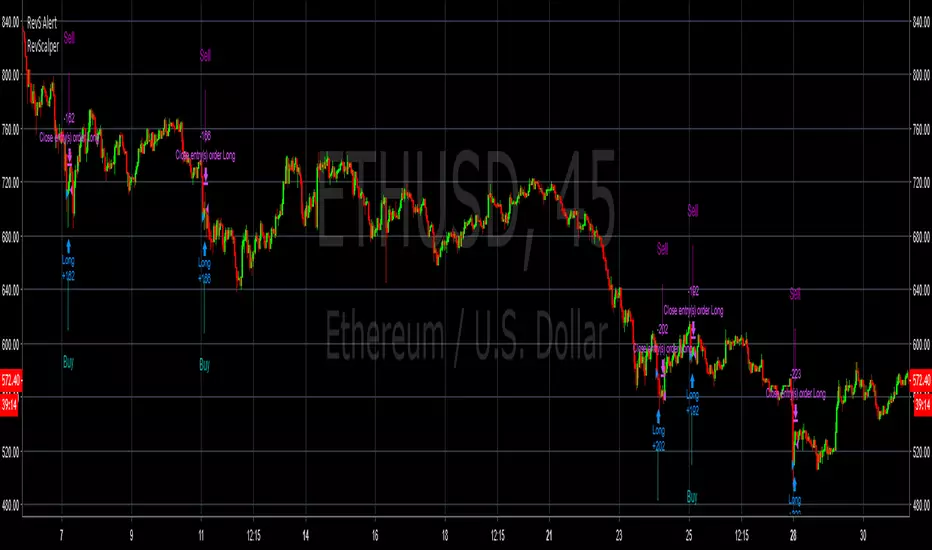
Indicator Symbols:
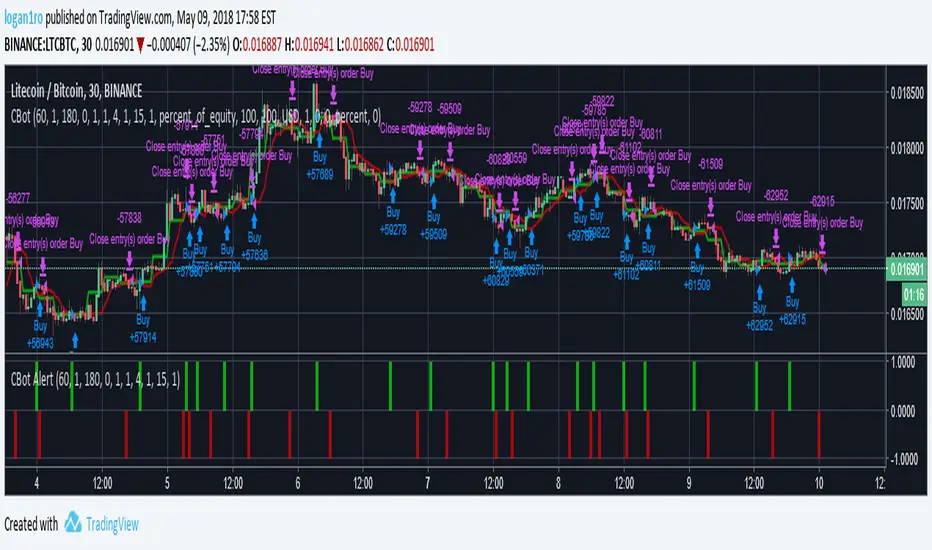
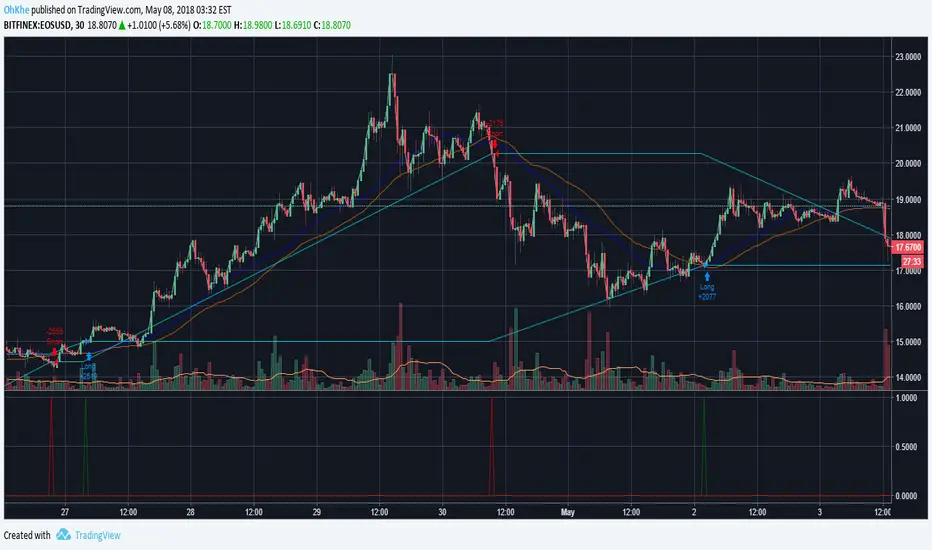
1) "Sell" --> refers to Sell/Short signal.
2) "Buy" --> refers to Buy/Long signal.
3) "⬆" (symbol in lime color) --> refers the Take Profits point with respect to last recent "Buy" signal.
4) "⬇" (symbol in lime color) --> refers the Take Profits point with respect to last recent "Sell" signal.
=============================================================================================
It has 6 Alert Systems:
1) Enter Buy
2) Enter Sell
3) Exit Sell
4) Exit Buy
5) Close Sell
6) Close Buy
Difference between Exit and Close options that mentioned under alerts are,
"Exit" option --> helps to stop the order at safer position - in case if market flips unexpectedly.
"Close" option --> helps to close the orders at local Top/Bottom to come out with very good profits.
==============================================================================================
Happy Trading :)
Thanks,
Mac
Penunjuk Pine Script®