Precision Strike Entry [PSE]This tool, known as Precision Strike Entry (PSE) , automatically generates Fibonacci Retracement Levels on any chart. More specifically, it scans for continuation and reversal trades based on two inputs and provides exact entry, exit ( Stop Loss ), and Take Profit levels.
Precision Strike Entry can be used for both Crypto and Forex markets.
A crucial aspect is adjusting the " Trading Mode " length to identify the correct extreme points or Custom Pivot Period Lookback. Unlike manually drawn Fibonacci levels, which remain static, the tool adjusts its levels dynamically when the chart's time frame changes.
Trading Mode Options:
Custom – To set manually Pivot Period Lookback
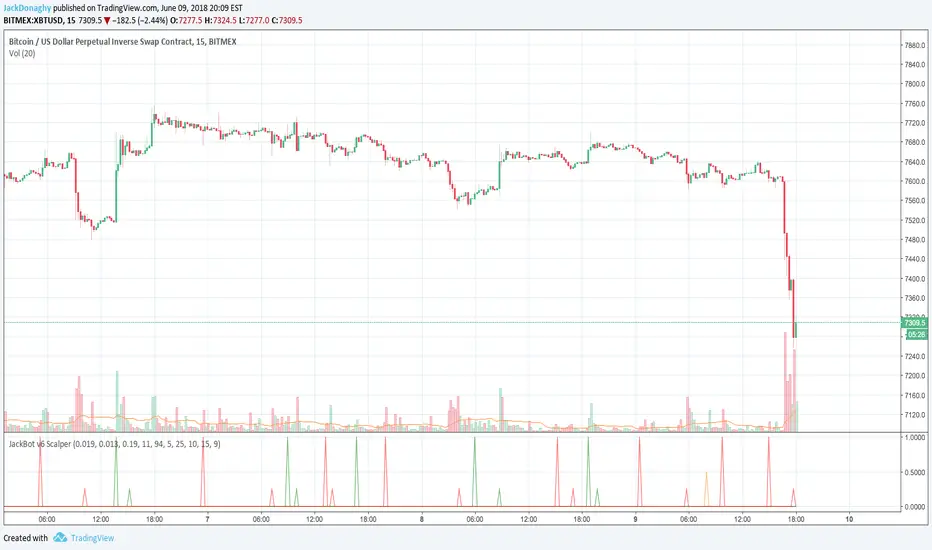
Scalper - Recommended for 5-15 min timeframes
Normal - Recommended for 15 min-2h timeframes
Swing - Recommended for 2h-4h timeframes
Unique to this tool is that the user can filter specific conditions before the Fibonacci is drawn on the chart. Additionally, it provides exact entry, stop loss, and Take Profit levels.
The identification of possible Fibonacci Retracement happens using two trigger techniques:
1-2 Setup and Trendline Break identification.
--> Using the 1-2 Setup identification, the indicator attempts to identify the next wave for point 3 using Fibonacci retracement rules.
--> Using the TrendLine breakout filter, the indicator will try to identify a possible pullback entry, utilizing Fibonacci retracement.
The indicator has been designed for bot processes, meaning it will not identify a short trade until you are in a long position and vice versa. Every trade ends with a custom breakeven at TP5 or hitting Stop Loss. When a trade ends/closes, the indicator will automatically search for a new long/short opportunity.
Since every symbol (Pair/Coin) has different conformations and pivots, not all pivot period parameters are perfect for every pair and timeframe. This is why the indicator gives you the opportunity to find the best pivot period for every combination of pair/timeframe, thanks to the Tuning Dashboard .
For example, for APE/USDT.P, by adjusting the 1-2 Setup & TrendLine Pivot Period Lookback settings, you can find a good setting with 1-2 Setup pivots set to 14, and TrendLine Breakout set to 15. The indicator checks the past 1000 bars and historical trades to provide an overview of what happened during the past 1000 bars.
In this case, the total number of trades was 145, and only 35 trades (24% of total trades) hit the Stop Loss without hitting at least TP1. TP1 was hit 110 times (75.75% of trades), TP2 65 times, etc.
This summary table also provides an indication of which pivot period setting is best for a specific pair/time frame combination. It offers statistical insights on how Take Profits were hit, giving you more confidence in how much of your position you will sell for each Take Profit level.
Pivot period settings for 1-2 Setup & Trend Line Breakout identification can be modified in the indicator parameters when the Trading Mode is set to Custom. There is also an extra parameter for filtering Long/Short ( Buy and Sell ) signals based on trend, identified using two EMAs (Moving Averages) with periods of 74 and 144.
Within the settings, you can also set Stop Loss and Breakeven settings as you prefer.
Default settings are:
TP1 Breakeven Level to Entry (possible values: Entry - DCA Entry - StopLoss)
TP2 Breakeven Level to TP1 (possible values: Entry - TP1 - StopLoss)
Breakeven Trigger: Use Close/Open of candles
Stoploss Trigger: Use Close/Open of candles
The indicator settings also include some visual settings to adapt the indicator based on the template you are using for your trading view charts for the best experience.
Alert Settings:
Precision Strike Entry (PSE) is designed to integrate with third-party bot systems
You can set three different alert modes:
TradingView Alert : You will receive classic TradingView alerts with messages indicating the desired alert, like Open Long (BUY), StopLoss Hit, Breakeven, and TakeProfits trigger alerts. (You will receive only the selected alerts from the list.)
Bot Alert : You will receive alerts only for Create Trade or Close Trade with the string of your UUID (you have to fill them in related to your Bot indication) and remember to set the Webhook setting to ensure the alert triggers on your Bot. When you use Bot Alert, you have to set the indicator Signal Type related to your Bot settings. NB: If you have created a TradingView Bot for Long Position, you will have to choose Signal Type = Long in the indicator settings.
Free Text Trade Alert : Using this setting, you will receive alerts only for Open Trade Long or Short. All information about Stop Loss and Take Profits is integrated into the Free Text Template.
Explanation for possible Fibonacci Retracement identification:
1-2 Setup identification:
Trend Line Breakout Pullback Identification:
Penunjuk Pine Script®