Multi Condition Stock Screener & Alert SystemMulti Condition Stock Screener & Strategy Builder
This script is a comprehensive Stock Screener and Strategy Builder designed to scan predefined groups of stocks (specifically focused on BIST/Istanbul Stock Exchange symbols) or a custom list of symbols based on user-defined technical conditions.
It allows users to combine multiple technical indicators to create complex entry or exit conditions without writing code. The script iterates through a list of symbols and triggers alerts when the conditions are met.
Key Features
• Custom Strategy Building: Users can define up to 6 separate conditions. • Logical Operators: Conditions can be linked using logical operators (AND / OR) to create flexible strategies. • Predefined Groups: Includes 14 groups of stocks (covering BIST symbols) for quick scanning. • Custom Scanner: Users can select the "SPECIAL" group to manually input up to 40 custom symbols to scan. • Directional Scanning: Capable of scanning for both Buy/Long and Sell/Short signals. • Alert Integration: Generates JSON-formatted alert messages suitable for webhook integrations (e.g., sending notifications to Telegram bots).
Supported Indicators for Conditions
The script utilizes built-in ta.* functions to calculate the following indicators:
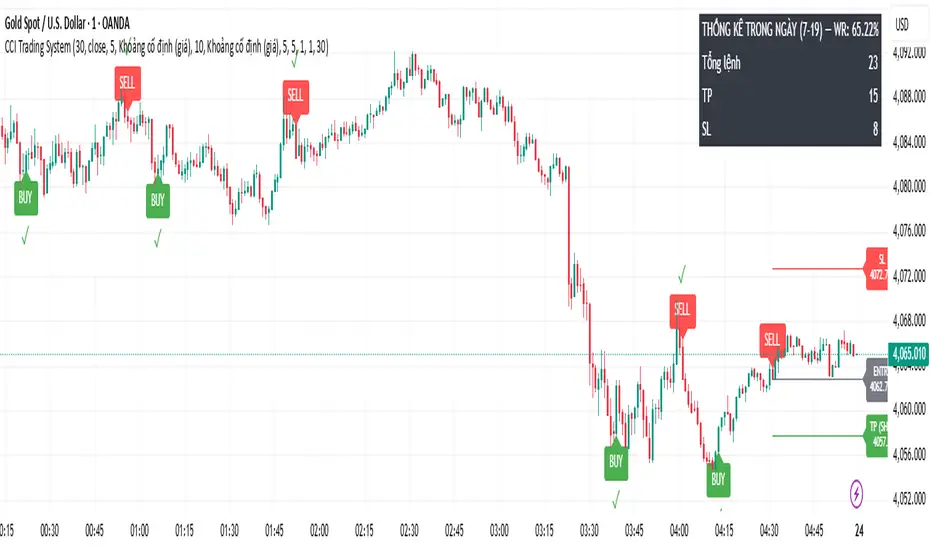
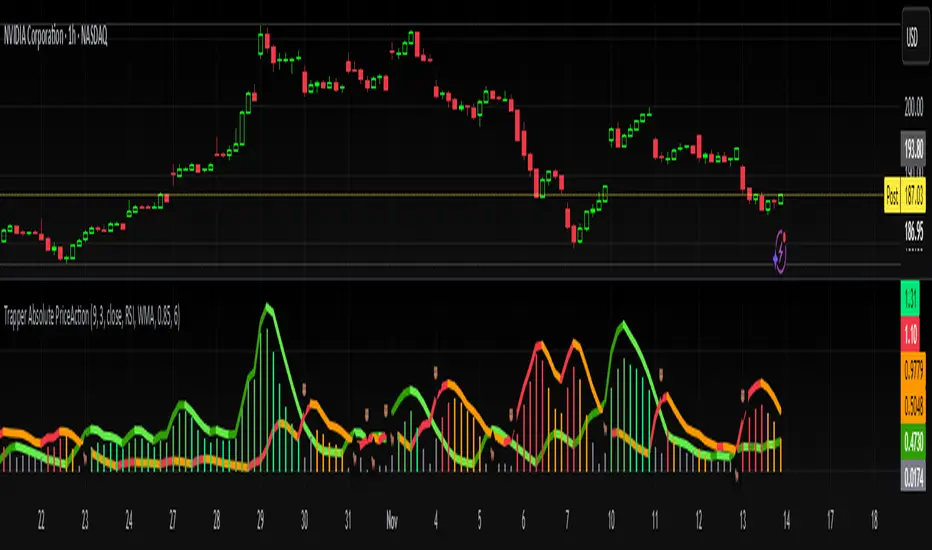
• MA (Moving Average): Supports EMA, SMA, RMA, and WMA. • RSI (Relative Strength Index) • CCI (Commodity Channel Index) • ATR (Average True Range) • BBW (Bollinger Bands Width) • ADX (Average Directional Index) • MFI (Money Flow Index) • MOM (Momentum)
How it Works
The script uses request.security() to fetch data for the selected group of symbols based on the current timeframe. It evaluates the user-defined logic (Condition 1 to 6) for each symbol.
• Comparison Logic: You can compare an indicator against a value (e.g., RSI > 50 ) or against another indicator (e.g., MA1 CrossOver MA2 ). • Signal Generation: If the logical result is TRUE based on the "AND/OR" settings, a visual label is plotted on the chart, and an alert condition is triggered.
Alert Configuration
The script produces a JSON output containing the Ticker, Signal Type, Period, and Price. This is optimized for users who want to parse alerts programmatically or send them to external messaging apps via webhooks.
Disclaimer This tool is for informational purposes only and does not constitute financial advice. Since it uses request.security across multiple symbols, please allow time for the script to load data on the chart.
Penunjuk Pine Script®