Ranged Volume DCA Strategy - R3c0nTraderUpdate: Republishing this as Public Open-Source script.
Credits:
Thank you "EvoCrypto" for granting me permission to use "Ranged Volume" to create this strategy.
Thank you "junyou0424" for granting me permission to use "DCA Bot with SuperTrend Emulator" which I used for adding bot inputs, calculations, and strategy
What does this do?
This script is mainly used for backtesting a Ranged Volume strategy to see how a 3Commas bot would perform.
I created this script out of necessity and I wanted a way to test a 3Commas DCA bot with a strategy based on “Volume.”
I came across "EvoCrypto’s" "Ranged Volume" study and strategy in TradingView and I liked it. I wanted to configure it so it can be used for DCA bot backtesting. I used parts from "junyou0424’s" "DCA Bot with SuperTrend Emulator" to add the following:
1. The Start Time and End Time
2. Price deviation to open safety orders (%)
3. Target Take Profit (%)
4. Trailing deviation
5. Base Order and Safety Order
6. Safety order volume scale
7. Safety order step scale
8. Max safety orders
In addition to the above, I also added chart indicators for "Take Profit" as well as "Safety Order"
Pre-requisites:
You can use this script without a 3Commas account and see how 3Commas DCA Bot and Ranged Volume strategy would perform vs. a non-DCA strategy. However, I highly recommend signing up for their free account and going through their training. This would give you a base understanding on the settings you will see in this strategy and why you will need to know them.
That said these are the pre-requisites I suggest you have:
1. Base Knowledge of 3Commas DCA bots
2. Base knowledge of settings such as “Max safety trades count”, “safety order volume scale” and “safety order step scale”. If these are alien to you, I suggest you read up on these.
3. Knowledge of setting up a Single-pair 3Commas bot for receiving custom TradingView signal.
4. A paper-bot to test your ideas. (Do not use a real money bot until you have tested it sufficiently with a paper-bot. You alone are responsible for your results!)
5. Add the study I created called "R3c0nTrader’s Ranged Volume Study” which adds a separate chart in its own pane showing the volume spikes. It will also generate the “buy” signals for your bot. NOTE: The study also has the same color scheme as this strategy and having the colors in both the strategy and the study will make things easier to see. If you use EvoCrypto’s Ranged Volume Study instead, just keep in mind that the colors won’t match, and you will have to manually match them.
6. Make your buy signals from your strategy are the same as in your study! To do this, use the same “Volume Range Length” you entered in the STRATEGY and enter that value for the “Volume Range Length” in the STUDY. Also ensure you have the same settings for “Heikin Ashi” (On or Off).
Comparisons of Ranged Volume Strategy vs Ranged Volume DCA Strategy
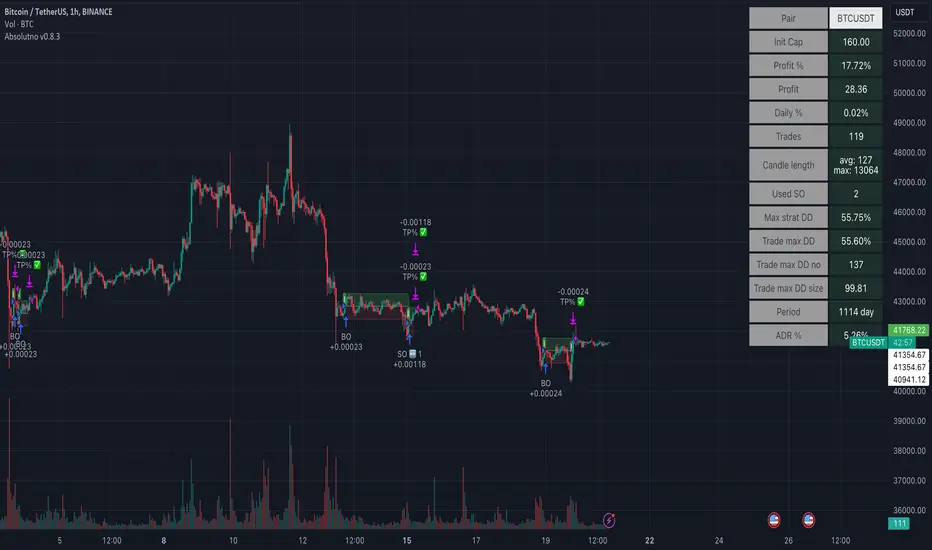
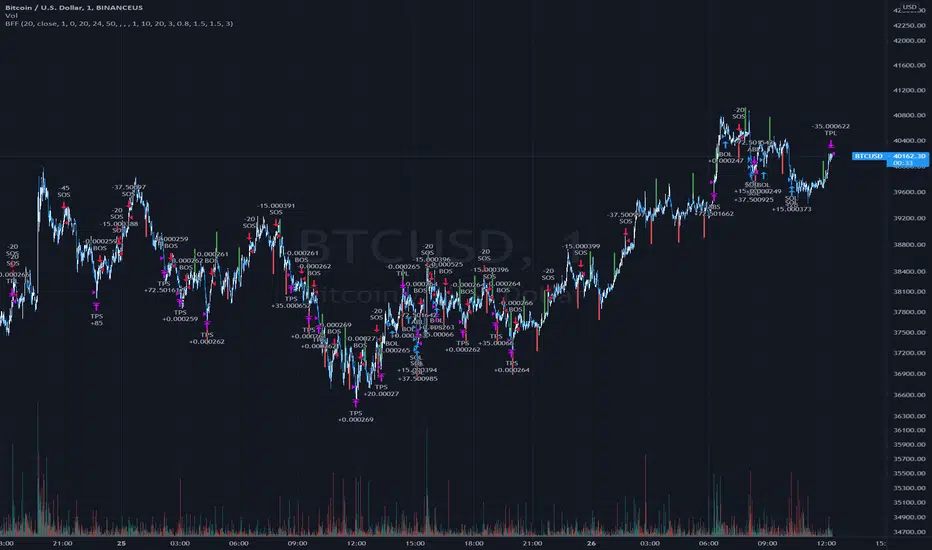
BTCUSD
Beware of Strategies that claim super high profits. This can easily be done by lowering the initial capital to something unrealistic. If I did that with this strategy and set the initial capital $100 and base order size to $100, I get a net profit of 2,864% which is not realistic.
How to Use
1. On the “Inputs” tab:
a. Set your Start and End Time to backtest against.
b. Set your “Volume Range Length” (number of bars to look back)
c. “Heikin Ashi Colors” – Usually I leave this enabled
d. “Show Bar Colors” – Leave enabled
e. “Show Break-Out” – Leave enabled
f. “Show Range” – Leave enabled
g. Set your other inputs which are those settings you would find in your 3Commas bot that you want to test (e.g., Price deviation to open safety orders, Target Take Profit, Base order, Safety order, etc.).
h. Quick Example for BTCUSD on 2hr chart:
i. Price deviation to open safety orders (%) = 6
ii. Target Take Profit (%) = 14
iii. Trailing deviation = 0
iv. Base order = 100
v. Safety order = 200
vi. Safety order volume scale = 2
vii. Safety order step scale = 1.4
viii. Max safety order = 5
2. On the “Properties” tab, set your initial capital, base currency, etc.
a. Initial capital – Default is 10,000 (Please use realistic values here. The amount here should be able to cover ALL your safety orders if they were triggered. Ideally, you should have funds left over and not use all trade capital.)
b. Base currency – Select your currency
c. Order Size - Not used. Use the “Inputs” tab to change your base order size.
d. Leave “Pyramiding” set to 999. This acts as a ceiling to the “Max safety orders” on the “Inputs” tab. It must always be higher than your “Max safety orders.” For example, if you set your “Max safety orders” to “4” and “Pyramiding” to “4” then it effectively means you have “3” “Max safety orders” and not “4” because it is counting each successive entry including the initial order.
e. “Commission” - Optional
f. “Verify price for limit orders” – Leave at zero. This does not change anything that I can tell.
g. Optional - Enter a value for “Commission”
h. Slippage – Optional. Slippage does not occur in backtesting but does occur in real trading but it can be simulated. Example use case for tracking performance of a real money bot: You enter the start date and time of your bot’s trade into this strategy and you notice some values are a little off due to slippage (average price, take profit, safety orders are not lining up) then you would go back here and increase the slippage until those lines up close enough with your actuals.
i. Margin for long positions – I don’t use this honestly.
j. Margin for short positions – I don’t use this honestly.
k. Recalculate “After order is filled” and “On every tick” – I don’t use this honestly.
3. “Style” tab
a. Ranged Volume Bar Coloring - You must disable bar coloring in any studies you added or this may not work properly
i. Color 0 – Default Yellow; appears when a volume breakout occurs
ii. Color 1 – Default Red; appears when a volume breakdown occurs
iii. Color 2 – Light Blue; appears when Close is higher than the Open
iv. Color 3 – Dark Blue; appears when the Close is lower than the Open
b. Take profit – Default Green; take profit line
c. Safety order – Default Light Blue; safety order line
d. No Safety Orders left – Default Red; when a trade runs out of safety orders, the line turns red and there is no safety orders left underneath to catch any further falling price movements.
e. Avg Position Price – Default Orange; your average position price for any given trade.
f. Take Profit Plot Area – Default Green; creates a highlighted area for your take profit
g. SO Plot Area – Default Light Blue; creates a highlighted area for your safety orders
h. Trades on chart – Show or hide your trades on the chart
i. Signal labels – Show or hide the trade signal labels on the chart
j. Quantity – Show or hide the trade quantity on the chart
Explanation of Chart lines and colors on chart
Strategi Pine Script®