BeeQuant - Hive Visualizer💠 OVERVIEW
The " Hive Visualizer " is a game-changing, invite-only tool, expertly designed to give every trader, from beginner to experienced, instant and clear visual clues about what price is doing. Its main job is to easily show you the highest and lowest points price has reached recently. Think of it as a smart, automated helper that colors your candles to reveal powerful market moves. This helps you quickly see if prices are getting stronger or weaker right on your chart. It's a groundbreaking, high-quality tool that cuts through the noise, making it simple to spot key moments when the market is about to make a big move up or down, giving you an edge.
__________________________________________________________________________
🧠 CONCEPTS
The core philosophy behind Hive Visualizer is rooted in contextual volatility exposure and directional bias reinforcement. Through a sophisticated internal mechanism that evaluates local maxima/minima behavior within a compact temporal field, the indicator provides adaptive color‑based candle transitions that align with latent directional pressure.
1. Uses localized equilibrium breach detection to monitor directional intent and exhaustion points.
2. Embeds a dynamically updating framework that reacts to both trend continuation and structural reversals.
3. Avoids false positives by disregarding noisy fluctuations below system‑defined relevance thresholds.
4. Provides non‑repainting, fully forward‑confirmed visual outputs for reliable retrospective analysis.
Hive Visualizer is not designed to be predictive. Instead, it allows traders to observe the evolution of price structure in a cleaner and more digestible format, supporting high-confidence discretionary execution or automated model overlays.
__________________________________________________________________________
✨ FEATURES
The "Hive Visualizer" comes with a suite of smart features, all designed for amazing clarity, quick reactions, and deeper understanding, making your charting experience truly effortless:
🔹 Easy Range Customization
A super easy "Smoother" setting lets you perfectly adjust how the indicator reacts to recent price changes. This means you can fine-tune it to match exactly how you like to trade
🔹 Instant, Clear Signals
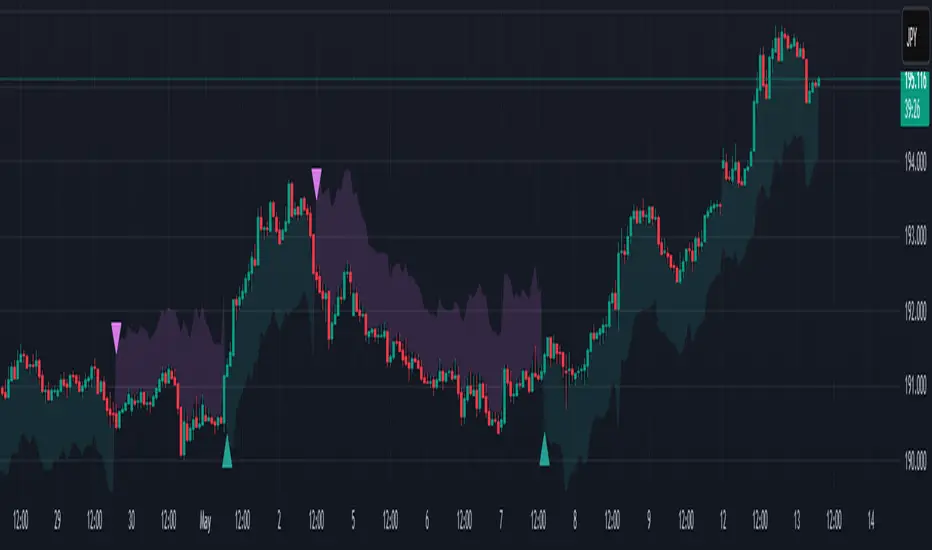
The simple Green and Red candles give you immediate, unmistakable visual cues about strong upward or downward moves, providing insights you can grasp in a heartbeat.
🔹 Smart Continuity in Quiet Times
The clever way it keeps the same color for candles that aren't breaking out offers valuable, subtle insights into those periods when the market is just moving sideways or finding its balance, helping you see the hidden dynamics.
🔹 Seamless Chart Integration
This indicator works like a transparent overlay, appearing directly on your price chart without getting in the way or changing your original candles. It fits perfectly, making your analysis smooth and uninterrupted.
🔹 Clean and Focused Visuals
The indicator’s simple design focuses only on coloring the main candle body and border to clearly highlight important breakouts. This keeps your chart clean and effective, showing you only what truly matters.
🔹 Cross-Market Versatility
This indicator is engineered to perform with precision across all major markets—whether you're trading forex, commodities, stocks, or indices. Its adaptive logic automatically aligns with the unique volatility and structure of each asset class, delivering consistently reliable insights no matter where you trade.
__________________________________________________________________________
⚙️ USAGE
Using and making the "Hive Visualizer" a part of your trading routine is incredibly simple and designed to significantly boost how you understand the market:
Getting Started: Once you have access, just add the "Hive Visualizer" indicator to any chart and timeframe you want on TradingView. It's that easy.
Tuning the "Smoother" Setting: Go into the indicator's settings and play with the "Smoother" number. This is a crucial step to make it react just right for you.
Smaller numbers (like 1-3 bars) will make the indicator very quick to react to the most recent, short-term ups and downs, perfect for fast trading.
Larger numbers (like 5-10+ bars) will give you a wider view, smoothing out small changes and highlighting bigger, more important breakouts, ideal for longer-term analysis. Spend a little time trying different settings to find what works best for your chosen asset and your trading style – it's like finding the perfect lens for your market view.
Understanding the Colors: Once you've set it up, here's how to quickly understand what the "Hive Visualizer" is telling you: New Green Candle: This means a strong sign that buyers are in control and prices are likely to keep moving up, giving you confidence in bullish moves.
New Red Candle: This indicates as a strong signal that sellers are dominating and prices are likely to keep moving down, preparing you for bearish shifts.
__________________________________________________________________________
⚠️ LIMITATIONS
👉 Visual Guide, Not a Bot: Use as part of a broader strategy—it won’t auto‑trade for you
👉 Retroactive Insight: It reflects past price action; it doesn’t predict the future.
👉 Setting‑Dependent: Effectiveness relies on your “Smoother” choice—too low = noise; too high = lag.
👉 Price‑Range Focused: Highlights trends and range only — doesn’t analyze volume, news, or other complex factors.
👉 This tool enhances trend validation but isn’t a standalone signal generator.
█ ▒▒▒▒▒▒▒▒▒▒▒▒▒▒▒▒▒▒▒▒▒▒▒ 『•••• ✎ ••••』 ▒▒▒▒▒▒▒▒▒▒▒▒▒▒▒▒▒▒▒▒▒▒▒▒ █
🎯 CONCLUSION
The "Hive Visualizer" offers an incredibly easy-to-use and adaptable way to see price strength and weakness with crystal clarity on your charts. By giving you instant, clear feedback on whether prices are powerfully breaking out or falling below a recent historical range, it truly empowers you to quickly understand market momentum and spot key turning points. Seamlessly add this smart visual tool into your current trading methods to gain a sharper, more insightful view, and elevate your trading decisions. It's about seeing the market with new eyes.
▣▣▣▣▣▣▣▣▣▣▣▣▣▣▣▣▣▣▣▣▣▣▣▣▣▣▣▣▣▣▣▣▣▣▣▣▣▣▣▣▣▣▣▣▣▣▣▣▣▣▣
🚨 RISK DISCLAIMER
Engagement in financial market speculation inherently carries a substantial degree of inherent risk, and the potential for capital diminution, potentially exceeding initial deposits, is a pervasive and non-trivial consideration. All content, algorithmic tools, scripts, articles, and educational materials disseminated by "Hive Visualizer" are exclusively purposed for informational and pedagogical objectives, strictly for reference. Historical performance data, whether explicitly demonstrated or implicitly suggested, offers no infallible assurance or guarantee of future outcomes. Users bear sole and ultimate accountability for their individual trading decisions and are emphatically urged to meticulously assess their financial disposition, risk tolerance parameters, and conduct independent due diligence prior to engaging in any speculative market activity.
Penunjuk Pine Script®