TrendMaster Premium ©Trendmaster Premium©
We are proud to release the final version of Trendmaster Premium©. This indicator is the result of months of development between @TrendmasterTM and @Crypto_C00kie.
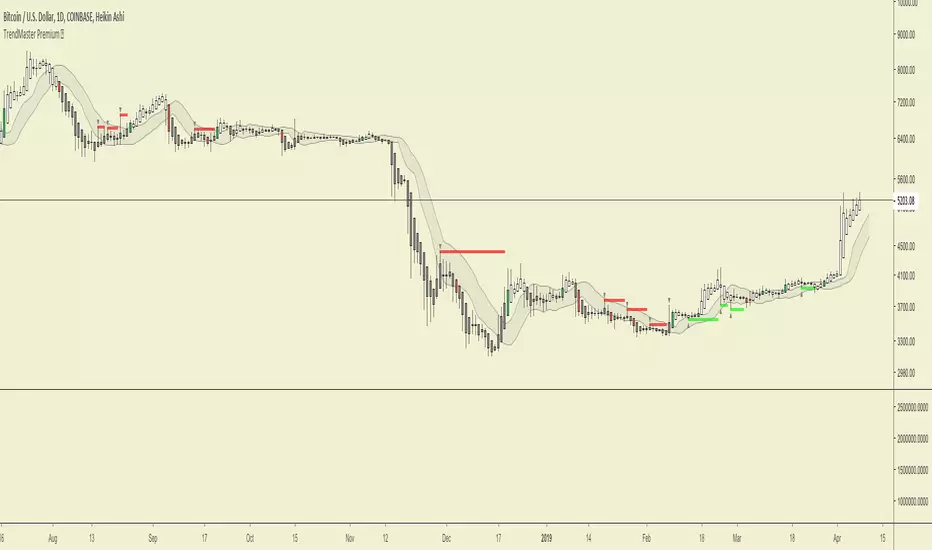
Trendmaster Premium© is a Trend following system that provide entries, exits and stop loss placement. It is extremely simple to follow and we have experienced outstanding results.
When purchasing Trendmaster Premium© you will receive access to the indicator suite and access to our private members discord group.
Discord: The discord channel is a place where traders can discuss ideas and share content.
It includes
Bots – The discord channel currently has two bots that constantly scan Binance for signals. They will alert you by notification of any BTC pair that has printed a signal candle. Currently the bots report D1 and H4 signals as these are the time frames the indicator is designed for. These are designed to alert you to possible trades and should NOT be blindly traded from.
Chat – Several chat servers offering educational resources, guidance on how to use the indicator and chart/idea sharing.
The mandatory Legal bit:
@IchimokuScholar and @Crypto_C00kie wish you the best of luck in achieving your trading goals. Please apply appropriate risk management.
Any form of trading has large potential rewards but also large potential risks. The Purchaser must be aware of those risks and be willing to accept them. Don't trade with money that you, the Purchaser cannot afford to lose. No representation is being made that you are guaranteed positive results. The past performance of any trading methodology is not necessarily indicative of future results. Trading involves high risks. Neither @TrendmasterTM or @Crypto_C00kie are responsible for any trades that you, the Purchaser take. All trades taken are entirely at the Purchasers own risk. Refunds are neither offered nor implied.
Penunjuk Pine Script®