Bjorgum Double Tap█ OVERVIEW
Double Tap is a pattern recognition script aimed at detecting Double Tops and Double Bottoms. Double Tap can be applied to the broker emulator to observe historical results, run as a trading bot for live trade alerts in real time with entry signals, take profit, and stop orders, or to simply detect patterns.
█ CONCEPTS
How Is A Pattern Defined?
Doubles are technical formations that are both reversal patterns and breakout patterns. These formations typically have a distinctive “M” or a “W” shape with price action breaking beyond the neckline formed by the center of the pattern. They can be recognized when a pivot fails to break when tested for a second time and the retracement that follows breaks beyond the key level opposite. This can trap entrants that were playing in the direction of the prior trend. Entries are made on the breakout with a target projected beyond the neckline equal to the height of the pattern.
Pattern Recognition
Patterns are recognized through the use of zig-zag; a method of filtering price action by connecting swing highs and lows in an alternating fashion to establish trend, support and resistance, or derive shapes from price action. The script looks for the highest or lowest point in a given number of bars and updates a list with the values as they form. If the levels are exceeded, the values are updated. If the direction changes and a new significant point is made, a new point is added to the list and the process starts again. Meanwhile, we scan the list of values looking for the distinctive shape to form as previously described.
█ STRATEGY RESULTS
Back Testing
Historical back testing is the most common method to test a strategy due in part to the general ease of gathering quick results. The underlying theory is that any strategy that worked well in the past is likely to work well in the future, and conversely, any strategy that performed poorly in the past is likely to perform poorly in the future. It is easy to poke holes in this theory, however, as for one to accept it as gospel, one would have to assume that future results will match what has come to pass. The randomness of markets may see to it otherwise, so it is important to scrutinize results. Some commonly used methods are to compare to other markets or benchmarks, perform statistical analysis on the results over many iterations and on differing datasets, walk-forward testing, out-of-sample analysis, or a variety of other techniques. There are many ways to interpret the results, so it is important to do research and gain knowledge in the field prior to taking meaningful conclusions from them.
👉 In short, it would be naive to place trust in one good backtest and expect positive results to continue. For this reason, results have been omitted from this publication.
Repainting
Repainting is simply the difference in behaviour of a strategy in real time vs the results calculated on the historical dataset. The strategy, by default, will wait for confirmed signals and is thus designed to not repaint. Waiting for bar close for entires aligns results in the real time data feed to those calculated on historical bars, which contain far less data. By doing this we align the behaviour of the strategy on the 2 data types, which brings significance to the calculated results. To override this behaviour and introduce repainting one can select "Recalculate on every tick" from the properties tab. It is important to note that by doing this alerts may not align with results seen in the strategy tester when the chart is reloaded, and thus to do so is to forgo backtesting and restricts a strategy to forward testing only.
👉 It is possible to use this script as an indicator as opposed to a full strategy by disabling "Use Strategy" in the "Inputs" tab. Basic alerts for detection will be sent when patterns are detected as opposed to complex order syntax. For alerts mid-bar enable "Recalculate on every tick" , and for confirmed signals ensure it is disabled.
█ EXIT ORDERS
Limit and Stop Orders
By default, the strategy will place a stop loss at the invalidation point of the pattern. This point is beyond the pattern high in the case of Double Tops, or beneath the pattern low in the case of Double Bottoms. The target or take profit point is an equal-legs measurement, or 100% of the pattern height in the direction of the pattern bias. Both the stop and the limit level can be adjusted from the user menu as a percentage of the pattern height.
Trailing Stops
Optional from the menu is the implementation of an ATR based trailing stop. The trailing stop is designed to begin when the target projection is reached. From there, the script looks back a user-defined number of bars for the highest or lowest point +/- the ATR value. For tighter stops the user can look back a lesser number of bars, or decrease the ATR multiple. When using either Alertatron or Trading Connector, each change in the trail value will trigger an alert to update the stop order on the exchange to reflect the new trail price. This reduces latency and slippage that can occur when relying on alerts only as real exchange orders fill faster and remain in place in the event of a disruption in communication between your strategy and the exchange, which ensures a higher level of safety.
👉 It is important to note that in the case the trailing stop is enabled, limit orders are excluded from the exit criteria. Rather, the point in time that the limit value is exceeded is the point that the trail begins. As such, this method will exit by stop loss only.
█ ALERTS
Five Built-in 3rd Party Destinations
The following are five options for delivering alerts from Double Tap to live trade execution via third party API solutions or chat bots to share your trades on social media. These destinations can be selected from the input menu and alert syntax will automatically configure in alerts appropriately to manage trades.
Custom JSON
JSON, or JavaScript Object Notation, is a readable format for structuring data. It is used primarily to transmit data between a server and a web application. In regards to this script, this may be a custom intermediary web application designed to catch alerts and interface with an exchange API. The JSON message is a trade map for an application to read equipped with where its been, where its going, targets, stops, quantity; a full diagnostic of the current state and its previous state. A web application could be configured to follow the messages sent in this format and conduct trades in sync with alerts running on the TV server.
Below is an example of a rendered JSON alert:
{
"passphrase": "1234",
"time": "2022-05-01T17:50:05Z",
"ticker": "ETHUSDTPERP",
"plot": {
"stop_price": 2600.15,
"limit_price": 3100.45
},
"strategy": {
"position_size": 0.1,
"order_action": "buy",
"market_position": "long",
"market_position_size": 0,
"prev_market_position": "flat",
"prev_market_position_size": 0
}
}
Trading Connector
Trading Connector is a third party fully autonomous Chrome extension designed to catch alert webhooks from TradingView and interface with MT4/MT5 to execute live trades from your machine. Alerts to Trading Connector are simple; just select the destination from the input drop down menu, set your ticker in the "TC Ticker" box in the "Alert Strings" section and enter your URL in the alert window when configuring your alert.
Alertatron
Alertatron is an automated algo platform for cryptocurrency trading that is designed to automate your trading strategies. Although the platform is currently restricted to crypto, it offers a versatile interface with high flexibility syntax for complex market orders and conditions. To direct alerts to Alertatron, select the platform from the 3rd party drop down, configure your API key in the ”Alertatron Key” box and add your URL in the alert message box when making alerts.
3 Commas
3 Commas is an easy and quick to use click-and-go third party crypto API solution. Alerts are simple without overly complex syntax. Messages are simply pasted into alerts and executed as alerts are triggered. There are 4 boxes at the bottom of the "Inputs" tab where the appropriate messages to be placed. These messages can be copied from 3 Commas after the bots are set up and pasted directly into the settings menu. Remember to select 3 Commas as a destination from the third party drop down and place the appropriate URL in the alert message window.
Discord
Some may wish to share their trades with their friends in a Discord chat via webhook chat bot. Messages are configured to notify of the pattern type with targets and stop values. A bot can be configured through the integration menu in a Discord chat to which you have appropriate access. Select Discord from the 3rd party drop down menu and place your chat bot URL in the alert message window when configuring alerts.
👉 For further information regarding alert setup, refer to the platform specific instructions given by the chosen third party provider.
█ IMPORTANT NOTES
Setting Alerts
For alert messages to be properly delivered on order fills it is necessary to place the following placeholder in the alert message box when creating an alert.
{{strategy.order.alert_message}}
This placeholder will auto-populate the alert message with the appropriate syntax that is designated for the 3rd party selected in the user menu.
Order Sizing and Commissions
The values that are sent in alert messages are populated from live metrics calculated by the strategy. This means that the actual values in the "Properties" tab are used and must be set by the user. The initial capital, order size, commission, etc. are all used in the calculations, so it is important to set these prior to executing live trades. Be sure to set the commission to the values used by the exchange as well.
👉 It is important to understand that the calculations on the account size take place from the beginning of the price history of the strategy. This means that if historical results have inflated or depleted the account size from the beginning of trade history until now, the values sent in alerts will reflect the calculated size based on the inputs in the "Properties" tab. To start fresh, the user must set the date in the "Inputs" tab to the current date as to remove trades from the trade history. Failure to follow this instruction can result in an unexpected order size being sent in the alert.
█ FOR PINECODERS
• With the recent introduction of matrices in Pine, the script utilizes a matrix to track pivot points with the bars they occurred on, while tracking if that pivot has been traded against to prevent duplicate detections after a trade is exited.
• Alert messages are populated with placeholders ; capability that previously was only possible in alertcondition() , but has recently been extended to `strategy.*()` functions for use in the `alert_message` argument. This allows delivery of live trade values to populate in strategy alert messages.
• New arguments have been added to strategy.exit() , which allow differentiated messages to be sent based on whether the exit occurred at the stop or the limit. The new arguments used in this script are `alert_profit` and `alert_loss` to send messages to Discord
Cari dalam skrip untuk "profit"

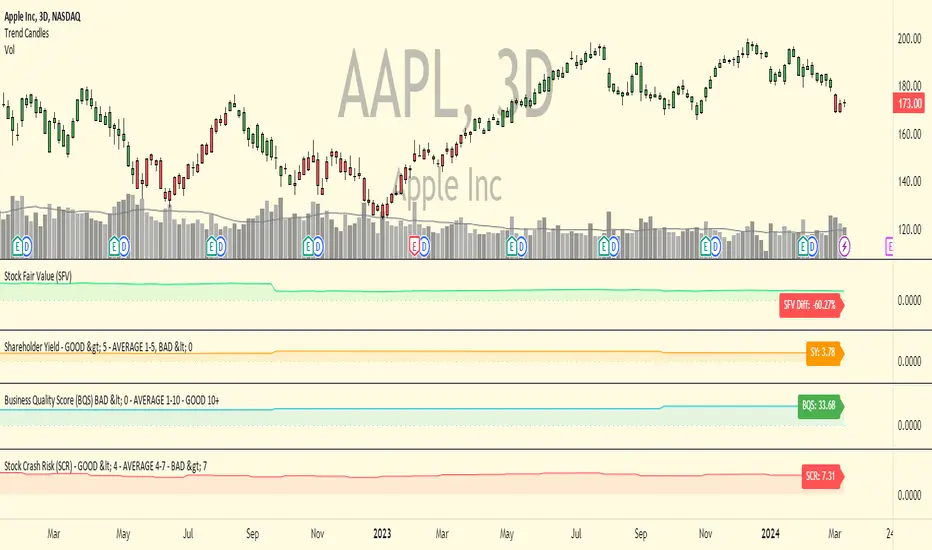
Business Quality Score (BQS)Business Quality Score (BQS) is an indicator that can be used to determine how strong, safe and efficient a business is. Generally speaking, a negative reading under 0 indicates a poor quality business, a reading between 1-10 indicates an average quality business and a reading above 10 indicates a high quality business. This indicator is only applicable on stocks, not on forex, futures or crypto.
The indicator uses fundamental data to calculate the reading and hence doesn't have any changeable settings for the user. The score is based on the profitability of a business and how efficiently it uses capital to generate shareholder returns. The indicator also looks at the debt, leverage and liquidity of the business to help determine the score. Generally speaking businesses with lot's of debt, high leverage and low liquidity will lead to lower scores.
This indicator is designed more for stock investors with longer timeframes and isn't suited towards short term traders. It can be used as part of an overall investment process to help identify high quality businesses that are suitable for long term investing. It can be used to monitor current investments to see if a stock's overall business quality is improving or deteriorating.
To get access to this indicator PM or email me to my address shown below.
Enjoy :)
Disclaimer: All my scripts and content are for educational purposes only. I'm not a financial advisor and do not give personal finance advice. Past performance is no guarantee of future performance. Please trade at your own risk.
Trailing Stop AlertsThis script is designed as an ATR-based trailing stop tool to assist in managing open positions.
Once you're involved in a profitable trade, if you add this script to your chart you'll be prompted to select a bar to begin trailing from.
You can then adjust the candle lookback distance for swing high/lows (7 by default), the ATR multiplier (1.0 by default), and the direction to trail (Long/Short).
You can also adjust the ATR period in the settings menu if you want to (14 period by default).
Once the script is added to your chart, it will begin drawing your trailing stop and you can then set up alerts.
Alert Options:
Any alert() function call : Will trigger an alert for both conditions (trailing stop updated, trailing stop hit)
Alert Conditions : Trailing Stop Update will trigger whenever the stop is updated, Trailing Stop Hit will trigger whenever the stop is hit.
Note: the alerts will only fire once per bar close and the trailing stop will not update on realtime bars.

ms hypersupertrendThis is a well-known strategy by using 3 different Supertrends and a trend-defining EMA,
feel free to play around with the settings, a backtest on 8h ETHUSDT pair brought some good results using
the 233EMA and investing 75% of a 10k start capital
the idea is to have at least 2 super trends going green above the trend-EMA to go long and exit by turning
2 super trends red (idea: 1 super trend in red could initialize a take profit)
shorts work vice versa
The EMA shows in green for uptrends and in red for downtrends, if it is blue no Signal will be taken because
the 3 super trends are not all above or below the trendline(EMA)
//-------------------------------------------------------------------------------------------------------------------------------------------------
Update 1:
- Fixed a minor input error
- Added ATR stoploss, and commented out the percentage stop loss
- Added time window to backtest
- Added exit on risk/reward is met
- This version is only buy...wait for next update adding shorts and more
As always, thanks for your ideas, likes, and support. Feel free to mess around with the settings and give me your feedback.

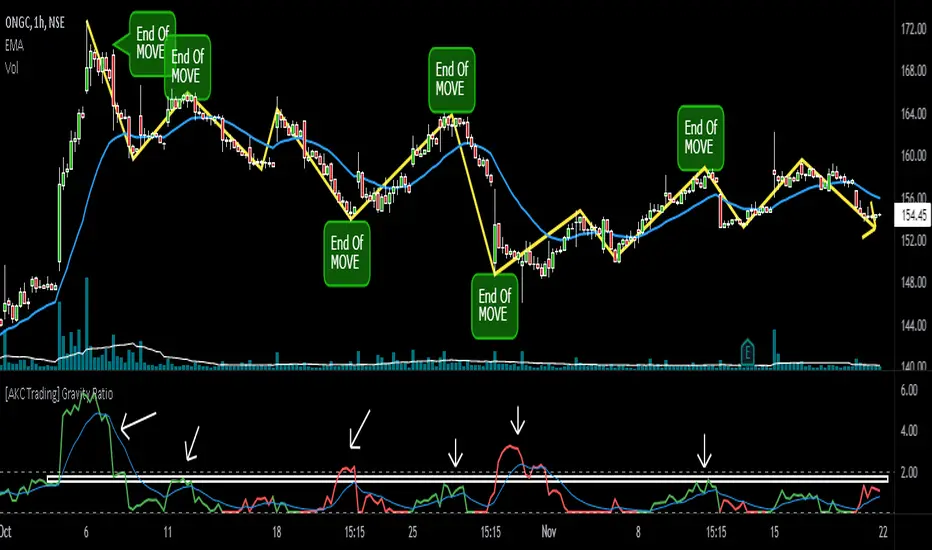
[AKC Trading] Gravity RatioGRAVITY RATIO must be used for taking PROFIT and EXIT from the trade.
1) Whenever Gravity Ratio value is near or more than 2 (general limit), it is assumed that move is extended and traders should look for booking out some or full profits (as per their initial trade plan)
2) Gravity Ratio considers length of price movement. And every stock has its own behavior, so it is advisable to look at the indicator and see on what prior values of Gravity Ratio, the move ended and use that value as zone to plan your exit.
For example, in the chart shown, instead of standard value of 2, this particular stock have seen be start exhausting around 1.5-1.8 zone. Once the Gravity Ratio reaches near to this value, a trader must used price action to trail their SL and should book (partial or full) near its pre-defined Target (Take Profit) levels.
Forex Fractal EMA ScalperThis is a forex scalper designed for very short timeframes 1-5 min max.
At the same time due to the short timeframe, is recommend to re optimize it weekly .
Its components are
Fractals
Triple EMA with different lengths
Rules for entry:
For long : we have an up fractal and all 3 ema are in ascending order
For short: we have a down fractal and all 3 ema are in descending order.
Rules for exit
We exit when we either get a reverse order or when we hit the take profit or stop loss calculated in fixed pips.

Parabolic SAR + Take Profit and Stop Loss By Nussara (strategy)Back test strategy for "Parabolic SAR + Take Profit and Stop Loss By Nussara" make it easy setting a strategy to estimate profits and losses.
This strategy uses Parabolic SAR . The Parabolic SAR is a technical indicator developed by J. Welles Wilder to determine the direction that an asset is moving. The indicator is also referred to as a stop and reverse system, which is abbreviated as SAR . It aims to identify potential reversals in the price movement of traded assets.
This indicator has a function to take profit and stop loss level.
Stop loss level = First reverse point of uptrend
Take profit level = Entry price + (Entry price-Stop loss level)
User can set a parabolic SARS and a profit point but I fixed stop loss level at first reversals point of uptrend. I also put alert for Buy, Sell, Stop Loss in this indicator.
This indicator is just a tool for technical analysis . It shouldn't be used as the only indication of trade because it causes you to lose your money. You should use other indicators to analyze together.

Smart EMA SignalsThis indicator starts by plotting each time the price action crosses above or below the EMA, of which you can tune the timeframe and duration.
It then takes it a step further and plots whether or not that indicator would have given you a profitable trade, of which you can also tune the parameters (Max wait time, and % Profit).
Once you have your EMA tuned to your liking, set up alerts to notify you of a golden opportunity.

SB On Balance Profit/Loss IndicatorI was always interested in volume indicators as well as market sentiment.
While brainstorming, I came to the thought that people with gains vs people with losses can move a stock up or down.
I don't want to debate the rational behind people buying and selling based on profits or losses, so this isnt a signaling indicator.
However, I still wanted to have a way to measure and visualize this information.
On Balance Volume was not enough for me. I wanted to know how much actual money was made or lost, over time.
This indicator was created based on two different time periods, the daily and the 30m.
The daily time period is used to measure money made from close of the day before to the open of the current day (gap up/down).
The 30 minute precision period is used to measure the money made from the close of the current bar from the close of the bar prior and calculated 13 times per trading session.
There is an option for 15 minute and 5 minute precision, but it may take longer for the script to process and may time out at lower precision periods.
The default lookback period is 10 days, values are cumulative. We can clearly see over the last 10 days how much money was made, lost and on balance. This should affect trader sentiment.
Visual display is the cumulative money made (green line), cumulative money lost (red line), and cumulative net on balance money (black line). The net on balance money is filled green above zero and filled red below zero.
The Green Histogram is the money made overnight, the Red histogram is the money lost overnight.
The black histogram above zero is the money made intraday and the black histogram is the money lost intraday.
Takeways
Just because a stock is trending down, as noted by the downward slop in price on the daily chart , it does not mean that the average trader is losing money. Intraday price action can offset money lost at higher time periods.
Especially in cases where a stock gaps down overnight, buyers step in at the low and the stock closes above open, but below previous days close. Esspecially when this is done on high volume .
The net profit can be greater than net loss, even if the day closes down from previous close. This can really help with "sentiment" and being able to visualize this sentiment may be helpful in making a decision to buy or sell.
View my collection of custom scripts at: www.tradingview.com

Trend Catcher BotTrend analysis strategy with entry filters such as MACD and Tilson T3. It will look at possible entry points and it can use MACD or TilsonT3 filters to decide whether or not enter in a new trade.
Notes:
- Results include a 0.075% Fee.
- Simulated leverage of 5x.
- Initial Capital of $1000.
- Uses a max order size of $200k per trade (Leverage included).
- Stop loss of 1.15%.
- The stop loss is moved to 0.4% Profit once the Trade reaches 1.15% profit.
- All settings adjustable.
- Non Repainting.

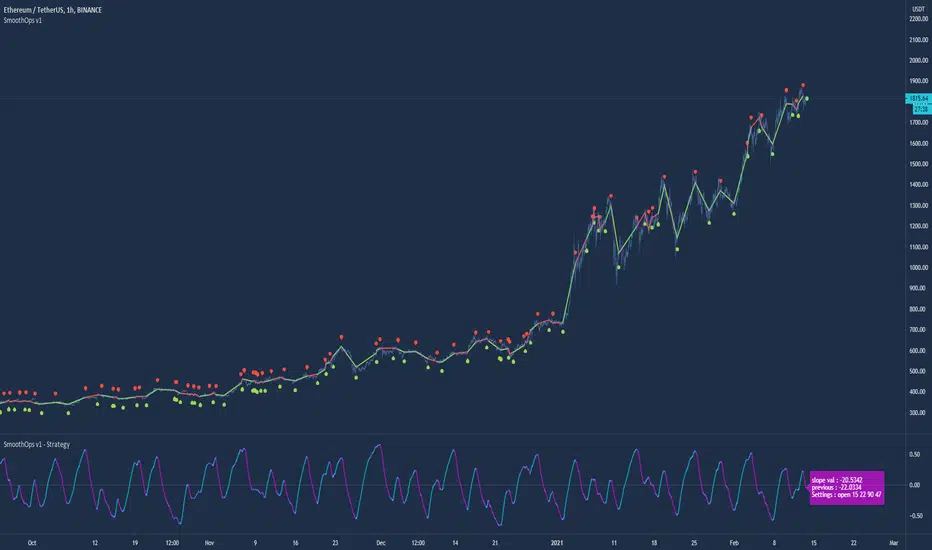
SmoothOps v1 - StudyThe purpose of this script was to fine tune an indicator on BTCUSDT . I think the results speak for themselves in the study version.
This is a script that uses the MACD to predict future price movement. The original MACD signal lags too much for my taste so I went searching for something that could give signals sooner. I decided a smooth macd would help filter out noise and grabbing the highest values and lowest values over the past number of bars. I spent several days backtesting different settings and combinations of signals to arrive at what you see now. This strategy has been fine tuned for BTC /USDT on Binance, so I suggest you only use it for that. Any other coin/pair and exchange will need a new backtest since the data will be different. This is not a generalized indicator like everything else. It's specifically good at one thing: prediction BTCUSDT on Binance.
I wanted to also add the histogram from the study version but there wasn't a good way to do that, so I came up with a visual solution using color transitions on the 168sma. When the color changes from blue to red it means the histogram is reversing.
I added forecasting to the moving averages to help people predict future movement so they can make decisions by something other than just a sign of when to buy/sell.
There is a transition prediction feature that blurs the macd signal to show when a reversal may occur before it happens.
I also added precitions into the indicator that show when there may be a possible bounce or major move because of a current squeeze in the moving averages.
And finally...
My biggest issue with indicators that other people sell is that they become visually deceptive when using supports and buy/sell signs. I came up with a solution that shows you exactly if you made profits during the trade or not. Hopefully this will inspire others to do something similar.
How to use:
Use only on BTCUSDT Binance.
Set the preset to the timeframe you want. I HIGHLY suggest only using the 1h timeframe. It gives the best profit over time.
Set the preset to custom if you want to try using your own settings.
You can change the source input if you want. ohlc4 usually works best for 1h.
Adjust the moving averages to your liking. You can also toggle the checkbox to completely remove them.
Turn on/off the forecasting of the moving averages.
Turn on/off the additional signals with the checkbox.
Transition prediction uses a blur variable to signal when the macd might be slowing down and reversing.
Bounce prediction and sensitivity tries to find possible reversal areas when price falls too fast or hits a specific moving average.
Macro signals just tries to show when price is above the 168moving average to get the macro trend.
Squeeze prediction indicates when a possible strong move may occur. Could go up or down though.
Show profit is my favorite part because it shows if you made profit during the last trade visually and non deceptively.
Bjorgum Triple EMA Strat-This script uses a triple EMA strategy to establish trend direction and reversal points
-Inputs are smoothed with Heiken Ashi values to reduce whipsaws, while providing timely execution
-Buy and sell indications are dictated by bar color
-Bar color is dictated by the candle close value in relation to the EMAs, specifically the faster of the 3
(If candle closes above or below the fast and intermediate averages, a buy or sell signal is indicated by bar color change)
-If the close falls between the two a cautionary signal is given. The viewer can hold, or take profit, or evaluate other indicators for clues
-Best results are obtained when coupled with Bjorgum TSI and Bjorgum RSI for confirmation of signals (see TradingView profile)
@Bjorgum on Stocktwits

Swing Low Sweet ChariotI've been using this indicator now for the past few months and seen some very large profits as a result of it.
I've been using this successfully on the one hour FX charts, but seems to work equally as well on higher or lower time frames (not less than 30min).
I've added in some support and resistance functionality and plenty of settings to play with to fine tune to your strategy.
One of the main reasons that I've added in some support and resistance is that there are some times when an indicator is triggered very close to a S&R point then I may not take the trade.
Additionally to the indicator, I'll use trend lines, ADX and RSI to confirm the trend.
Alerts are set up for Long Entry, Short Entry, Long Exit and Short Exit.
Not that the exit points are approximate and won't hit the peaks, however they will prevent price retracement.
Offering 5-day free use of the indicator and then after that it will be £100/yr if you like the indicator. This will also cover all future updates.
Happy to answer any questions or send over other screenshots of currency pairs. Also happy to work with any other users if they have any ideas for improving (i.e. automated trend lines).
Cheers
Mike

[HTI2] Hiubris Trend Indicator 2This is the Study version of the Hiubris Trend Indicator 2 (Used for Alerts)
After testing several strategies for months and comparing them to the standard 'Buy and Hold' method, we've found the best performing strategy for BTCUSDT
We simplified it to make it more user-friendly (We've only added 1 optional exit: a % SL) and left all the inputs adjustable, so it can be optimized for ANY pair!
This is a Trend Indicator! This means that the '% Profitable Trades' is not the main focus, but catching every trend swing. When trying to catch every trend swing, naturally alot of the them might be unprofitable, especially in sideways markets. The idea behind this strategy is to catch all the significant trend movements, which are alot more profitable than all the 'sideway market' losses
This indicator is fully adjustable and matches exactly the published strategy!
The user has the option to setup alerts for all chart signals (Entries, Re-Entries, Stop-Loss)

TSI CCI Hull with profit$$$This is a modified version of @SeaSide420 TSI CCI Hull with profits exit on long and short order
ORIGINAL SCRIPT:
/// /// feel free to edit/improve and comment

DMT Ladder AutobotDMT Ladder Autobot Study it's unique super trend indicators that measure the volatility from the current price action with ATR recognitions and custom setting
in this version, we can find that DMT Autbot also Ladders long entry and short entry in 4 different steps you can set your calculations depending on your requirements and pair volatility calculations
to recover your entry DMT will turn loosing trading into winning trades with the right risk management.
1 long signals
4 ladder Long add signals
1 short signals
4 ladder short add signals
1 dynamic stop calculated from your average entry price
1 dynamic take profit calculated from your average entry price
Please pm me for access or larger explanations about the script or for full pdf tutorial
thx for your support
@Shenlong

PS3X Strategy TesterPS3X Strategy Tester is a completely new strategy built from the ground up as a successor to previous 1.0 and 2.0 versions of Profit Sniper.
Offering up huge improvements, including multiple position triggers, derived from Bollinger Bands and Chande Momentum as well as our own bespoke stochastic ribbons that provide trend pivots.
So how does it work?
PS3X Strategy Tester allows you to tailor your preference for waiting for either Stochastic Ribbon cross only, Ribbon Cross followed by Chande Confirmation, or Ribbon Cross followed by rising/falling MACD for additional market structure confidence.
Strategy exits can be configured to exit on % change of MACD histogram indicating a direction change, and additionally using our revolutionary "Profit Lockin" to provide a stepped lock in of profits according to your preferred risk strategy. Commision of 0.05% has been added to represent "limit in-market out" trading, but please tailor this again to your preferred trading approach.
If you would like access, please send me a PM.

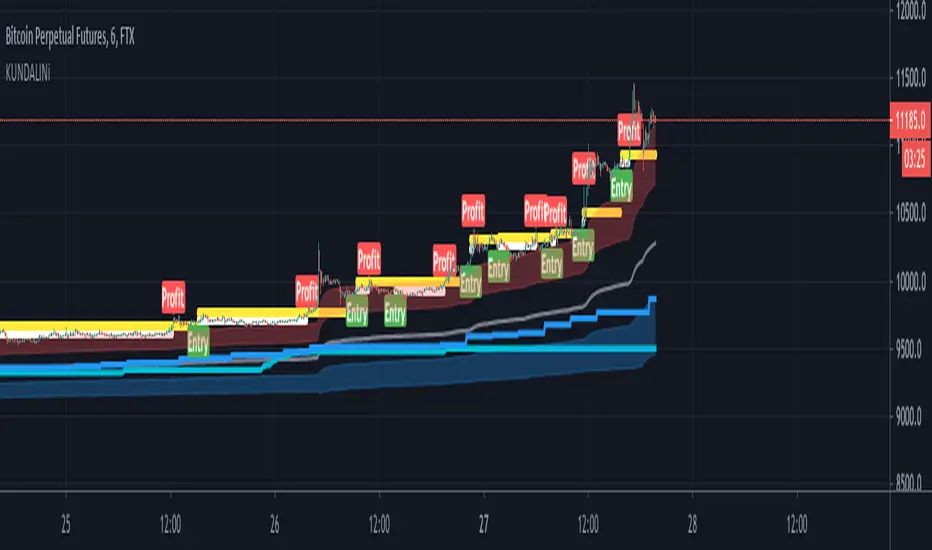
KUNDALINiThis is the STudy Version of The Kundalini is a technical indicator. Based on algorithm calculations, this indicator extrapolates the previous price for the next bar. Plus addition Multi time frame ATR volatility Reading environment for higher conditions
Here is how Dominator is calculated:
1. The study estimates the price projected for the next bar. The estimated price is based on the algorithm method.
2. The study extrapolates this value to find a projected price change for the next bar.
The resulting extrapolated value is shown as a histogram on a lower subgraph. By default, sections of the histogram where the extrapolated value is increasing are shown in green; sections corresponding to the decreasing value are shown in red.
Note: Value projection is purely mathematical as all calculations are based on algorithm averaging of previous values.
additional volatility models clouds on blue and red for bearish and bullish markets
Overlay True
The strategy includes 3 different adjustable levels for the ladder , plus automatic adjustable stop loss and takes profit calculated from your average entry price after each ladder adds.
Adjustable BAcktest Window.
1 long signals
3 ladder long add signals
1 short signals
3 ladder short add signals
1 dynamic stop calculated from your average entry price
1 dynamic take profit calculated from your average entry price
Please Private Msg me if you like more info about the script Full pdf available or if you need access to it
thx for your time and support

SMA Cross strategyThis is a simple strategy which is always profitable and trades better than most premium channels and I give it out for free :)
Working very good on ETHUSDT futures on binance :)

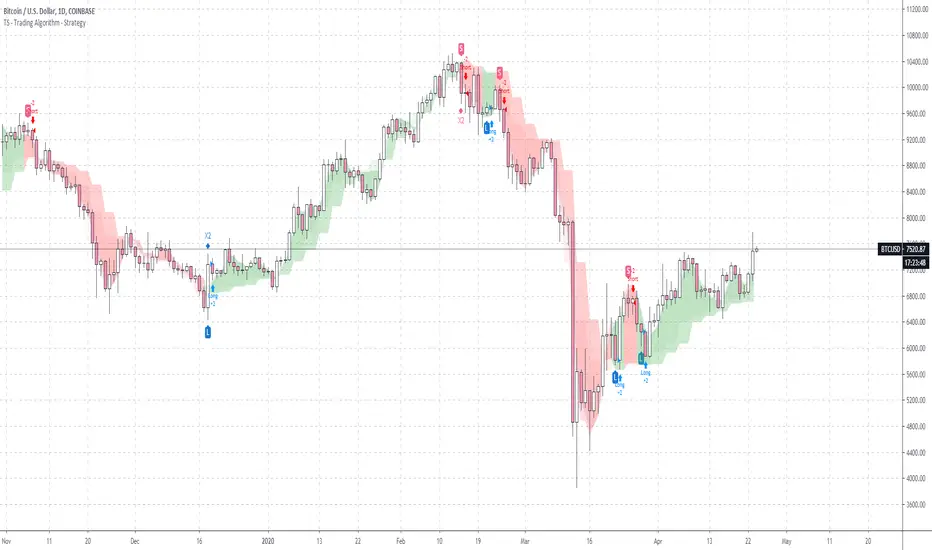
TS - Trading Algorithm - StrategyStrategy to the bespoke TS - Trading Algorithm . Highly profitable cryptocurrency trading model.
Access to both the backtesting strategy & indicator is paid - PM me for details.
Indicator does not repaint and has no discretionary approach - you can follow blindly and take advantage of the performance.
Takashi Triangular Arbitrage | 2nd Gen | [Alerts]Spot discrepancies between three currencies: these opportunities are rare and usually benefit to traders using advanced programs. You can now set up alerts and discover those for yourself.
This indicator signals opportunities for executing triangular arbitrage. Triangular arbitrage is the result of a discrepancy between three different currencies that occurs when the currency's exchange rates do not exactly match up. These opportunities are more frequent at cryptocurrency markets. The trader would exchange an amount at one rate (Currency_B/Currency_A), convert it again (Currency_C/Currency_B) and then convert it finally back to the original (Currency_C/Currency_A), and assuming low transaction costs, net a profit.
Example:
As per standard inputs, the trader would use US dollars to buy BTC (BITFINEX:BTCUSD), use BTC to buy NEO (BITFINEX:NEOBTC), use NEO to buy US dollars back (BITFINEX:NEOUSD). Whenever the quantity of US dollars bought back is higher than 1% from the initial amount, the indicator will send an alert signaling an arbitrage possibility.
Disclaimer: triangular arbitrage requires advanced automation tools and is only possible if there is enough liquidity to quickly execute all 3 trades at prices used on the indicator.
Inputs
Symbol 1
Symbol input. First step currency to initiate triangular arbitrage. (Currency_B/Currency_A)
Symbol 2
Symbol input. Second step currency to continue triangular arbitrage. (Currency_C/Currency_B)
Symbol 3
Symbol input. Final step currency to finalize triangular arbitrage. (Currency_C/Currency_A)
Discrepancy %
Float input. Amount in percent of profit return after triangular arbitrage is finished. Transaction fees not included.
To get access to this and other scripts check links below.

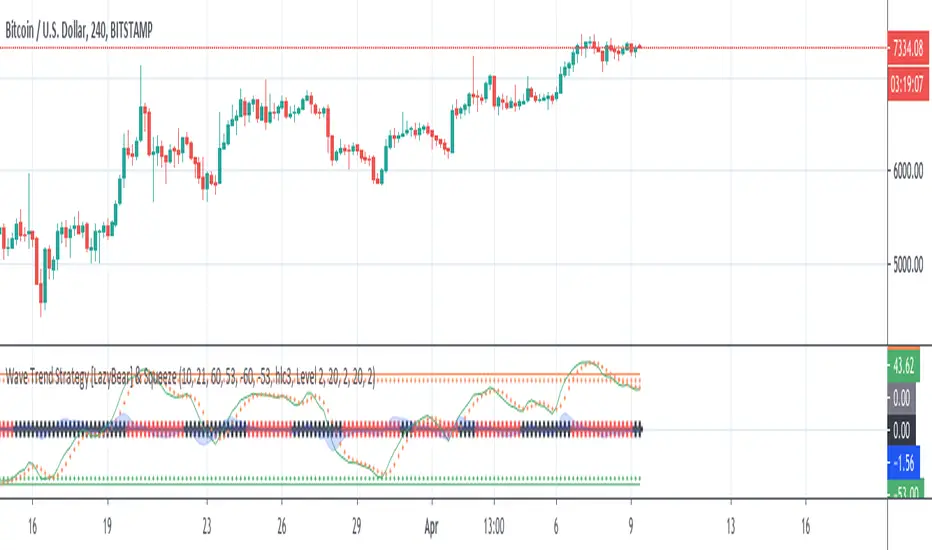
Wave Trend Strategy [LazyBear] & SqueezeThis strategy is a port of famous script Wave Trend Oscillator with a plus: squeeze indicator (LazyBear).
@author LazyBear
Original study from LazyBear
Scope of this port is to identify corrects inputs to get best results from signals that indicator gives.
The squeeze gives a further filter before orders and avoid to enter in a flat market period.
I attached it to chart with heikin ashi candles to have a better result and remove noise: results are good.
Please use comment section for any feedback.
Next improvement (only to whom is interested to this script and follows me): study with alerts on multiple tickers all at one. Leave a comment if you want to have access to study.
********************************** IMPORTANT*******************************
I have developed an expert advisor for metatrader4 (MT4): results of expert advisor form 2015-01-01 to 2018-11-25 are very good with low drawdown and good profit.
********************************************************************************