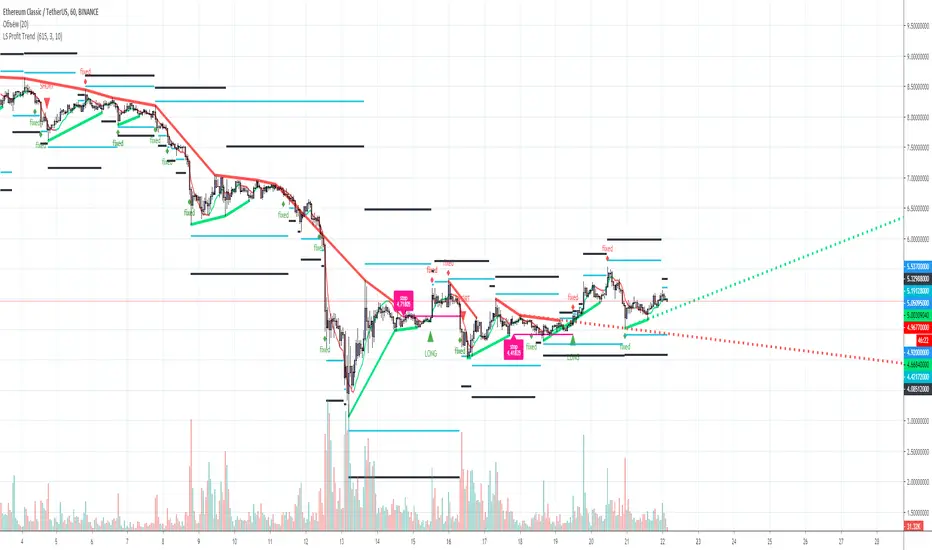
BT Profit Sniper: Insiders EditionBT Profit Sniper: Insiders Edition is an Strategy accompaniment for “Profit Sniper : Insiders Edition”, designed to evaluate the success of the long & short alerts generated to facilitate trading in BTCUSD.
The flags are derived from Bollinger Bands and Chande Momentum operating in higher & lower timeframes, as well as our own bespoke stochastic ribbons that when combined, provide insight into trend pivots as they happen.
For access, please send us a Personal Message.
Cari dalam skrip untuk "profit"

TARI FX USOILHi guys,
this is my new strategy for USOIL WTI!
It works in Daily chart, so you need just a few seconds per day to work with it, very short time to get nice profit!
Stop Loss is set in 500 pips, Take Profit in 600 pips, but for OANDA TP 6.000 and SL 5.000.
The backtest started 36 years ago, so the equity is very solid!
I used 1.000$ as initial capital, and 30 contracts per trade, getting 18% of income per year, and a Max DD of 30% only.
Ask for a free trial, and check by yourself what income whould have been generated investin 100% of the equity!!
Enjoy your wallet!
Tari.

RSI LevelsRSI Levels
- The relative strength index ( RSI ) is a technical indicator used in the analysis of financial markets.
It is intended to chart the current and historical strength or weakness of a stock or market based on the closing prices of a recent trading period.
- This indicator allows us to visualize the levels of rsi in the chart, so that we can calculate take profit and stop points in a simple way,
knowing what position the price is currently in relation to these levels and how much space we have.
- We can also visualize the slope of the three levels of rsi , overbought, oversold and level 50, something that is not possible in the oscillator version.
- It allows you to display 2 rsi values at the same time.
- Allows to change the color of candlesticks based on rsi.

ATR based Stop and Take-Profit levels in realtime Little tool to quickly identify stops and take-profit levels based on Average True Range. User can change ATR multipiers, as well as the ATR length used. Green and red lines show these levels; plot is visible over last 8 bars only to reduce clutter. Label showing the current ATR, up above the last bar

Expert studio strategy 1 - GBPUSDThis is part of a series of strategies developed automatically by a online software.
I cannot share the site url, which is not related to me in any way, because it is against the TV reules.
This strategy was optimized for GBPUSD, timeframe 1D, fixed lots 0.1, initial balance 1000€.
LOGIC:
- LONG ENTRY when previous candle is bear
- LONG EXIT: RVI > signal line
- SHORT ENTRY when previous candle is bull
- SHORT EXIT: RVI < signal line
NOTE: I considered the open of actual candle instead of close otherwise there will be a back shift of 1 candle in pine script
Take profit = no
Stop loss = no
I have also a study with alarms.
Please use comment section for any feedback.

Harsachs Grinder StrategyThis is the first public script of Harsachs.
Harsachs Grinder Strategy buys and sells depending on the Average True Range and Moving Average data.
It has 4 functions; Buy, sell, buy stop and sell stop.
Use this strategy to trade all equities in 15 minutes timeframes. Don't forget to take profit manually because Harsachs Grinder Strategy may wait for Average True Range to hit to buy or sell stop.
Please like the script before using it. Ask your questions in the comment section below!

Scripting Tutorial B - TManyMA - Commission/FeesThis script is for a triple moving average strategy where the user can select from different types of moving averages, price sources, lookback periods and resolutions.
Features:
- 3 Moving Averages with variable MA types, periods, price sources, resolutions and the ability to disable each individually.
- Crossovers are plotted on the chart with detailed information regarding the crossover (Ex: 50 SMA crossed over 200 SMA )
- Forecasting available for all three MAs. MA values are forecasted 5 values out and plotted as if a continuation to the MA.
- Forecast bias also applies to all forecasting. Bias means we can forecast based on an anticipated bullish , bearish or neutral direction in the market.
- To understand bias, please read the source code, or if you can't read the code just send me a message on here or Twitter . Twitter should be linked to my profile.
- Ribbons added and on by default. Optional setting to disable the ribbons. 5 ribbons between MA1 and MA2 and another 5 between MA2 and MA3.
- Ribbons are alpha-color coded based on their relation to their default MAs.
- Ribbons are only visible between MAs if the MAs being compared share the same Type, Resolution, and Source because there is no way to consolidate those three in a simple manner.
- Ribbon values are calculated based on calculated MA Periods between the MAs.
- Converted the existing study into a strategy.
- Strategy only enters long positions with a market order when MA crossovers occur.
- Strategy exits positions when crossunders occur.
- Trades 100% of the equity with one order/position by default.
- Ability to disable trading certain crosses with input checks.
- Ability to exit trades with a take profit or stop loss.
- User input to allow quick changes to the take profit or stop loss percentages.
- Strategy now calculates on every tick
- Strategy also includes fixed commission values based on Coinbase standard order fees
This script is meant as an educational script with well-formatted styling, and references for specific functions.
*** PLEASE NOTE - THIS STRATEGY IS MEANT FOR LEARNING PURPOSES. DEPENDING ON IT'S CONFIGURATION IT MAY OR MAY NOT BE USEFUL FOR ACTUAL TRADING. THE STRATEGY IS NOT FINANCIAL ADVICE ***

Scripting Tutorial A - TManyMA - StopsThis script is for a triple moving average strategy where the user can select from different types of moving averages, price sources, lookback periods and resolutions.
Features:
- 3 Moving Averages with variable MA types, periods, price sources, resolutions and the ability to disable each individually.
- Crossovers are plotted on the chart with detailed information regarding the crossover (Ex: 50 SMA crossed over 200 SMA )
- Forecasting available for all three MAs. MA values are forecasted 5 values out and plotted as if a continuation to the MA.
- Forecast bias also applies to all forecasting. Bias means we can forecast based on an anticipated bullish, bearish or neutral direction in the market.
- To understand bias, please read the source code, or if you can't read the code just send me a message on here or Twitter. Twitter should be linked to my profile.
- Ribbons added and on by default. Optional setting to disable the ribbons. 5 ribbons between MA1 and MA2 and another 5 between MA2 and MA3.
- Ribbons are alpha-color coded based on their relation to their default MAs.
- Ribbons are only visible between MAs if the MAs being compared share the same Type, Resolution, and Source because there is no way to consolidate those three in a simple manner.
- Ribbon values are calculated based on calculated MA Periods between the MAs.
- Converted the existing study into a strategy.
- Strategy only enters long positions with a market order when MA crossovers occur.
- Strategy exits positions when crossunders occur.
- Trades 100% of the equity with one order/position by default.
- Ability to disable trading certain crosses with input checks.
- Ability to exit trades with a take profit or stop loss.
- User input to allow quick changes to the take profit or stop loss percentages.
This script is meant as an educational script with well-formatted styling, and references for specific functions.
*** PLEASE NOTE - THIS STRATEGY IS MEANT FOR LEARNING PURPOSES. DEPENDING ON IT'S CONFIGURATION IT MAY OR MAY NOT BE USEFUL FOR ACTUAL TRADING. THE STRATEGY IS NOT FINANCIAL ADVICE ***

Algorithm Builder UNIVERSAL (m30)Hello traders 👋
I. 💎 SCRIPTS ACCESS AND TRIALS 💎
1. Every 3 weeks trial request access has to be done through my website .
2. My website URL is in this script signature at the very bottom (you'll have to scroll down a bit and going past the long description) and in my profile status available here : Daveatt
3. Many video tutorials explaining clearly how all our indicators work are available on your website > guides section.
4. You may also contact me directly for more information regarding the trading method included in the indicator or how to access it
2.1 Forewords
This indicator/trading framework is available only to our PREMIUM users.
We decided to call it "UNIVERSAL" because the tool gives very decent signals for STOCKS/PENNY STOCKS/FOREX/CRYPTO (USD & BTC pairing)/INDICES/COMMODITIES trading
(the asset classes that I'm not listing are not tested yet; though we should cover a wide range of tradable assets here)
This is a by-product of defining an algorithmic trading method... we were surprised ourselves those past few weeks while trading with it.
The entries displayed are most of the time amazing, and the invalidations allow to reduce the losses considerably (more wins and less losses => delighted trader)
A few examples below showing why it's "universal"
FOREX
INDICES
COMMODITIES
CRYPTO (BTC pairing)
The tool works in m30 timeframe but won't work with any other timeframe . Even if applied on a 30-minutes chart; we included higher timeframe indicators to enter more securely.
It includes :
- our proprietary method with fixed entries
- a hard exit system (built-in stop-loss)
- 🔔 Compatible with dynamic alerts 🔔
Dynamic alerts are bringing automated trading to a whole new level. The third-party solutions capturing TradingView alerts are able to use them.
- (optional) we let the users decide to use or not our built-in Trade Manager.
Regardless of the Trade Manager is used or not, one must mandatory exit, once a vertical hard exit bar appears.
- the Algorithmic Supports and Resistances used as safeguards and take profit zones.
Final words
We made it as simple as we could (to be honest it's a very simple system for the end-user) - even with several hundreds of calculations in the indicator.
Please hit me up for any question/feedback/comment
Become the BEST trader that you can be
Dave

L&S PROFIT SCALP Indicator for scalp trades for TF 1-15 minutes. 1-4 signals per day depending on the currency pair. Suitable for all crypto exchanges, Forex, binary options. Signals+ take profit Levels.

L&S PROFIT TREND Trend indicator for TF from 1 hour and above, for any trading pair, any exchange, binary options. Signals+ Take profit levels. 90% good signal and take profit 1.
P/L count for MACDSimple and effective P/L Count (based on MACD indicator) shows you when MACD give profit and when it lead to loss. PL Count consist of three plots: green (profit), red (loss) and orange (0 by default, but you can setup it as minimum profit level. Go into deal when green(profit) crossover red(loss) and exit when red crossover green. Use it together with MACD for determine deal direction. For some instruments deal opens when green crossover orange minimum profit level (not cross green and red)) .

[VIP] Long/Short Strategy 79-80 Profit Percentage or even moreThis is using Toolkit buy and sell:
You have 7 days trial, so you should make sure that you make a profit instead of loss
We have 4 strategies named 01, 02, 03, 04 and will be added more soon
Disclaimer
Tested from 3 minutes to 1 Day time frame
Possible repainting because I use security function
I use Pinescript v4
barmerge.gaps is disabled
barmerge.lookahead is enabled
Configuration
Intense Level: default is 6, to provide signal frequency to the chart, the lower number will return more signal, the image is 3, means more attentions or actions*] Possible repainting because I use security function
Custom Timeframe: default is using chart time frame, to calculate signal based on different timeframes without change the chart time frame.
Strategy: Other approaches long or short algorithm

HL ChannelHL Channel
- The channel shows the trend based on highs and lows, and possible points of take profit and exists
- Trend Indicator for Long and Short entries
- It can be used as a trend indicator or as a trailing stop loss
- Long and Short Labels and Alerts
- Configurable in Periods and Simple Mode
Simple Mode:

omid Strategy (Get over 1000% profit on Swing Trading)Make the highest possible profit in the market without any pressure, you will not need any other trading tool with this strategy, all the market noise has been eliminated.
*This strategy is tailored to the btcusd market and the default settings are proportional to the daily timeframe.
** You can change the settings to get the best results in other markets or timeframe.
***Get in position and relax for months.

Extreme ScalpingThis is a test of an easy scalping method: buy if actual close is below forecast close and sell if actual close is above forecast close. Take profit and stop loss shall be very small (few pips) as in most of scalping strategies.
No filter is used for only long or only short positions, but you can select buy only or sell only based on other indicators or whatever you feel is the direction of trading.
NOTE: you can add this strategy to your chart but you should modify the backtest day otherwise you will get an error due to calculation limits of pine script. For example, on one minute chart, you should set the backtest day from today only. For past days, set both start day and and day.
I have also a study with alarms.
Please use comment section for any feedback.


Average True Range Take profit (ATR)Average True Range Take Profit
An objective method of determining an initial Take Profit and Stop Loss, based on true market volatility and not arbitrary price levels.
Take Profit Levels and Stop Loss Levels are calculated based on multiples of Average True Range
Features & Functions
Option to switch between long or short
Default Value
Take Profit 1 = 1x ATR.
Take Profit 3 = 2x ATR.
Take Profit 5 = 3x ATR.
Stop Loss 2 = 1.5x ATR.
Basline 13 exponential moving average (EMA) (2)
Extra options ATR
Take Profit 2 = 1,5x ATR.
Take Profit 4 = 2,5x ATR.
Take Profit 6 = 3,5x ATR.
Take Profit 7 = 4x ATR.
Take Profit 8 = 4,5x ATR.
Take Profit 9 = 5x ATR.
Stop Loss 1 = 1x ATR.
Stop Loss 3 = 2x ATR.
Extra options MA
Simple moving average (SMA) (1)
Weighted Moving Average (WMA) (3)
Hull moving average (HMA) (4)
Volume Weighted Moving Average (VWMA) (5)
R moving average (RMA) (6)
Triple exponential moving average (TEMA) (7)
Crypto Break-even FeeWhen I started trading cryptocurrency, I lost money because I didn't take the fees enough into account. Therefore I created my own indicator to quicqly see the break-even selling price of the selling price if I want a predifined profit level.
2 lines are added to the graph. These lines move together with the current price.
- One line indicating the break-even selling price (depending on your maker/taker strategy). For beginners I suggest taking the taker strategy (mostly 0.25%)
- Another line indicating the selling price in order to make a predifined profit %
There are 2 parameters you can set:
- Desired profit (%)
- Maker/Taker Fee (%)
Always happy with a little appreciation ;-) Bitcoin wallet: 18522cAc7YDwwXTvtckXKb1kP33upVDRFR

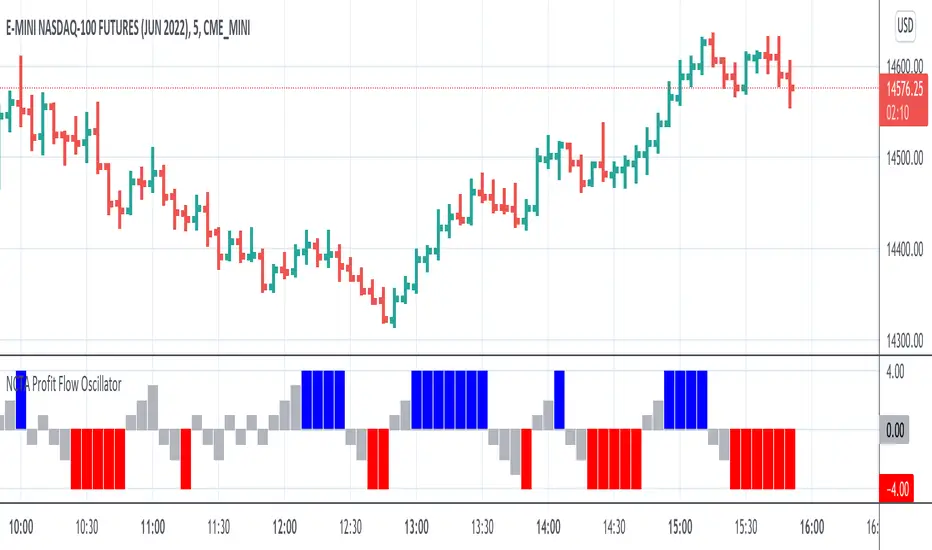
NCTA Profit Flow OscillatorProfit Flow Oscillator
The Profit Flow Oscillator is one of two technical pattern indicators that are part of the Profit Flow Analytics.
New Cycle Trading and Analytics is a group of traders creating market analytics for traders. The objective is to take complex combinations of multiple technical pattern indicators and present to the trader a simple, single signal entry.
The Profit Flow Oscillator is excellent in short 1, 3, and 5 minute timeframes for futures traders and short term options traders. Longer timeframes such as the 5, 10, and 30 minute timeframes work well for options traders.
The Profit Flow Oscillator consists of a simple, single entry indicator designed to provide an entry very close to the shift on the intra-day cycle. It is designed to filter out false signals and provide the trader with an optimum timing of an entry.
HOW TO USE: Go long when a blue bar appears and go short when a red bar appears. These prints very closely identify the beginning of a new cycle
The Profit Flow Oscillator, which is part of the Profit Flow Analytics set of indicators, is traded in a live trading room every market day, hosted by our friends at Options Money Maker.
To learn more and to get a free trial of the Profit Flow Oscillator, use the following link:
www.newcycletrading.com
NQU2019
SP:SPX
Pulse Profits Strategy v2.0This is the strategy version that is included with the Pulse Profits+ study. This strategy is based on the Chande Momentum Oscillator and Elder's Force Index(EFI).
The strategy includes options to add a stop loss and adjust all input options based on specific usage.

Pulse Profits+ Study v2.0Here is the updated version of our Pulse Profits+ study based on the combination of the Chande Momentum Oscillator and Elder's Force Index . This version was updated to include stop-loss and improved signals
Red background highlights mark sell signals and green highlights represent buy signals. All signals are accompanied by corresponding alerts that can be tailored for the various automated trading platforms.
All indicators can be found on our website in the bio and come with their strategy equivalents

