EMA Cross Alerts /w Take Profit and StoplossSimple Alert for Automated Trading Based on EMA Cross.
Also includes the ability to add Take Profit, Stoploss, and Trailing.
PM for use.
Cari dalam skrip untuk "profit"

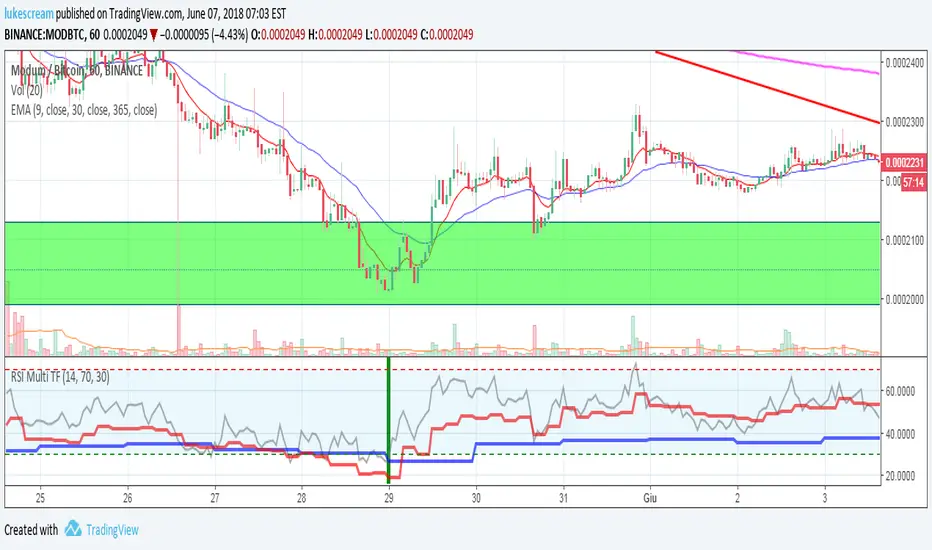
RSI Multi Time Frame - Spot Panic Sell Moments and profit!Union of three RSI indicators: 1h, 4h and daily. In order to show 1h RSI, you have to set it as active time frame on the chart.
Purpose: spot "triple oversold" moments, where all the three RSI are under the threshold, which is 30 by default but editable.
Target Market: Cryptocurrencies. Didn't try it on other ones, may work as well. Fits Crypto well as, by experience, I can tell it usually doesn't stay oversold for long.
When the market panics and triple oversold occurs, the spot is highlighted by a green vertical bar on the indicator.
The indicator highlights triple overbought conditions as well (usually indicating strong FOMO), but I usually don't use it as a signal.
I suggest to edit the oversold threshold in order to make it fit the coin you're studying, minimizing false positives.
Special thanks to Heavy91, a Discord user, for inspiring me in this indicator.
Any editing proposal is welcome!
I reposted this script, as the first time I wrote it in Italian. Sorry for that.
Autoview/Profit Trailer AlertsAlert Script for use with Autoview/Profit Trailer Scalping Strategy. Specifically intended for use with Autoview + Profit Trailer. Only contains usable Buy alerts.
Autoview/Profit Trailer Scalping StrategyScalping and Dollar Cost Averaging strategy specifically intended for use with Autoview + Profit Trailer.

BTC Mass profit alarmThis is a modified version of my "BTC Mass profit" strategy so that you can add alerts when a signal is produced

The Falcon v2 Long only strategy Using Stop loss and take profitHello,
Here is a backtest result from the beginning of the year on BTC. The white line is the Buy & Hold return.
Comission is set to 0.05% and there is no repainting : the price variable I'm using is heikenashi(tickerid).
The indicator is built upon RSI, EMAs and some other personnal tricks so predict trends.
I coded a stop loss and take profit system : the script will simply buy and sell upon conditions.
As usual I am selling access to the script, If some are interested I will publish an alert setup version. I am also open to development or reverse engineering commissions.

Wave & Trend Autoview Advanced Indicator & AlertsWave & Trend Autoview Advanced Indicator & Alerts - Version 1.0
Overview
This Lazybear inspired indicator is a complex and deeply customisable wave based oscillator that allows for full customisation of parameters and 3 toggleable strategies to allow the user to shape their trading methods to their preferences. The indicator was built for use with Autoview using all functionality or in conjunction with Profit Trailer 2.0 to handle the buying side of logic at an even more advanced level. The creation of this was fuelled by the need to create a cheaper alternative to those that charge monthly for similar signals, which I am deeply against.
Features
Wave Based Buying - those familiar with buying based with RSI based approaches will feel very comfortable with this signal as it detects areas of deeply oversold / overbought and buys on the reversal
Fully customisation - All parameters are open for customising to allow the trader to build their own strategy and adapt from market to market
3 Built In Signal Strategies - Clearly labelled in the parameters as A/B/C are the built in strategies that all have completely unique buying / selling logic and are based on different risk / reward levels. Include all 3 or focus on one or two to build your perfect strategy
Downtrend Detection - This indicator has an in-built downtrend detection that is modifiable in the parameters meaning no more deep bags - the strategies will always try to buy on the uptrend.
Access
48H Trial Period By Request
Full Access is 0.15 ETH , one time fee for full unlimited access to the indicator and future updates but also my well received support and mentoring on my work afterwards to help you built a perfect strategy.
Previous owners of my work get 50% off the price for being one of my supporters.

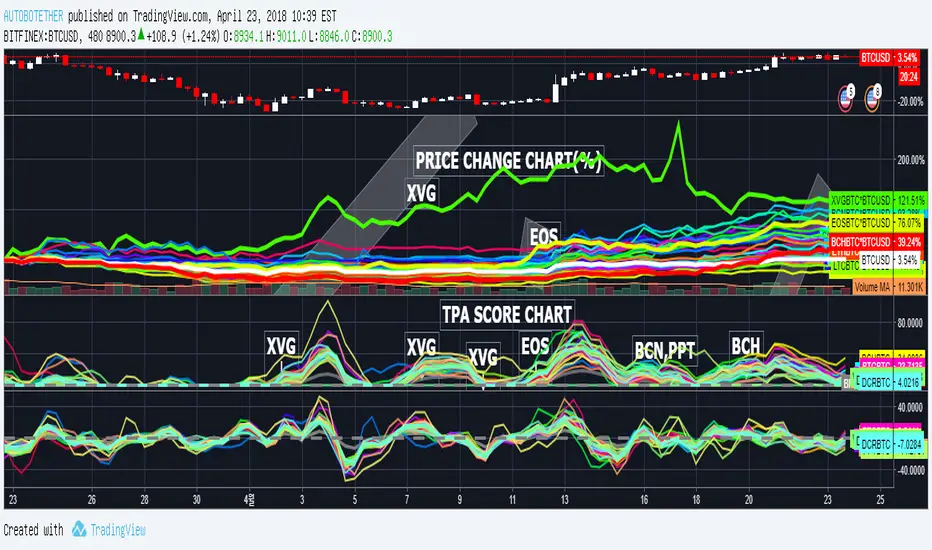
TAKE PROFIT AGAIN SCORE[CATCHER](TPA)_MARKETCAP또땃 스코어 보조용 스타팅 파동 감지지표 시가총액 ver
TAKE PROFIT AGAIN SCORE (TPA)_MARKETCAP
------------------------------------------------------------------------------
This indicator was created to complement "Take Profit Again Trend Score (Crpto Catcher) _Marketcap".
Take Profit Again Trend Score(Crpto Catcher)_Marketcap
It is aimed to start or stop the decline in value and detect the beginning of the wave.
The coin that goes up the river of score wave is likely to give a good performance.
The TPA Trend Score indicator is a good indicator of the adequacy of a sell-off.
If the starting score is negative even though the TPA score is the highest, you have to set and hold a loss cut on the chart or chart.
---------------------------------------------------------------------------------------------
이 지표는 "Take Profit Again Trend Score(Crpto Catcher)_marketcap"를 보완하기 위해 만들어졌습니다.
시작하거나 대세가치하락에서 견뎌내고 파동시작을 감지하는 목적입니다.
점수 파동의 강물을 거슬러 올라가는 코인이 좋은 성과를 줄 확률이 높습니다.
TPA Trend Score 지표와 함께 매수매도의 적절성을 판단하기에 좋습니다.
TPA스코어가 가장 높더라도 Starting 스코어가 음수로 가게 된다면 매도 내지는 차트상 로스컷을 정하고 홀딩해야합니다.

TAKE PROFIT AGAIN SCORE(TPA)_MARKETCAP verTAKE PROFIT AGAIN SCORE(TPA)_MARKETCAP
또땃 스코어 상위시총 ver
------------------------------------------------------------------------------
This indicator is designed to find coins that are strong in market conditions.
It is recommended that users have an understanding of basic charts.
Careful investment is needed after the trend of the score itself has been on the downward trend.
Coins usually give the strongest return that run at the top of the score.
The realization of the profit on the chart must be done by the person himself.
When purchasing coins at the top of the score chart, we recommend the number of sheets at the adjustment point on the chart.
Because this index is a trend score, you may not be able to catch the start wave. To do this, use a starting wave catcher.
The coins listed in this index are coins of the highest rank in order of Market Cap and will be updated at regular intervals.
At last year's rise of coin, it is based on catching light coin, Qtum, ripple, Ada , Stella, Tron rise.
Indicator vouchers will only be available to a small number of paid subscribers.
Thank you.
---------------------------------------------------------------------------------------------
이 지표는 시장 상황에서 강세를 띠는 코인을 찾아내기 위해 만들어 졌습니다.
기본적인 차트에 대한 이해가 있는 사용자가 사용하길 권합니다.
스코어자체의 추세가 하향을 한 이후는 신중한 투자가 필요합니다.
통상 가장 강한 수익을 주는 코인이 스코어 최상단을 달립니다.
차트상의 수익실현은 본인이 직접 수행해야 합니다.
통상 스타팅 파동을 잡아내는 스타팅 파동 캐쳐와 함께 사용합니다.
스코어차트상 최상단의 코인을 매수 할 시 차트상 조정지점에서 매수를 권합니다.
본 지표는 트렌드 점수 이기 때문에 시작 파동을 잡아내지 못할 수 있습니다.
이를 위해선 스타팅웨이브 캐쳐를 함께 사용합니다.
본 지표에 나와있는 코인들은 마켓 캡으로 상위등급의 코인들이며 일정 간격으로 업데이트 될 것입니다.
작년 코인상승장에서, 라이트코인,Qtum,리플,에이다,스텔라,트론 상승을 잡아낸 기반지표 입니다.
지표 이용권은 소수의 유료 구독 사용자들에게만 공개될 예정입니다.
감사합니다.
추가적으로 시장 싸이클 상에서 바닥 이후 가장 효과를 발휘하는 지표입니다.
마켓캡 상위 코인들에 대한 지표적용을 함으로 단발펌핑물림이나, 안정성을 떠난 매매에서 당신을 보호할 수 있습니다.
No Emotions indicator- Execute your trading plan EMOTIONLESSEmotions are one of the most important variable in trading
With this indicator you can execute your trade without any feelings ruining your plan
The idea is simple: you can monitor your trades by just looking at a row of colored squares, no need to watch the charts once entered a trade
Green square= you are in profit
Red square = you are in a loss
Yellow cross on green square = take profit hit
Purple cross on red square = stoploss hit
Just input the symbol, entry price (entrata), take profit and stoploss
From there, just watch the squares and no charts
Each row of squares is an entry, you can input up to 3 entries in this version
No Emotions= perfect trading execution
The code is protected but anyone can use it
if you enjoy this free indi, check out my main creation called "Stochastics Real Deal Indicator"

Volatility Profit (VPI) & Bollinger Bands (BB) [checkm8]Hello and welcome to my 2-in-1 indicator of Volatility Profit Indicator and Bollinger Bands.
Volatility Profit Indicator is a script inspired by Jim Berg, from a 2005 article titled "The Truth About Volatility". This is a set of bands, where the upper band is based on a moving average of highs over a given period, added to the average true range of the period. The lower band is based on a moving average of lows over the same given period, from which the average true range is subtracted. The formula is shown below:
VPI High Band = MA(HI, type, x) + y * ATR(z)
VPI Low Band = MA(LO, type, x) - y * ATR(z)
where... type = MA Type (default to Exponential) x = MA Period (default to 13) y = True Range Multiplier (default to 2) z = True Range Period (default to 20)
Bollinger Bands should be familiar by now, but they are calculated based on a moving average of a source ( / 3), added to a particular standard deviation of the source.
This indicator:
- Allows you to choose whether you want to plot the Volatility Profit Indicator or Bollinger Bands. By default, each will show three bands.
- Has pre-made color schemes to choose from to simplify your life.
- Has smoothing for the Volatility Profit Indicator
- Allows you to choose the source for Bollinger Bands
- Allows you to select what multiplier of the average true range the Volatility Profit Indicator plots, as well as what standard deviations the Bollinger Bands show.
If you have any additional questions, concerns, or suggestions - feel free to reach out.
All the best & happy trading.

Take Profit Again Score (Starting Wave Catcher)_BinanceTPA (Starting Wave Catcher)_BINANCE ver
또땃 스코어 보조용 스타팅 파동 감지지표 바이낸스 ver
------------------------------------------------------------------------------
This indicator was created to complement "Take Profit Again Trend Score (Crpto Catcher) _Binance".
It is aimed to start or stop the decline in value and detect the beginning of the wave.
The coin that goes up the river of score wave is likely to give a good performance.
The TPA Trend Score indicator is a good indicator of the adequacy of a sell-off.
If the starting score is negative even though the TPA score is the highest, you have to set and hold a loss cut on the chart or chart.
---------------------------------------------------------------------------------------------
이 지표는 "Take Profit Again Trend Score(Crpto Catcher)_Binance"를 보완하기 위해 만들어졌습니다.
시작하거나 대세가치하락에서 견뎌내고 파동시작을 감지하는 목적입니다.
점수 파동의 강물을 거슬러 올라가는 코인이 좋은 성과를 줄 확률이 높습니다.
TPA Trend Score 지표와 함께 매수매도의 적절성을 판단하기에 좋습니다.
TPA스코어가 가장 높더라도 Starting 스코어가 음수로 가게 된다면 매도 내지는 차트상 로스컷을 정하고 홀딩해야합니다.

Take Profit Again Trend Score(Crpto Catcher)_BinanceTPA SCORE_BINANCE ver
또땃 스코어 바이낸스 ver
------------------------------------------------------------------------------
This indicator is designed to find coins that are strong in market conditions.
It is recommended that users have an understanding of basic charts.
Careful investment is needed after the trend of the score itself has been on the downward trend.
Coins usually give the strongest return that run at the top of the score.
The realization of the profit on the chart must be done by the person himself.
When purchasing coins at the top of the score chart, we recommend the number of sheets at the adjustment point on the chart.
Because this index is a trend score, you may not be able to catch the start wave. To do this, use a starting wave catcher.
The coins listed in this index are coins of the highest rank in order of trading volume and will be updated at regular intervals.
At last year's rise of coin, it is based on catching light coin, Qtum, ripple, Ada, Stella, Tron rise.
Indicator vouchers will only be available to a small number of paid subscribers.
Thank you.
---------------------------------------------------------------------------------------------
이 지표는 시장 상황에서 강세를 띠는 코인을 찾아내기 위해 만들어 졌습니다.
기본적인 차트에 대한 이해가 있는 사용자가 사용하길 권합니다.
스코어자체의 추세가 하향을 한 이후는 신중한 투자가 필요합니다.
통상 가장 강한 수익을 주는 코인이 스코어 최상단을 달립니다.
차트상의 수익실현은 본인이 직접 수행해야 합니다.
통상 스타팅 파동을 잡아내는 스타팅 파동 캐쳐와 함께 사용합니다.
스코어차트상 최상단의 코인을 매수 할 시 차트상 조정지점에서 매수를 권합니다.
본 지표는 트렌드 점수 이기 때문에 시작 파동을 잡아내지 못할 수 있습니다.
이를 위해선 스타팅웨이브 캐쳐를 함께 사용합니다.
본 지표에 나와있는 코인들은 거래량순으로 상위등급의 코인들이며 일정 간격으로 업데이트 될 것입니다.
작년 코인상승장에서, 라이트코인,Qtum,리플,에이다,스텔라,트론 상승을 잡아낸 기반지표 입니다.
지표 이용권은 소수의 유료 구독 사용자들에게만 공개될 예정입니다.
감사합니다.

[MS-Take Profit & Trailing Stop] betaTake Profit & Trailing Stop trigger - this is beta quality script for internal testing only


TigerBot Pivot Profit Taker Study (Alerts)Visit our website or direct message us to learn how you can get started with TigerBot automation today!
This strategy is a custom solution that we have provided. At this time, it is a private, invite only script.
Note: This is a TigerBot Strategy, which means that it includes our full set of automation and risk management features such as:
Thorough event triggers for automated order execution
Profit/Loss Zones
Profit/Loss Indicators
Take Profit
Normal Stop Loss
Trailing Stop Loss
Advanced Trailing Stop
Profit Locker Stop Loss
Advanced Pyramiding Support
Leverage Support
Much more
Each TigerBot Strategy includes a set of 3 scripts that belong together:
STRATEGY - used for full-featured customization with all our visuals
STUDY - with alert triggers for automation
SKELETON - for faster backtesting without the visuals enabled
This is the STUDY version of this script. Please also see the other 2 related scripts.

TigerBot Pivot Profit Taker Skeleton (Faster Backtesting)Visit our website or direct message us to learn how you can get started with TigerBot automation today!
This strategy is a custom solution that we have provided. At this time, it is a private, invite only script.
Note: This is a TigerBot Strategy, which means that it includes our full set of automation and risk management features such as:
Thorough event triggers for automated order execution
Profit/Loss Zones
Profit/Loss Indicators
Take Profit
Normal Stop Loss
Trailing Stop Loss
Advanced Trailing Stop
Profit Locker Stop Loss
Advanced Pyramiding Support
Leverage Support
Much more
Each TigerBot Strategy includes a set of 3 scripts that belong together:
STRATEGY - used for full-featured customization with all our visuals
STUDY - with alert triggers for automation
SKELETON - for faster backtesting without the visuals enabled
This is the SKELETON version of this script. Please also see the other 2 related scripts.

TigerBot Pivot Profit Taker Strategy (Backtesting)Visit our website or direct message us to learn how you can get started with TigerBot automation today!
This strategy is a custom solution that we have provided for one of our clients. At this time, it is a private, invite only script.
Note: This is a TigerBot Strategy, which means that it includes our full set of automation and risk management features such as:
Thorough event triggers for automated order execution
Profit/Loss Zones
Profit/Loss Indicators
Take Profit
Normal Stop Loss
Trailing Stop Loss
Advanced Trailing Stop
Profit Locker Stop Loss
Advanced Pyramiding Support
Leverage Support
Much more
Each TigerBot Strategy includes a set of 3 scripts that belong together:
STRATEGY - used for full-featured customization with all our visuals
STUDY - with alert triggers for automation
SKELETON - for faster backtesting without the visuals enabled
This is the STRATEGY version of this script. Please also see the other 2 related scripts.

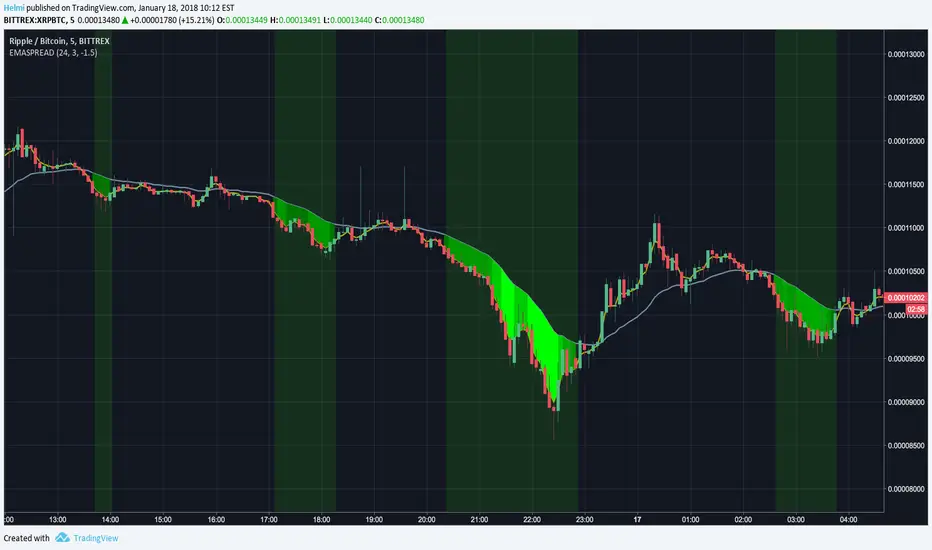
EMASPREAD Indicator for Profit TrailerThis is a graphical representation of the EMASPREAD strategy in Profit Trailer.

LOWBB Indicator for Profit TrailerThis is a graphical representation of the LOWBB strategy on Profit Trailer

SMAGAIN (Profit Trailer)Visualization Indicator for the SMAGAIN buy strategy for the Profit Trailer Crypto Trading Bot.

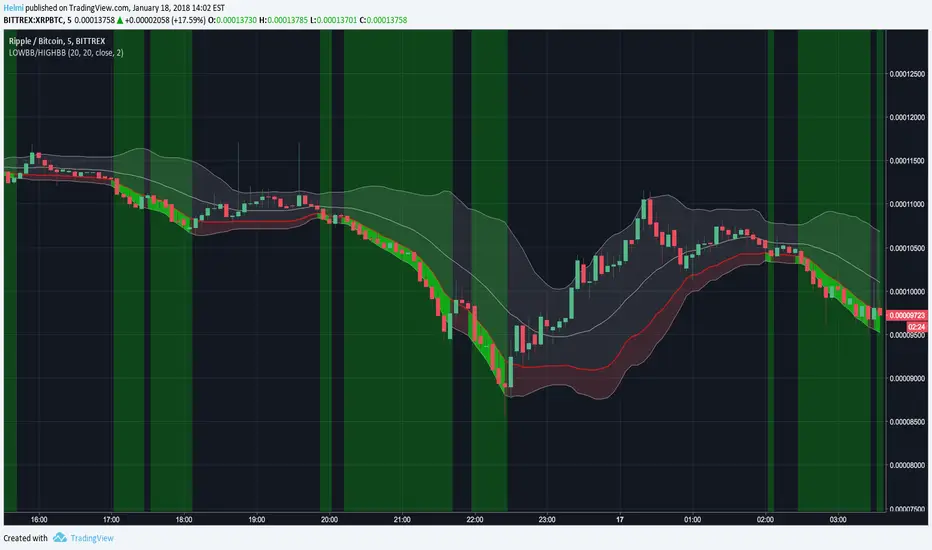
LOWBB / HIGHBB (Profit Trailer, @helmi)This indicator puts some details on top of a standard Bollinger Band. You can add either a HIGHBB or LOWBB line that the Profit Trailer Trading Bot will use as a buy signal. The indicator also highlights the 'Buy Zones' from that given number.
EMASPREAD (Profit Trailer)This is a flexible Visualizer for the EMASPREAD buy strategy how the Profit Trailer Trading Bot uses it.
It has configurable EMA Values and support both positive and negative EMASPREAD values. It also visualizes the level of EMASPREAD in both direction through colorized distinction.