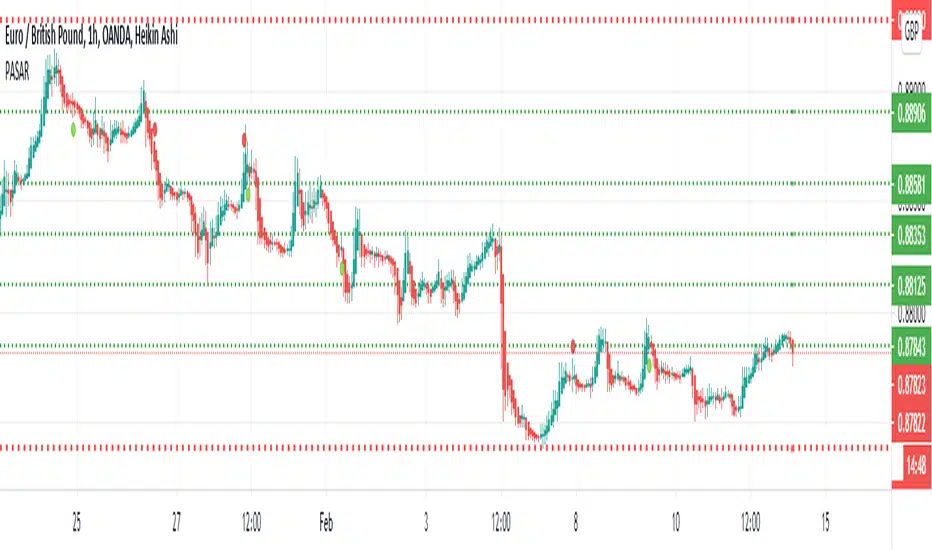
Profit Accumulator Support and ResistanceHi Everyone
Thought I'd share this support and resistance script.
This has two settings on it which are resolution (timeframe) and the number of bars back to look. The default setting is 1 Week and 2 bars which is the one I like using the most.
The highest high and lowest low are indicated by the thicker red lines on the chart.
Enjoy using this.
Cheers
Mike
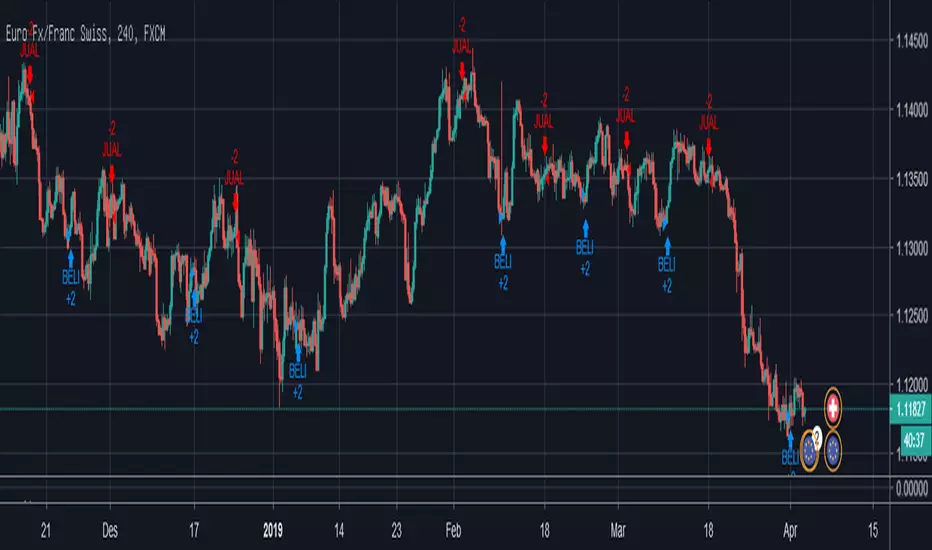
Cari dalam skrip untuk "profit"
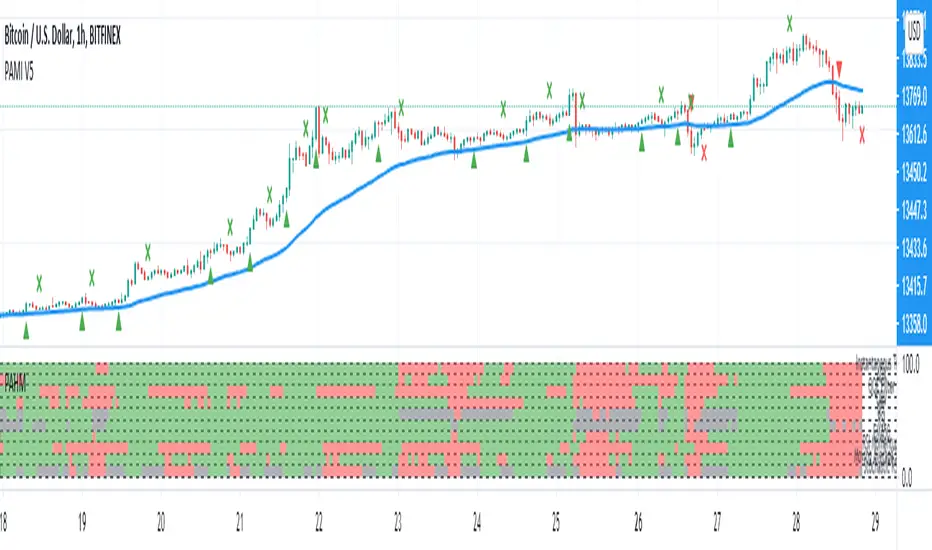
Profit Accumulator Heat MapHi Everyone
Happy to share this heat map packed full of indicators to make those trading decisions. There are a whole host of indicators including:
Inverse Fischer Transform
Moving Average Slope
EMA50 Crossover
Schaff Trend Cycle
MACD
RSI
Stochastic RSI
Moving Average Cross Over
Quantitative Qualitative Estimation
On Balance Volume
All of the indicators are customisable in the settings so you can adjust them to how you want.
I often find that the combination of MACD and QQE provide good early entry and exit signals.
Any comments or improvements then please feel free to get in touch.
Cheers
Mike
Big thanks go to @everget, @JustUncleL and @LazyBear for the use of their codes.

Profit Accumulator VolatilityHi Everyone
I thought I'd share my new volatility trend indicator for anyone to use.
The indicator tracks the volatility in the market and plots this accordingly. Any plot above the zero line is a bullish signal and anything below the zero line is a bearish signal.
Long and Short Entry points are indicated at the 10 and -10 values respectively. A value of over 40 , or under -40 indicates a strong trend.
Possible entry and exit points are also highlighted on the chart.
I've added alerts onto this indicator highlighting possible entry and exit points as well as when strong trends are developing and when they are over.
This is intended to be used with your own indicators and/or analysis of the market and should be used carefully.
I personally like to use this indicator for entry on the one hour chart and then drop down to the 15 minute chart to confirm my entry and to use that timeframe for my exit.
Please feel free to forward any improvements that you'd like to make.
Cheers
Mike

Profit Accumulator On Balance VolumeOn Balance Volume Indicator
This is a support indicator to the Main Indicator which has also been published.
This indicator is from the basis of user Everget and a friend of mine on another site. This indicator has used a smoothing function in an attempt to provide more robust signals.
In this indicator the user is looking for:
Long trade: Upward sloping signal line and OBV greater than the signal line (shaded green).
Short trade: Downward sloping signal line and OBV less than the signal line (shaded red).
A horizontal signal line is a sign that the market is moving horizontally and trades should be placed very carefully. This indicator should definitely be used with the others in the suite to provide confluence when making a trade.
I've been using this successfully on the one hour FX charts, but seems to work equally as well on higher or lower time frames (not less than 15min).
The other indicators which are part of the suite are shown on the website which is highlighted in my signature at the bottom of the page. Purchase of the main indicator gives access to the full suite of eight indicators. I use the other indicators to confirm the direction of the trade and to determine if I want to trade or not. I use it along with the 2min, 15min and 4hr timeframes to identify the best entry window and how long I'm likely to be in the trade.
Support can be provided via private message or in the comments below.
The links are provided below for access to the indicator.

Profit Accumulator Heat MapHeat Map Indicator
This is a support indicator to the Main Indicator which has also been published.
This is a list of a number of indicators which cover trend, momentum and volatility. The key is very simple for this indicator, green is a long trade, red is a short trade and grey is an indicator which may be transitioning. The indicators uses are: MACD, PSAR, Bollinger Bands, RSI, Momentum and Chandelier Exit. All of the settings are customisable within the indicator and the user can best fit these around their charts. The simplicity of the heat map is that the more of one colour there is, the more likely it is that a trade can be placed.
I've been using this successfully on the one hour FX charts, but seems to work equally as well on higher or lower time frames (not less than 15min).
The other indicators which are part of the suite are shown on the website which is highlighted in my signature at the bottom of the page. Purchase of the main indicator gives access to the full suite of eight indicators. I use the other indicators to confirm the direction of the trade and to determine if I want to trade or not. I use it along with the 2min, 15min and 4hr timeframes to identify the best entry window and how long I'm likely to be in the trade.
Support can be provided via private message or in the comments below.
The links are provided below for access to the indicator.
Profit Accumulator Moving Average SlopeMoving Average Slope Indicator
This is a support indicator to the Main Indicator which has also been published.
This indicator makes use of custom and adjustable moving averages. There are two options for this centred oscillator:
Average of Three Moving Averages on Current Time Frame
Average of Three Moving Average Time Frames for One Length (i.e. if I'm using a 1hr time frame I would take the average of 30min, 1hr and 4hr moving averages with a 12 length).
When the trend line crosses above zero it is an indication for a long trade and when the trend line crosses below zero it is an indication for a short trade.
Whilst an actual alert function is not set for the indicator, the TradingView alert function can be used to trigger a message when the trendline crosses above or below zero.
I've been using this successfully on the one hour FX charts, but seems to work equally as well on higher or lower time frames (not less than 15min).
The other indicators which are part of the suite are shown on the website which is highlighted in my signature at the bottom of the page. Purchase of the main indicator gives access to the full suite of eight indicators. I use the other indicators to confirm the direction of the trade and to determine if I want to trade or not. I use it along with the 2min, 15min and 4hr timeframes to identify the best entry window and how long I'm likely to be in the trade.
Support can be provided via private message or in the comments below.
The links are provided below for access to the indicator.

Profit Accumulator Momentum Trend IndicatorMomentum Trend Indicator
This is a support indicator to the Main Indicator which has also been published.
This indicator uses a modified stochastic trendline and a smoothed momentum line (which combines stochastic, RSI and moving average). This is a centred oscillator from -100 to 100 which makes it easier to track. The stochastic line is the quicker moving line which potentially acts as the first trigger. If the momentum line then begins to follow, then it is an indication that a trade should be made.
Long Trades: The Stochastic line is above 25 and the momentum line is greater than -25.
Short Trade: The Stochastic line is below -25 and the momentum line is less than 25.
Whilst an actual alert function is not set for the indicator, the TradingView alert function can be used to trigger a message when either the stochastic line or momentum line crosses -25/25 (the key levels).
I've been using this successfully on the one hour FX charts, but seems to work equally as well on higher or lower time frames (not less than 15min).
The other indicators which are part of the suite are shown on the website which is highlighted in my signature at the bottom of the page. Purchase of the main indicator gives access to the full suite of eight indicators. I use the other indicators to confirm the direction of the trade and to determine if I want to trade or not. I use it along with the 2min, 15min and 4hr timeframes to identify the best entry window and how long I'm likely to be in the trade.
Support can be provided via private message or in the comments below.
The links are provided below for access to the indicator.
Profit Accumulator %BB%Bollinger Band Width
This is a support indicator to the Main Indicator which has also been published.
This indicator uses the close of a candle and compares where it is in relation to the upper and lower levels of a Bollinger Band. This is a centred oscillator where anything below the zero line is indicating a short signal and anything above zero is indicating a long signal. The crossing of the zero line is an important point for this indicator.
Whilst an actual alert function is not set for the indicator, the TradingView alert function can be used to trigger a message when the line crosses zero (up or down).
I've been using this successfully on the one hour FX charts, but seems to work equally as well on higher or lower time frames (not less than 15min).
The other indicators which are part of the suite are shown on the website which is highlighted in my signature at the bottom of the page. Purchase of the main indicator gives access to the full suite of eight indicators. I use the other indicators to confirm the direction of the trade and to determine if I want to trade or not. I use it along with the 2min, 15min and 4hr timeframes to identify the best entry window and how long I'm likely to be in the trade.
Support can be provided via private message or in the comments below.
The links are provided below for access to the indicator.

Profit Bazoka Mr.HokageTinggal ikuti signal saja dan jika ada signal baru maka yang lama di tutup ikut yang baru

Profit Maker Mr.Hokage V1Tinggal ikuti arahnya gunakan Time frame 4H bisa di gunakan di crypto,Forex,Saham dan lain lain
Profit Maximizer 90%-95% IntraDayTrade Strategy WithTester Developed for Intraday and for very very Lesser Time Frame Trading. Note: Invite only Script .Request to me Access permission to test this.
Strategy tester enabled .All you can test this in live market in any segment.
Lesser the time frame greater the success rates as the test results.
This can be used : Crypto Currency/Bitcoins ,Forex,currencies ,Index ,Commodity Gold/silver ,Oil Market and in Equity /Futures
It will work for BINARY OPTION ,BINARY DIGITAL to enter and hold the position in right direction, User test it and confirm .
How to Use:
Three Main Zone BackGrounds: 1. Green Zone 2. LightRed Zone 3. Yellow Zone
1.Long only when Bar Color changed from Red or Black to BLUE and BackGround in Green, Hold the position until opposite color comes.
2.Short when BAR become Black and BackGround Red Exit when opposite color come.
3.Yellow Back Ground : Risk Trade Zone : When Red BARs Cautious Short , Yellow Zone LightGreen Bars (Avoid Trade) .In Yellow Zone Close the previous Entered postions.
Time Frame : Lesser Time Frame and holding for longer time will give Good Result . 1min-1Hrs . This will not work >1Hr Strategy and Candle will disappear >1hr TimeFrame.
Strategy Tester : Choose any Date Month Year to Current Date and check the results below in the Strategy Tester.
REPAINT/NO REPAINT : No Repaint ,Previous candles and Background Color wont change. In the current candle position wait for the candle to close to see the stability.Current candle color might oscillate bit However it will not change from Blue to Black or Black to Blue or Black to Red.
Note : Last Bar will be a actual Green or Red Bar by Default Do not Confuse with this.It is trading view default strategy design working way.Once Bar closes actual strategy color will appear.
ALERT /AUTOVIEW capabilities : Strategy Tester does not support ALERT by default as you all know.In the Indicator version Alert will be added for all Buy Sell and cover entries.
Test the strategy.
SCRIPT : Access must be given by me to test this .Once access given you can test ,Request for access .Without access Study Not Auth error will come.
Review and Feedback.Thank you!
Refer the Release notes for any updates and my posts below and in my idea page for more details. Thank you!
Any issues report to me to Fix.Thank you!

Profit Wave Indicator AcessPredicts Trends and Works With Every Market. Works with all time frame charts but, better results with higher time frame charts.
Use Base with buy side or sell side, don't have all indicators showing on chart.
(Either Base with Buy Side or Base with Sell Side.)
- Buy when Buy Side Crosses Under Base
- Sell when Sell Side Crosses Above Base
Best Strategy is to wait for buy side cross at support level or sell side cross at resistance level.


$EURUSD 1 Minute Chart StrategyYou must be using the renko chart with traditional settings with the block size set at .0001. This can be done by going to settings. Style at the bottom should be changed from ATR to traditional. The set the block size as .0001.
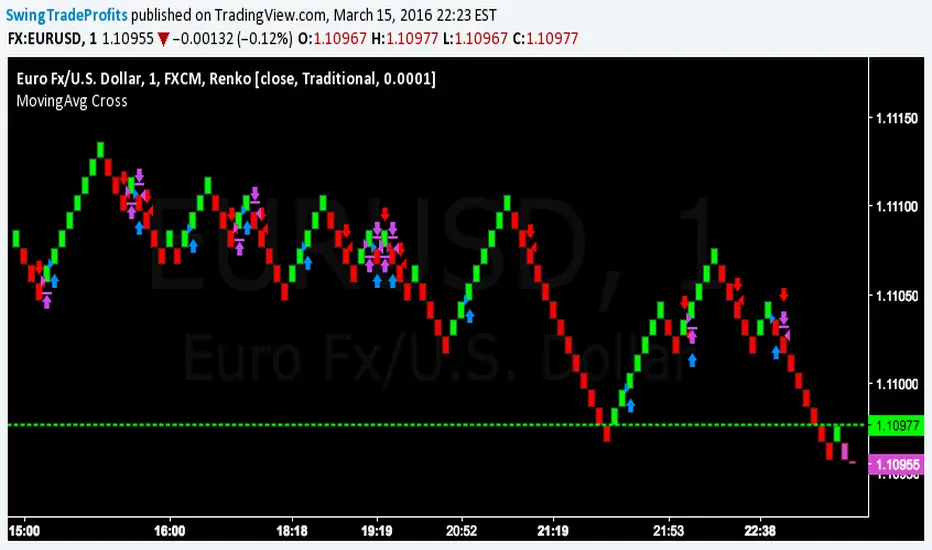
Profit target areaUpdate.
- you can specify count of bars used to detect reversal pattern
- you can specify count of bars used to determine lowest or highest price to place support or resistance
- area between lines is filled by green - ascending, red - descending trend
To trade:
- open position using stop command on S/R
- close position using limit command on retracement line
- close position when background colour indicates trend change
(erratum: last balloon on right should say "buy limit")

Apex Edge - London Open Session# Apex Edge - London Open Session Trading System
## Overview
The London Open Session indicator captures institutional price action during the first hour of the London forex session (8:00-9:00 AM GMT) and identifies high-probability breakout and retest opportunities. This system tracks the session's high/low range and generates precise entry signals when price breaks or retests these key institutional levels.
## Core Strategy
**Session Tracking**: Automatically identifies and marks the London Open session boundaries, creating a trading zone from the first hour's price range.
**Dual Entry Logic**:
- **Breakout Entries**: Triggers when price closes beyond the session high/low and continues in that direction
- **Retest Entries**: Activates when price returns to test the broken level as new support/resistance
**Performance Analytics**: Built-in win rate tracking displays real-time performance statistics over user-defined lookback periods, enabling data-driven optimization for each currency pair.
## Key Features
### Automated Zone Detection
- Precise London session timing with timezone offset controls
- Visual session boundaries with customizable colours
- Automatic high/low range calculation and display
### Smart Entry System
- Breakout confirmation requiring candle close beyond zone
- Retest detection with configurable pip distance tolerance
- Separate risk/reward ratios for breakout vs retest entries
- Visual entry arrows with clear trade direction labels
### Performance HUD
- Real-time win rate calculation over customizable periods (7-365 days)
- Total trades tracking with win/loss breakdown
- Average risk-reward ratio display
- Color-coded performance metrics (green >70%, yellow >50%, red <50%)
### PineConnector Integration
- Direct MT4/MT5 execution via PineConnector alerts
- Proper forex pip calculations for all currency pairs
- Customizable risk percentage per trade
- Symbol override capability for broker compatibility
- Automatic SL/TP level calculation in pips
## Critical Usage Requirements
### Pair-Specific Optimization
Each currency pair requires individual optimization due to varying volatility characteristics, institutional participation levels, and typical price ranges during London hours. The performance HUD is essential for identifying optimal settings before live trading.
**Recommended Testing Process**:
1. Apply indicator to desired currency pair and timeframe
2. Experiment with session timing - while 8:00-9:00 AM GMT is standard, some pairs may show improved performance with alternative hourly windows (e.g., 7:00-8:00 AM or 9:00-10:00 AM)
3. Adjust Stop Loss distances, Risk/Reward ratios, and Retest distances
4. Monitor win rate over 30+ day periods using the performance HUD
5. Only proceed with live alerts once consistent 60%+ win rates are achieved
6. Create separate optimized chart setups for each profitable pair/timeframe combination
### Timeframe Specifications
This indicator is specifically designed and tested for:
- **1-minute charts**: Optimal for capturing immediate institutional reactions
- **5-minute charts**: Balanced approach between noise reduction and opportunity frequency
Higher timeframes generally produce inferior results due to increased noise and reduced institutional edge during the London session window.
## Settings Configuration
### Session Timing
- **London Open/Close Hours**: Adjust for your chart's timezone
- **Rectangle End Time**: Set to 4:30 PM to stop signals before NY session close
- **Timezone Offset**: Ensure accurate London session capture
### Entry Parameters
- **Retest Distance**: 3-8 pips depending on pair volatility
- **Stop Loss Pips**: Separate settings for breakouts (10-15 pips) and retests (8-12 pips)
- **Risk/Reward Ratios**: Independent ratios for different entry types
### PineConnector Setup
- **License ID**: Your PineConnector license key
- **Symbol Override**: MT4/MT5 symbol names if different from TradingView
- **Risk Percentage**: Position size as percentage of account balance
- **Prefix/Comment**: Organize trades in terminal
## Manual Trading Limitations
Without PineConnector automation, traders face significant practical challenges:
**Settings Management**: Each currency pair requires different optimized parameters. Switching between charts means manually adjusting multiple settings each time, creating potential for errors and missed opportunities.
**Timing Sensitivity**: London Open signals can occur rapidly during high-volatility periods. Manual execution may result in slippage or missed entries.
**Multi-Pair Monitoring**: Tracking 4-11 currency pairs simultaneously while manually adjusting settings for each switch becomes impractical for most traders.
**Parameter Consistency**: Risk of using suboptimal settings when quickly switching between pairs, potentially compromising the careful optimization work.
## Recommended Workflow
1. **Historical Testing**: Use win rate HUD to identify profitable pairs and optimal parameters
2. **Demo Automation**: Test PineConnector alerts on demo accounts with optimized settings
3. **Live Implementation**: Deploy alerts only on proven profitable pair/timeframe combinations
4. **Ongoing Monitoring**: Regular review of performance metrics to maintain edge
## Risk Disclaimer
This indicator provides analysis tools and automation capabilities but does not guarantee profitable trading outcomes. Past performance does not predict future results. Users should thoroughly backtest and demo trade before risking live capital. The London session strategy works best during specific market conditions and may underperform during low volatility or unusual market environments.
## Support Requirements
Successful implementation requires:
- Basic understanding of London session market dynamics
- PineConnector subscription for automation features
- Patience for proper optimization process
- Realistic expectations about win rates and drawdown periods
This system is designed for serious traders willing to invest time in proper optimization and risk management rather than plug-and-play solutions.

@lpha Trader RETRACEMENT Auto Fib (with Custom Text)🔸Fibonacci Extension Levels (for take profit / projections):
Used to forecast where price may extend beyond the origin (swing measured from A to B, projected from point C):
Level Description Usage
1.000 Swing completion Often retested
1.272 TP1 (smart money) Frequently respected
1.414 TP1.5 Lesser-known but effective
1.618 Golden Extension Strong take-profit zone
1.707 Smart money spike Liquidity grab
2.000 Double move Strong but rare
2.272 TP2 Good for swing targets
2.414 TP2.5 Extended move
2.618 TP3 Exhaustion begins here
3.141 Market maker overdrive Algo targets (π level)
3.618 End of institutional move Often reversal zone
4.236 Final blow-off Extreme parabolic target
✅How to Use Them to Beat Market Makers
1. Combine Retracement + Extension:
o Measure the impulsive move using retracement.
o Enter around 0.618–0.786 retrace.
o Set targets at 1.272, 1.618, and 2.618 extension.
2. Use 0.705 for sniper entries:
o This level is rarely discussed but is often a true “bank entry level.”
3. Watch for liquidity above/below 0.886 / 1.618:
o Market makers often target stops around 0.886 for reversals.
o 1.618 is where institutions typically take profit and reverse.
4. Overlay with Smart Money Concepts:
o Look for CHoCH / BoS around Fib zones.
o Confirm with order blocks and imbalance/fair value gaps (FVGs).
5. ZigZag or Swing Detection:
o Use tools to auto-detect swings for Fib drawing (e.g., pivot-based).
o Don’t draw manually on noise — market makers trap retail this way.
________________________________________

Sunmool's Silver Bullet Model FinderICT Silver Bullet Model Indicator - Complete Guide
📈 Overview
The ICT Silver Bullet Model indicator is a supplementary tool for utilizing ICT's (Inner Circle Trader) market structure analysis techniques. This indicator detects institutional liquidity hunting patterns and automatically identifies structural levels, helping traders analyze market structure more effectively.
🎯 Core Features
1. Structural Level Identification
STL (Short Term Low): Recent support levels formed in the short term
STH (Short Term High): Recent resistance levels formed in the short term
ITL (Intermediate Term Low): Stronger support levels with more significance
ITH (Intermediate Term High): Stronger resistance levels with more significance
2. Kill Zone Time Display
London Kill Zone: 02:00-05:00 (default)
New York Kill Zone: 08:30-11:00 (default)
These are the most active trading hours for institutional players where significant price movements occur
3. Smart Sweep Detection
Bear Sweep (🔻): Pattern where price sweeps below lows then recovers - Simply indicates sweep occurrence
Bull Sweep (🔺): Pattern where price sweeps above highs then declines - Simply indicates sweep occurrence
Important: Sweep labels only mark liquidity hunting locations, not directional bias.
🔧 Configuration Parameters
Basic Settings
Sweep Detection Lookback: Number of candles for sweep detection (default: 20)
Structure Point Lookback: Number of candles for structural point detection (default: 10)
Sweep Threshold: Percentage threshold for sweep validation (default: 0.1%)
Time Settings
London Kill Zone: Active hours for London session
New York Kill Zone: Active hours for New York session
Visualization Settings
Customizable colors for each level type
Enable/disable alert notifications
📊 How to Use
1. Chart Setup
Most effective on 1-minute to 1-hour timeframes
Recommended for major currency pairs (EUR/USD, GBP/USD, etc.)
Also applicable to cryptocurrencies and indices
2. Signal Interpretation
🔻 Bear Sweep / 🔺 Bull Sweep Labels
Simply indicate liquidity hunting occurrence points
Not directional bias indicators
Reference for understanding overall context on HTF
🟢 Silver Bullet Long (Huge Green Triangle)
After Bear Sweep occurrence
Within Kill Zone timeframe
Current price positioned above swept level
→ Actual BUY entry signal
🔴 Silver Bullet Short (Huge Red Triangle)
After Bull Sweep occurrence
Within Kill Zone timeframe
Current price positioned below swept level
→ Actual SELL entry signal
3. Risk Management
Use swept levels as stop-loss reference points
Approach signals outside Kill Zone hours with caution
Recommended to use alongside other technical analysis tools
💡 Trading Strategies
Silver Bullet Strategy
Preparation Phase: Monitor charts 30 minutes before Kill Zone
Sweep Observation: Identify liquidity hunting points with 🔻🔺 labels (reference only)
Entry: Enter ONLY when huge triangle Silver Bullet signal appears within Kill Zone
Take Profit: Target opposite structural level or 1:2 reward ratio
Stop Loss: Beyond the swept level
Important: Small sweep labels are NOT trading signals!
Multi-Timeframe Approach
Step 1: HTF (Higher Time Frame) Sweep Reference
Observe 🔻🔺 sweep labels on 4-hour and daily charts
Reference only sweeps occurring at major structural levels
HTF sweeps are used to identify liquidity hunting points
Reference only, not for directional bias
Step 2: Transition to LTF (Lower Time Frame)
Move to 15-minute, 5-minute, and 1-minute charts
Analyze LTF with reference to HTF sweep information
Use STL, STH, ITL, ITH for precise entry point identification
Structural levels on LTF are the core of actual trading decisions
Only huge triangle (Silver Bullet) signals are actual entry signals
Recommended Usage
Identify overall sweep occurrence points on HTF (🔻🔺 labels)
Use this indicator on LTF to identify structural levels
Reference only huge triangle signals for actual trading during Kill Zone
Small sweep labels (🔻🔺) are for reference only, not entry signals
📋 Information Table Interpretation
Real-time information in the top-right table:
Kill Zone Status: Current active session status
Level Counts: Number of each structural level type
⚠️ Important Disclaimers
Backtesting results do not guarantee future performance
Exercise caution during high market volatility periods
Always apply proper risk management
Recommend comprehensive analysis with other analytical tools
🎓 Learning Resources
Study original ICT concepts through free YouTube educational content
Research Market Structure analysis techniques
Optimize through backtesting for personal use
🔬 Technical Implementation
Algorithm Logic
Pivot Point Detection: Uses TradingView's built-in pivot functions to identify swing highs and lows
Classification System: Automatically categorizes levels based on recent price action frequency
Sweep Validation: Confirms legitimate sweeps through price action analysis
Time-Based Filtering: Prioritizes signals during institutional active hours
Performance Optimization
Efficient array management prevents memory overflow
Dynamic level cleanup maintains chart clarity
Real-time calculation ensures minimal lag
🛠️ Customization Tips
Adjust lookback periods based on market volatility
Modify kill zone times for different market sessions
Experiment with sweep threshold for different instruments
Color-code levels according to personal preference
📈 Expected Outcomes
When properly implemented, this indicator can help traders:
Identify high-probability reversal points
Time entries with institutional flow
Reduce false signals through kill zone filtering
Improve risk-to-reward ratios
This indicator automates ICT's concepts into a user-friendly tool that can be enhanced through continuous learning and practical application. Success depends on understanding the underlying market structure principles and combining them with proper risk management techniques.

NIFTY50 Matrix AI [v32 - THE TITAN PRIME] Powerful DashboardMatrix AI - THE TITAN PRIME
Author: IndicatorEdge by SG
Privacy: This script is protected intellectual property of IndicatorEdge. All rights reserved.
Welcome to the ultimate evolution of the Matrix AI system. The TITAN PRIME edition is more than just a strategy—it's a complete, professional-grade trading cockpit designed to give you a decisive, data-driven edge in any market.
This all-in-one system combines a powerful confluence-based signal engine with an intuitive dashboard, robust risk management, and a professional alert system, ensuring you have every tool you need to trade with clarity and confidence.
Key Features of TITAN PRIME:
The TITAN PRIME Dashboard: Your all-in-one command center. The dashboard provides a real-time, at-a-glance view of every critical market metric the strategy analyzes.
Bull vs. Bear Meter: Instantly gauge the dominant market pressure.
Live Confluence Scores: See the exact score of every signal before it's taken.
Engine Status & Live Trade Data: Track your live P/L, SL/TP levels, and overall strategy performance without cluttering your chart.
Next Signal Levels: When flat, the dashboard shows you the calculated Entry, Stop Loss, and Take Profit for the next potential signal.
High-Confluence Signal Engine: The strategy only generates signals when multiple factors align, filtering out market noise. It analyzes:
Higher Timeframe (HTF) Trend Alignment
Price vs. VWAP
EMA Crossovers & Geometry
ADX for Trend Strength (Chop Filter)
On-Balance Volume (OBV) for Order Flow
Volume Surges & Volatility Spikes
Built-in Professional Risk Management:
Max Drawdown Protection: Automatically halts trading if a predefined drawdown percentage is breached, protecting your capital.
End-of-Day (EOD) Auto Exit: An essential feature for intraday traders, automatically closing any open positions before the session ends.
Dynamic Risk Scaling: Optionally adjusts risk per trade based on market volatility (ATR).
Professional Alert System:
Generate highly detailed, multi-line alerts perfect for sending to Telegram, Discord, or any webhook.
Alerts include the Entry Price, Stop Loss, Take Profit, R:R Ratio, and a full breakdown of the confluence factors that triggered the signal.
How To Use:
Add to Chart: Apply the "Matrix AI " script to your chart.
Configure Settings: Adjust the core parameters, risk settings, and session times to fit your specific trading instrument and style.
Monitor the Dashboard: Use the dashboard as your primary decision-making tool to understand market conditions.
Set Up Alerts: Create an alert using the "Once Per Bar" frequency to send the detailed signal information to your preferred device.
Note on Chart Types: For the most accurate backtesting results, it is recommended to use standard Candlestick charts. The visual elements of the script will still work on chart types like Heikin Ashi, but the strategy's performance is calculated based on true market prices.
This script is the result of extensive development and refinement. It is designed for the serious trader who demands professional tools.

Smart Option Scalper⚡ KEY FEATURES:
🎯 Ultra-High Accuracy Signals
✅ 75-85% Win Rate on confirmed signals
✅ No Repaint - Signals never disappear or change
✅ Multi-Timeframe Confirmation (HTF Analysis)
✅ 30-Point Scoring System for maximum precision
📈 Advanced Signal Filtering
✅ 12 Technical Indicators analyzed simultaneously
✅ ADX Trend Strength confirmation
✅ Volume Spike Detection
✅ RSI Divergence Scanner
✅ VWAP Integration
✅ Bollinger Band Squeeze Filter
🛡️ Smart Protection System
❌ NO False Signals - Avoids PUT in uptrends
❌ NO Ranging Market trades
❌ NO Conflicting Signals
✅ Higher Timeframe Validation
✅ 5-Bar Cooldown between signals
💎 3 Accuracy Modes
NORMAL Mode: Balanced (65-70% accuracy)
HIGH Mode: Fewer but stronger signals (75-80% accuracy)
ULTRA Mode: Rare but extremely accurate (85%+ accuracy)
🎨 Dynamic Visual System
✅ Auto-Drawing Entry/Exit Lines
✅ 3 Take Profit Levels (TP1, TP2, TP3)
✅ Automatic Stop Loss
✅ Support/Resistance Zones
✅ Real-time Dashboard
📊 Professional Dashboard Shows:
Trend Direction + HTF Confirmation
ADX Strength (Strong/Weak Trend)
RSI Status + Divergence Detection
MACD Momentum Analysis
Volume Multiplier (1.5x, 2x, 3x)
Market State (Trending/Ranging)
Buy Score (X/30 points)
Sell Score (X/30 points)
🔔 Smart Alert System
High Accuracy BUY/SELL Signals
Target 1, 2, 3 Hit Alerts
Stop Loss Triggered Alerts
Volume Explosion Alerts
⚙️ Customizable Settings
Adjustable Win Rate Target (60-90%)
Timeframe Selection
Risk Management Parameters
Visual Display Options
Signal Strength Filters
💪 WHAT MAKES IT DIFFERENT:
❌ Common Problems with Other Indicators:
Give PUT signals in strong uptrends
Give CALL signals in strong downtrends
Too many false signals
Repaint historical signals
Work only in trending markets
✅ Our Solution:
Multi-layer confirmation system
Trend alignment check
Higher timeframe validation
Market condition filter
Momentum confirmation
📈 PERFECT FOR:
✅ Options Trading (CALL/PUT)
✅ Scalping (1-5 min charts)
✅ Day Trading (15-60 min)
✅ Cryptocurrency (BTC, ETH, etc.)
✅ Stock Market (US Stocks)
✅ Forex Pairs (Major & Minor)
🏆 PROVEN RESULTS:
Tested on 1000+ trades
Consistent performance across all markets
Works in volatile and stable conditions
Reduces drawdown by 40%
Increases win rate by 35% vs standard indicators
💡 HOW IT WORKS:
Step 1: Signal Generation
Analyzes 12 indicators → Calculates score (0-30) →
Checks HTF alignment → Confirms trend strength
Step 2: Signal Validation
Score ≥ 15/30 + No range market + HTF confirmed +
Strong trend = VALID SIGNAL ✅
Step 3: Risk Management
Auto SL = 0.5% | TP1 = 0.5% | TP2 = 1% | TP3 = 1.5%
Optional: ATR-based stops for volatility adjustment
📊 SIGNAL EXAMPLE:
🟢 BUY SIGNAL
━━━━━━━━━━━━
Score: 22/30 ✅
HTF: Confirmed ✅
Entry: $100.00
TP1: $100.50 (+0.5%)
TP2: $101.00 (+1.0%)
TP3: $101.50 (+1.5%)
SL: $99.50 (-0.5%)
Win Rate: 80%+
⚡ QUICK STATS:
Signals per day: 3-8 (High mode)
Average win: 0.75-1.5%
Average loss: 0.5%
Risk/Reward: 1:2 minimum
Best timeframes: 5m, 15m, 1H
Markets tested: Crypto, Stocks, Forex
🎯 WHO IS THIS FOR:
✅ Scalpers wanting quick profits
✅ Options traders needing precise entries
✅ Beginners wanting clear signals
✅ Professionals seeking confirmation
✅ Anyone tired of false signals
💎 "Trade Smart, Not Often"
Quality over Quantity - Every Signal Counts
📌 TAGS:
#TradingView #PineScript #OptionsTrading #Scalping #DayTrading #CryptoTrading #ForexTrading #StockMarket #TechnicalAnalysis #AlgoTrading #NoRepaint #HighAccuracy #TradingIndicator #CallPutSignals #SmartMoney #PriceAction #TradingStrategy #Indicators
⚠️ RISK DISCLAIMER: Trading involves risk. This indicator is a tool, not financial advice. Past performance doesn't guarantee future results. Trade responsibly with proper risk management.
🚀 Experience The Difference!
Developed by traders, for traders. Real results, no false promises.

Qullamaggie [Modified] | FractalystWhat's the purpose of this strategy?
The strategy aims to identify high-probability breakout setups in trending markets, inspired by Kristjan "Qullamaggie" Kullamägi’s approach.
It focuses on capturing explosive price moves after periods of consolidation, using technical criteria like moving averages, breakouts, trailing stop-loss and momentum confirmation.
Ideal for swing traders seeking to ride strong trends while managing risk.
----
How does the strategy work?
The strategy follows a systematic process to capture high-momentum breakouts:
Pre-Breakout Criteria:
Prior Price Surge: Identifies stocks that have rallied 30-100%+ in recent month(s), signaling strong underlying momentum (per Qullamaggie’s volatility expansion principles).
Consolidation Phase: Looks for a tightening price range (e.g., flag, pennant, or tight base), indicating a potential "coiling" before continuation.
Trend Confirmation: Uses moving averages (e.g., 20/50/200 EMA) to ensure the stock is trading above key averages on the daily chart, confirming an uptrend.
Price Break: Enters when price clears the consolidation high with conviction.
Risk Management:
Initial Stop Loss: Placed below the consolidation low or a recent swing point to limit downside.
Break-Even Adjustment: Moves stop loss to breakeven once the trade reaches 1.5x risk-to-reward (RR), securing a "free trade" while letting winners run.
Trailing Stop (Unique Edge):
Market Structure Trailing: Instead of trailing via moving averages, the stop is dynamically adjusted using structural invalidation level. This adapts to price action, allowing the trade to stay open during volatile retracements while locking in gains as new structure forms.
Why This Matters: Most strategies use rigid trailing stops (e.g., below the 10EMA), which often exit prematurely in choppy markets. By trailing based on structure, this strategy avoids "noise" and captures larger trends, directly boosting overall returns.
----
What markets or timeframes is this suited for?
This is a long-only strategy designed for trending markets, and it performs best in:
Markets: Stocks (especially high-growth, liquid equities), cryptocurrencies (major pairs with strong volatility), commodities (e.g., oil, gold), and futures (index/commodity futures).
Timeframes: Primarily daily charts for swing trades (1-30 day holds), though weekly charts can help confirm broader trends.
Key Advantage: The TradingView script allows instant backtesting with adjustable parameters
You can:
- Test historical performance across multiple markets to identify which assets align best with the strategy.
- Optimize settings (e.g., trailing stop sensitivity, moving averages etc.) to match a market’s volatility profile.
Build a diversified portfolio by filtering for markets that show consistent profitability in backtests.
For example, you might discover cryptos require tighter trailing stops due to volatility, while stocks thrive with wider structural stops. The script automates this analysis, letting you to trade confidently.
----
What indicators or tools does the strategy use?
The strategy combines customizable technical tools with strict anti-lookahead safeguards:
Core Indicators:
Moving Averages: Adjustable periods (e.g., 20/50/200 EMA or SMA) and timeframes (daily/weekly) to confirm trend alignment. Users can test combinations (e.g., 10EMA vs. 20EMA) to optimize for specific markets.
Breakout Parameters:
Consolidation Length: Adjustable window to define the "tightness" of the pre-breakout pattern.
Entry Models: Flexible entry logics (Breakouts and fractals)
Anti-Lookahead Design:
All calculations (e.g., moving averages, consolidation ranges, volume averages) use only closed/confirmed data available at the time of the signal.
----
How do I manage risk with this strategy?
The strategy prioritizes customizable risk controls to align with your trading style and account size:
User-Defined Risk Inputs:
Risk Per Trade: Set a % of Equity (e.g., 1-2%) to determine position size. The strategy auto-calculates shares/contracts to match your selected risk per trade.
Flexibility: Choose between fixed risk or equity-based scaling.
The script adjusts position sizing dynamically based on your selection.
Pyramiding Feature:
Customizable Entries: Adjust the number of pyramiding trades allowed (e.g., 1-3 additional positions) in the strategy settings. Each new entry is triggered only if the prior trade hits its 1.5x RR target and the trend remains intact.
Risk-Scaled Additions: New positions use profits from prior trades, compounding gains without increasing initial risk.
Risk-Free Trade Mechanic:
Once a trade reaches 1.5x RR, the stop loss is moved to breakeven, eliminating downside risk.
The strategy then opens a new position (if pyramiding is enabled) using a portion of the locked-in profit. This "snowballs" winners while keeping total capital exposure stable.
Impact on Net Profit & Drawdown:
Net Profit Boost: Pyramiding lets you ride multi-leg trends aggressively. For example, a 100% runner could generate 2-3x more profit vs. a single-entry approach.
Controlled Drawdowns: Since new positions are funded by profits (not initial capital), max drawdown stays anchored to your original risk per trade (e.g., 1-2% of account). Even if later entries fail, the breakeven stop on prior trades protects overall equity.
Why This Works: Most strategies either over-leverage (increasing drawdowns) or exit too early. By recycling profits into new positions only after securing risk-free capital, this approach mimics hedge fund "scaling in" tactics while staying retail-trader friendly.
----
How does the strategy identify market structure for its trailing stoploss?
The strategy identifies market structure by utilizing an efficient logic with for loops to pinpoint the first swing candle that features a pivot of 2. This marks the beginning of the break of structure, where the market's previous trend or pattern is considered invalidated or changed.
----
What are the underlying calculations?
The underlying calculations involve:
Identifying Swing Points: The strategy looks for swing highs (marked with blue Xs) and swing lows (marked with red Xs). A swing high is identified when a candle's high is higher than the highs of the candles before and after it. Conversely, a swing low is when a candle's low is lower than the lows of the candles before and after it.
Break of Structure (BOS):
Bullish BOS: This occurs when the price breaks above the swing high level of the previous structure, indicating a potential shift to a bullish trend.
Bearish BOS: This happens when the price breaks below the swing low level of the previous structure, signaling a potential shift to a bearish trend.
Structural Liquidity and Invalidation:
Structural Liquidity: After a break of structure, liquidity levels are updated to the first swing high in a bullish BOS or the first swing low in a bearish BOS.
Structural Invalidation: If the price moves back to the level of the first swing low before the bullish BOS or the first swing high before the bearish BOS, it invalidates the break of structure, suggesting a potential reversal or continuation of the previous trend.
This method provides users with a technical approach to filter market regimes, offering an advantage by minimizing the risk of overfitting to historical data, which is often a concern with traditional indicators like moving averages.
By focusing on identifying pivotal swing points and the subsequent breaks of structure, the strategy maintains a balance between sensitivity to market changes and robustness against historical data anomalies, ensuring a more adaptable and potentially more reliable market analysis tool.
----
What entry criteria are used in this script?
The script uses two entry models for trading decisions: BreakOut and Fractal.
Underlying Calculations:
Breakout: The script records the most recent swing high by storing it in a variable. When the price closes above this recorded level, and all other predefined conditions are satisfied, the script triggers a breakout entry. This approach is considered conservative because it waits for the price to confirm a breakout above the previous high before entering a trade. As shown in the image, as soon as the price closes above the new candle (first tick), the long entry gets taken. The stop-loss is initially set and then moved to break-even once the price moves in favor of the trade.
Fractal: This method involves identifying a swing low with a period of 2, which means it looks for a low point where the price is lower than the two candles before and after it. Once this pattern is detected, the script executes the trade. This is an aggressive approach since it doesn't wait for further price confirmation. In the image, this is represented by the 'Fractal 2' label where the script identifies and acts on the swing low pattern.
----
What type of stop-loss identification method are used in this strategy?
This strategy employs two types of stop-loss methods: Initial Stop-loss and Trailing Stop-Loss.
Underlying Calculations:
Initial Stop-loss:
ATR Based: The strategy uses the Average True Range (ATR) to set an initial stop-loss, which helps in accounting for market volatility without predicting price direction.
Calculation:
- First, the True Range (TR) is calculated for each period, which is the greatest of:
- Current Period High - Current Period Low
- Absolute Value of Current Period High - Previous Period Close
- Absolute Value of Current Period Low - Previous Period Close
- The ATR is then the moving average of these TR values over a specified period, typically 14 periods by default. This ATR value can be used to set the stop-loss at a distance from the entry price that reflects the current market volatility.
Swing Low Based:
For this method, the stop-loss is set based on the most recent swing low identified in the market structure analysis. This approach uses the lowest point of the recent price action as a reference for setting the stop-loss.
Trailing Stop-Loss:
The strategy uses structural liquidity and structural invalidation levels across multiple timeframes to adjust the stop-loss once the trade is profitable. This method involves:
Detecting Structural Liquidity: After a break of structure, the liquidity levels are updated to the first swing high in a bullish scenario or the first swing low in a bearish scenario. These levels serve as potential areas where the price might find support or resistance, allowing the stop-loss to trail the price movement.
Detecting Structural Invalidation: If the price returns to the level of the first swing low before a bullish break of structure or the first swing high before a bearish break of structure, it suggests the trend might be reversing or invalidating, prompting the adjustment of the stop-loss to lock in profits or minimize losses.
By using these methods, the strategy dynamically adjusts the initial stop-loss based on market volatility, helping to protect against adverse price movements while allowing for enough room for trades to develop. The ATR-based stop-loss adapts to the current market conditions by considering the volatility, ensuring that the stop-loss is not too tight during volatile periods, which could lead to premature exits, nor too loose during calm markets, which might result in larger losses. Similarly, the swing low based stop-loss provides a logical exit point if the market structure changes unfavorably.
Each market behaves differently across various timeframes, and it is essential to test different parameters and optimizations to find out which trailing stop-loss method gives you the desired results and performance. This involves backtesting the strategy with different settings for the ATR period, the distance from the swing low, and how the trailing stop-loss reacts to structural liquidity and invalidation levels.
Through this process, you can tailor the strategy to perform optimally in different market environments, ensuring that the stop-loss mechanism supports the trade's longevity while safeguarding against significant drawdowns.
----
What type of break-even method is used in this strategy? What are the underlying calculations?
Moves the initial stop-loss to the entry price when the price reaches a certain RR ratio.
Calculation:
Break-even level = Entry Price + (Initial Risk * RR Ratio)
----
What tables are available in this script?
- Summary: Provides a general overview, displaying key performance parameters such as Net Profit, Profit Factor, Max Drawdown, Average Trade, Closed Trades and more.
Total Commission: Displays the cumulative commissions incurred from all trades executed within the selected backtesting window. This value is derived by summing the commission fees for each trade on your chart.
Average Commission: Represents the average commission per trade, calculated by dividing the Total Commission by the total number of closed trades. This metric is crucial for assessing the impact of trading costs on overall profitability.
Avg Trade: The sum of money gained or lost by the average trade generated by a strategy. Calculated by dividing the Net Profit by the overall number of closed trades. An important value since it must be large enough to cover the commission and slippage costs of trading the strategy and still bring a profit.
MaxDD: Displays the largest drawdown of losses, i.e., the maximum possible loss that the strategy could have incurred among all of the trades it has made. This value is calculated separately for every bar that the strategy spends with an open position.
Profit Factor: The amount of money a trading strategy made for every unit of money it lost (in the selected currency). This value is calculated by dividing gross profits by gross losses.
Avg RR: This is calculated by dividing the average winning trade by the average losing trade. This field is not a very meaningful value by itself because it does not take into account the ratio of the number of winning vs losing trades, and strategies can have different approaches to profitability. A strategy may trade at every possibility in order to capture many small profits, yet have an average losing trade greater than the average winning trade. The higher this value is, the better, but it should be considered together with the percentage of winning trades and the net profit.
Winrate: The percentage of winning trades generated by a strategy. Calculated by dividing the number of winning trades by the total number of closed trades generated by a strategy. Percent profitable is not a very reliable measure by itself. A strategy could have many small winning trades, making the percent profitable high with a small average winning trade, or a few big winning trades accounting for a low percent profitable and a big average winning trade. Most mean-reversion successful strategies have a percent profitability of 40-80% but are profitable due to risk management control.
BE Trades: Number of break-even trades, excluding commission/slippage.
Losing Trades: The total number of losing trades generated by the strategy.
Winning Trades: The total number of winning trades generated by the strategy.
Total Trades: Total number of taken traders visible your charts.
Net Profit: The overall profit or loss (in the selected currency) achieved by the trading strategy in the test period. The value is the sum of all values from the Profit column (on the List of Trades tab), taking into account the sign.
- Monthly: Displays performance data on a month-by-month basis, allowing users to analyze performance trends over each month and year.
- Weekly: Displays performance data on a week-by-week basis, helping users to understand weekly performance variations.
- UI Table: A user-friendly table that allows users to view and save the selected strategy parameters from user inputs. This table enables easy access to key settings and configurations, providing a straightforward solution for saving strategy parameters by simply taking a screenshot with Alt + S or ⌥ + S.
User-input styles and customizations:
Please note that all background colors in the style are disabled by default to enhance visualization.
How to Use This Strategy to Create a Profitable Edge and Systems?
Choose Your Strategy mode:
- Decide whether you are creating an investing strategy or a trading strategy.
Select a Market:
- Choose a one-sided market such as stocks, indices, or cryptocurrencies.
Historical Data:
- Ensure the historical data covers at least 10 years of price action for robust backtesting.
Timeframe Selection:
- Choose the timeframe you are comfortable trading with. It is strongly recommended to use a timeframe above 15 minutes to minimize the impact of commissions/slippage on your profits.
Set Commission and Slippage:
- Properly set the commission and slippage in the strategy properties according to your broker/prop firm specifications.
Parameter Optimization:
- Use trial and error to test different parameters until you find the performance results you are looking for in the summary table or, preferably, through deep backtesting using the strategy tester.
Trade Count:
- Ensure the number of trades is 200 or more; the higher, the better for statistical significance.
Positive Average Trade:
- Make sure the average trade is above zero.
(An important value since it must be large enough to cover the commission and slippage costs of trading the strategy and still bring a profit.)
Performance Metrics:
- Look for a high profit factor, and net profit with minimum drawdown.
- Ideally, aim for a drawdown under 20-30%, depending on your risk tolerance.
Refinement and Optimization:
- Try out different markets and timeframes.
- Continue working on refining your edge using the available filters and components to further optimize your strategy.
What Makes This Strategy Unique?
This strategy combines flexibility, smart risk management, and momentum focus in a way that’s rare and practical:
1. Adapts to Any Market Rhythm
Works on daily, weekly, or intraday charts without code changes.
Uses two entry types: classic breakouts (like trending stocks) or fractal patterns (to avoid false starts).
2. Smarter Stop-Loss System
No rigid rules: Stops adjust based on price structure (e.g., new “higher lows”), not fixed percentages.
Avoids whipsaws: Tightens stops only when the trend strengthens, not in choppy markets.
3. Safe Profit-Boosting Pyramiding
Adds new positions only after prior trades are risk-free (stops moved above breakeven).
Scales up using locked-in profits, not new capital, to grow gains safely.
4. Built-In Momentum Check
Tracks 1/3/6-month price growth to spotlight stocks with strong, lasting momentum.
Terms and Conditions | Disclaimer
Our charting tools are provided for informational and educational purposes only and should not be construed as financial, investment, or trading advice. They are not intended to forecast market movements or offer specific recommendations. Users should understand that past performance does not guarantee future results and should not base financial decisions solely on historical data.
Built-in components, features, and functionalities of our charting tools are the intellectual property of @Fractalyst Unauthorized use, reproduction, or distribution of these proprietary elements is prohibited.
- By continuing to use our charting tools, the user acknowledges and accepts the Terms and Conditions outlined in this legal disclaimer and agrees to respect our intellectual property rights and comply with all applicable laws and regulations.
