[MT] Strategy Backtest Template| Initial Release | | EN |
An update of my old script, this script is designed so that it can be used as a template for all those traders who want to save time when programming their strategy and backtesting it, having functions already programmed that in normal development would take you more time to program, with this template you can simply add your favorite indicator and thus be able to take advantage of all the functions that this template has.
🔴Stop Loss and 🟢Take Profit:
No need to mention that it is a Stop Loss and a Take Profit, within these functions we find the options of: fixed percentage (%), fixed price ($), ATR, especially for Stop Loss we find the Pivot Points, in addition to this, the price range between the entry and the Stop Loss can be converted into a trailing stop loss, instead, especially for the Take Profit we have an option to choose a 1:X ratio that complements very well with the Pivot Points.
📈Heikin Ashi Based Entries:
Heikin Ashi entries are trades that are calculated based on Heikin Ashi candles but their price is executed to Japanese candles, thus avoiding false results that occur in Heikin candlestick charts, this making in certain cases better results in strategies that are executed with this option compared to Japanese candlesticks.
📊Dashboard:
A more visual and organized way to see the results and necessary data produced by our strategy, among them we can see the dates between which our operations are made regardless if you have activated some time filter, usual data such as Profit, Win Rate, Profit factor are also displayed in this panel, additionally data such as the total number of operations, how many were gains and how many losses, the average profit and loss for each operation and finally the maximum profits and losses followed, which are data that will be very useful to us when we elaborate our strategies.
Feel free to use this template to program your own strategies, if you find errors or want to request a new feature let me know in the comments or through my social networks found in my tradingview profile.
| Update 1.1 | | EN |
➕Additions: '
Time sessions filter and days of the week filter added to the time filter section.
Option to add leverage to the strategy.
5 Moving Averages, RSI, Stochastic RSI, ADX, and Parabolic Sar have been added as indicators for the strategy.
You can choose from the 6 available indicators the way to trade, entry alert or entry filter.
Added the option of ATR for Take Profit.
Ticker information and timeframe are now displayed on the dashboard.
Added display customization and color customization of indicator plots.
Added customization of display and color plots of trades displayed on chart.
📝Changes:
Now when activating the time filter it is optional to add a start or end date and time, being able to only add a start date or only an end date.
Operation plots have been changed from plot() to line creation with line.new().
Indicator plots can now be controlled from the "plots" section.
Acceptable and deniable range of profit, winrate and profit factor can now be chosen from the "plots" section to be displayed on the dashboard.
Aesthetic changes in the section separations within the settings section and within the code itself.
The function that made the indicators give inputs based on heikin ashi candles has been changed, see the code for more information.
⚙️Fixes:
Dashboard label now projects correctly on all timeframes including custom timeframes.
Removed unnecessary lines and variables to take up less code space.
All code in general has been optimized to avoid the use of variables, unnecessary lines and avoid unnecessary calculations, freeing up space to declare more variables and be able to use fewer lines of code.
| Lanzamiento Inicial | | ES |
Una actualización de mi antiguo script, este script está diseñado para que pueda ser usado como una plantilla para todos aquellos traders que quieran ahorrar tiempo al programar su estrategia y hacer un backtesting de ella, teniendo funciones ya programadas que en el desarrollo normal te tomaría más tiempo programar, con esta plantilla puedes simplemente agregar tu indicador favorito y así poder aprovechar todas las funciones que tiene esta plantilla.
🔴Stop Loss y 🟢Take Profit:
No hace falta mencionar que es un Stop Loss y un Take Profit, dentro de estas funciones encontramos las opciones de: porcentaje fijo (%), precio fijo ($), ATR, en especial para Stop Loss encontramos los Pivot Points, adicionalmente a esto, el rango de precio entre la entrada y el Stop Loss se puede convertir en un trailing stop loss, en cambio, especialmente para el Take Profit tenemos una opción para elegir un ratio 1:X que se complementa muy bien con los Pivot Points.
📈Entradas Basadas en Heikin Ashi:
Las entradas Heikin Ashi son operaciones que son calculados en base a las velas Heikin Ashi pero su precio esta ejecutado a velas japonesas, evitando así́ los falsos resultados que se producen en graficas de velas Heikin, esto haciendo que en ciertos casos se obtengan mejores resultados en las estrategias que son ejecutadas con esta opción en comparación con las velas japonesas.
📊Panel de Control:
Una manera más visual y organizada de ver los resultados y datos necesarios producidos por nuestra estrategia, entre ellos podemos ver las fechas entre las que se hacen nuestras operaciones independientemente si se tiene activado algún filtro de tiempo, datos usuales como el Profit, Win Rate, Profit factor también son mostrados en este panel, adicionalmente se agregaron datos como el número total de operaciones, cuantos fueron ganancias y cuantos perdidas, el promedio de ganancias y pérdidas por cada operación y por ultimo las máximas ganancias y pérdidas seguidas, que son datos que nos serán muy útiles al elaborar nuestras estrategias.
Siéntete libre de usar esta plantilla para programar tus propias estrategias, si encuentras errores o quieres solicitar una nueva función házmelo saber en los comentarios o a través de mis redes sociales que se encuentran en mi perfil de tradingview.
| Actualización 1.1 | | ES |
➕Añadidos:
Filtro de sesiones de tiempo y filtro de días de la semana agregados al apartado de filtro de tiempo.
Opción para agregar apalancamiento a la estrategia.
5 Moving Averages, RSI, Stochastic RSI, ADX, y Parabolic Sar se han agregado como indicadores para la estrategia.
Puedes escoger entre los 6 indicadores disponibles la forma de operar, alerta de entrada o filtro de entrada.
Añadido la opción de ATR para Take Profit.
La información del ticker y la temporalidad ahora se muestran en el dashboard.
Añadido personalización de visualización y color de los plots de indicadores.
Añadido personalización de visualización y color de los plots de operaciones mostradas en grafica.
📝Cambios:
Ahora al activar el filtro de tiempo es opcional añadir una fecha y hora de inicio o fin, pudiendo únicamente agregar una fecha de inicio o solamente una fecha de fin.
Los plots de operaciones han cambiados de plot() a creación de líneas con line.new().
Los plots de indicadores ahora se pueden controlar desde el apartado "plots".
Ahora se puede elegir el rango aceptable y negable de profit, winrate y profit factor desde el apartado "plots" para mostrarse en el dashboard.
Cambios estéticos en las separaciones de secciones dentro del apartado de configuraciones y dentro del propio código.
Se ha cambiado la función que hacía que los indicadores dieran entradas en base a velas heikin ashi, mire el código para más información.
⚙️Arreglos:
El dashboard label ahora se proyecta correctamente en todas las temporalidades incluyendo las temporalidades personalizadas.
Se han eliminado líneas y variables innecesarias para ocupar menos espacio en el código.
Se ha optimizado todo el código en general para evitar el uso de variables, líneas innecesarias y evitar los cálculos innecesarios, liberando espacio para declarar más variables y poder utilizar menos líneas de código.
Cari dalam skrip untuk "profit"

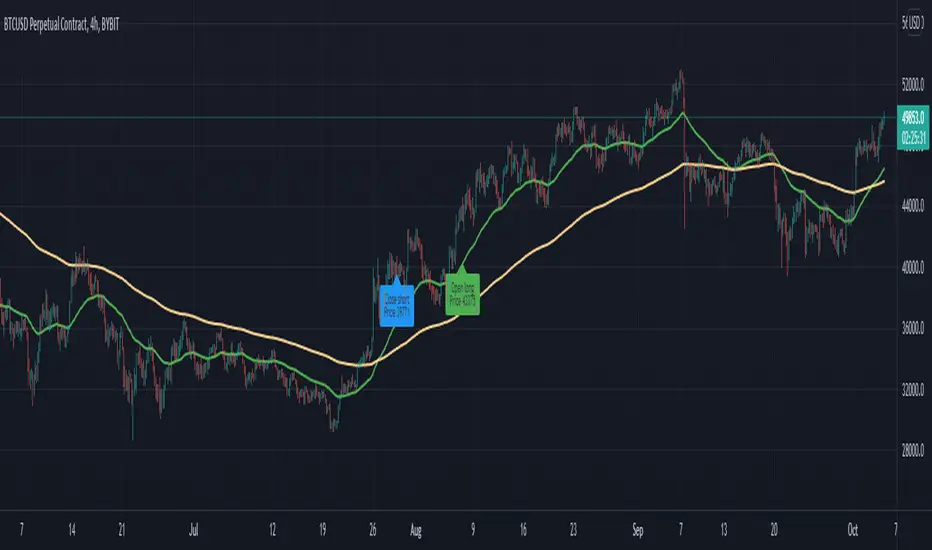
Moon Phases Strategy [LuxAlgo]Trading moon phases has become quite popular among traders, believing that there exists a relationship between moon phases and market movements. This strategy is based on an estimate of moon phases with the possibility to use different methods to determine long/short positions based on moon phases.
Note that we assume moon phases are perfectly periodic with a cycle of 29.530588853 days (which is not realistically the case), as such there exists a difference between the detected moon phases by the strategy and the ones you would see. This difference becomes less important when using higher timeframes.
Settings
New Moon Reference Date: Date of a new moon to be used as starting point for the cycle calculation. Buy: Determine the condition to be used to open a long position Sell: Determine the condition to be used to open a short position
Description
The strategy can use different buy/sell conditions, these are determined in the Buy/Sell settings drop-down menu.
By default, the strategy goes long on a new moon and short on a full moon. This setup is common since full moons are said to be related to depressed mood. However, it is possible to use inverse conditions.
Users can also go long on higher moons (new moons or full moons occurring at a price that is higher than the previous one when a new/full moon occurred) and short on lower moons, this would return a trend following strategy, using the inverse conditions (buy lower moons/sell higher moons) would return a contrarian strategy.
The above chart displays the strategy using default conditions.
The above chart displays the strategy of going long on a higher moon and selling on a lower moon.
Quick Summary
We provide a quick summary of the strategy using default conditions (buy on a new moon, sell on a full moon) on various tickers using the 4h timeframe (note that using a lower timeframe would return a backtest executing a lower number of trades).
Constant position sizing is used and no frictional costs are considered.
BTCUSD
The moon phases strategy has been regularly tested with BTCUSD, with traders highlighting how moon phases tend to occur during tops/bottoms. We test the strategy from 2019-01-06 00:00.
Net Profit: $68544.86 Closed Trades : 67 % Profitability : 50.75 Max Drawdown : $18541.24 Max
TSLA
The strategy is tested from 2011-01-04 14:30
Net profit: $349.17 Closed Trades : 265 % Profitability : 54.34 Max Drawdown : $262.72
EURUSD
The strategy is tested from 2018-01-16 14:00.
Net profit: $-0.18 Closed Trades : 91 % Profitability : 50.55 Max Drawdown : 0.36

EMASAR Investor ModePLEASE READ THE FULL DESCRIPTION BEFORE BUYING OR USING THIS INDICATOR
THIS IS THE INVESTOR MODE ONLY VERSION OF THE EMASAR INDICATOR. IT INCLUDES THE ORIGINAL SIGNALS TELLING YOU WHEN TO BUY OR SELL. IT ONLY INCLUDES THE OCEAN TO INDICATE PULLBACKS AND NOT OTHER TRADING REGIONS ARE INCLUDED. IT SHOWS THE BUY/SELL SIGNALS AS WAS PUBLISHED IN THE ORIGINAL VERSION OF EMASAR
EMASAR (pronounced Emma-sar) is a strategy based on Exponential Moving Averages and the Parabolic SAR. This is a position trading approach that is derived from Tyler Jenks’ Consensio.
This strategy was developed with four objectives in mind: (1) managing risk (2) protecting from missing out on major moves (3) maximizing risk:reward (4) staying in a trending market and taking profit before it fully reverses.
EMASAR does a great job at accomplishing all of the above through the buy and sell signals that are generated. The data provided below is from the signals that occurred on Bitcoin ( Bitstamp ) from January 1, 2015 to present (November 11, 2019).
(1) Risk is tightly managed, relative to the winners, and losing positions will be exited before the market moves too far against.
The biggest losing trade on Bitcoin , for the time period outlined above, is -18.47%.
(2) Following the EMASAR buy and sell signals guarantees that one will not miss out on a major trend. As a result of the indicators used for this system it is mathematically impossible for a major trend to occur without providing a buy or sell signal. This system isn't meant to catch exact tops or bottoms but it will do a great job of capturing ~85% of a trend.
(3) On average the winning trades will be 5.55 times the losing trades. There will be stretches where the losers are bigger than the winners and this could last for many months, maybe even a year. However, over the long run the average reward is expected to be 5.55 times the average risk*.
*Past performance does not guarantee future results!
(4) This indicator was designed to capitalize on parabolic markets, specifically Bitcoin and alt coins. Crypto markets have a tendency to get moving so fast that many indicators become all but useless.
Entries can get signaled too late and exits will get signaled way too early. This is specifically true when using oscillators that are designed to identify overbought or oversold environments. EMASAR does a great job of keeping us in a position for the duration of a trend and this includes the major parabolic runs that Bitcoin has a tendency to go on.
When Bitcoin , or other alts, really get moving it can be very difficult to distinguish between a correction and a full reversal. We do not want to be exiting during a minor correction, instead this is a time when we want to be holding on or looking to buy the dip.
This is a very fragile balance. The market has a very strong tendency to make corrections looks like reversals and to make reversals look like corrections. Therefore it is very important to have a tool(s) that you trust to distinguish in between the two.
I believe that EMASAR is the best way to find that balance - if I knew of a better way then I would be using it instead!
Following these signals will help us to hold onto positions while the market is still trending in our favor when most think that it has moved too far / too fast, and it will also get us out before a market fully reverses.
Keep in mind that there will be times when we exit a market that is in danger of reversing, only to buy back higher later on. That is okay because it enables us to properly manage risk during times of uncertainty and buying back in at a higher price is more than worth the opportunity cost.
Risks
The biggest risks with trading EMASAR revolve around disobeying the signals. Risk management is built into this system with the exit signals that will occur, however it is up to the individual to execute those signals. Passing on an exit signal could lead to a big loss which would have a dramatic impact on the ROI . Most trading systems will have small and medium losses with small, medium and large wins. That is exactly how this works. The small - medium losses and wins will mostly be a wash and will account for roughly 80% of the trades. The large wins will happen about 20% of the time and will make up 80% - 90% of the profits.
Therefore the two biggest risks are passing on signals entirely, or exiting preemptively. Getting chopped in and out of a market can be quite frustrating. If you become overwhelmed with negative emotions then it could cause you to pass up on the next signal. That signal will often be the one that more than makes up for the small - medium losses that preceded.
On average EMASAR will provide one signal every 6 weeks when using the default settings on the 4h chart. Therefore missing one entry could turn an otherwise profitable year into a loser. If electing to trade a system, whether it is EMASAR or another, it is crucial to commit to taking every signal regardless of outside variables (namely your personal bias about market direction or frustration that follows a losing stretch).
Another major risk with this system is taking too much profit too soon. When getting into a trade that has the potential to be a big winner it can be challenging to continue holding through the swings. Anyone that has watched paper profits vanish will be inclined to start exiting after the market makes a big move in his or her favor. While this is better than watching profits completely evaporate, this mistake can be enough to turn a profitable system into one that loses to the market. If 80% - 90% of our profits come from 10% - 20% of our trades then it is vital we do not cut those positions off at the knees.
If taking too much profit too soon then you will consistently turn potential large winners into medium winners. This may lead to making money over the long run which will make it very difficult to realize that anything is wrong. However making money and beating the market are two very different things. Exiting early and making money is nearly as big of a risk as missing entries entirely.
If you have the discipline to execute signals in a timely manner after they are triggered and the emotional control to let the winners run despite the appearance of a vastly overbought / oversold market, then you should have what it takes to beat the market with EMASAR.
If you are not an experienced trader then it is very important to start out small. The only way to learn is to trade in a live environment and the only way to succeed is to risk much less than you can afford to lose. If you have $2,000 to trade with then start with a maximum position size of $20 - $50 and don’t be shy about scaling that down even further. Focus on ROI instead of actual dollars made. If you can return 100% on a $20 roll then you should be able to do the same with a $2,000 roll.
Important Notes
Make sure that you read / understand the risks outlined above. If you jump into this without understanding the unique risks that this system entails then you are going to have a bad time.
This indicator was developed around the 4h and that is where it works best. For crypto adjusting to higher TF’s will cause for bad results as the entries / exits will be late to the party. For traditional markets the Daily - Weekly time frames are preferred. It was not originally intended for smaller TF's but we have seen some good results on the 15m and 1h. The RSI can be a great compliment when using on smaller TF's. Adding a rule for not entering when RSI > 75 or < 25 and instead entering when RSI retests 50 will help to avoid some bad signals.
Alerts can be set for this indicator. Simply make sure that it is visible on the chart, then click the alert icon on the top panel. In the first dropdown set 'Condition' to 'EMASAR' and the second 'Condition' for the upcoming signal. For example if just entered long then set the second condition to 'Close Long' and you will be notified as soon as that signal occurs. If waiting for the next long entry then set the second condition to 'Open Long' so on and so forth . There is an 'All in One' alert that is also available. If you select that then you will be alerted any time that a signal occurs. The message will tell you to check the chart to see which signal caused the alert.
Portfolio Backtester Engine█ OVERVIEW
Portfolio Backtester Engine (PBTE). This tool will allow you to backtest strategies across multiple securities at once. Allowing you to easier understand if your strategy is robust. If you are familiar with the PineCoders backtesting engine , then you will find this indicator pleasant to work with as it is an adaptation based on that work. Much of the functionality has been kept the same, or enhanced, with some minor adjustments I made on the account of creating a more subjectively intuitive tool.
█ HISTORY
The original purpose of the backtesting engine (`BTE`) was to bridge the gap between strategies and studies . Previously, strategies did not contain the ability to send alerts, but were necessary for backtesting. Studies on the other hand were necessary for sending alerts, but could not provide backtesting results . Often, traders would have to manage two separate Pine scripts to take advantage of each feature, this was less than ideal.
The `BTE` published by PineCoders offered a solution to this issue by generating backtesting results under the context of a study(). This allowed traders to backtest their strategy and simultaneously generate alerts for automated trading, thus eliminating the need for a separate strategy() script (though, even converting the engine to a strategy was made simple by the PineCoders!).
Fast forward a couple years and PineScript evolved beyond these issues and alerts were introduced into strategies. The BTE was not quite as necessary anymore, but is still extremely useful as it contains extra features and data not found under the strategy() context. Below is an excerpt of features contained by the BTE:
"""
More than `40` built-in strategies,
Customizable components,
Coupling with your own external indicator,
Simple conversion from Study to Strategy modes,
Post-Exit analysis to search for alternate trade outcomes,
Use of the Data Window to show detailed bar by bar trade information and global statistics, including some not provided by TV backtesting,
Plotting of reminders and generation of alerts on in-trade events.
"""
Before I go any further, I want to be clear that the BTE is STILL a good tool and it is STILL very useful. The Portfolio Backtesting Engine I am introducing is only a tangental advancement and not to be confused as a replacement, this tool would not have been possible without the `BTE`.
█ THE PROBLEM
Most strategies built in Pine are limited by one thing. Data. Backtesting should be a rigorous process and researchers should examine the performance of their strategy across all market regimes; that includes, bullish and bearish markets, ranging markets, low volatility and high volatility. Depending on your TV subscription The Pine Engine is limited to 5k-20k historical bars available for backtesting, which can often leave the strategy results wanting. As a general rule of thumb, strategies should be tested across a quantity of historical bars which will allow for at least 100 trades. In many cases, the lack of historical bars available for backtesting and frequency of the strategy signals produces less than 100 trades, rendering your strategy results inconclusive.
█ THE SOLUTION
In order to be confident that we have a robust strategy we must test it across all market regimes and we must have over 100 trades. To do this effectively, researchers can use the Portfolio Backtesting Engine (PBTE).
By testing a strategy across a carefully selected portfolio of securities, researchers can now gather 5k-20k historical bars per security! Currently, the PTBE allows up to 5 securities, which amounts to 25k-100k historical bars.
█ HOW TO USE
1 — Add the indicator to your chart.
• Confirm inputs. These will be the most important initial values which you can change later by clicking the gear icon ⚙ and opening up the settings of the indicator.
2 — Select a portfolio.
• You will want to spend some time carefully selecting a portfolio of securities.
• Each security should be uncorrelated.
• The entire portfolio should contain a mix of different market regimes.
You should understand that strategies generally take advantage of one particular type of market regime. (trending, ranging, low/high volatility)
For example, the default RSI strategy is typically advantageous during ranging markets, whereas a typical moving average crossover strategy is advantageous in trending markets.
If you were to use the standard RSI strategy during a trending market, you might be selling when you should be buying.
Similarily, if you use an SMA crossover during a ranging market, you will find that the MA's may produce many false signals.
Even if you build a strategy that is designed to be used only in a trending market, it is still best to select a portfolio of all market regimes
as you will be able to test how your strategy will perform when the market does something unexpected.
3 — Test a built-in strategy or add your own.
• Navigate to gear icon ⚙ (settings) of strategy.
• Choose your options.
• Select a Main Entry Strat and Alternate Entry Strat .
• If you want to add your own strategy, you will need to modify the source code and follow the built-in example.
• You will only need to generate (buy 1 / sell -1/ neutral 0) signals.
• Select a Filter , by default these are all off.
• Select an Entry Stop - This will be your stop loss placed at the trade entry.
• Select Pyamiding - This will allow you to stack positions. By default this is off.
• Select Hard Exits - You can also think of these as Take Profits.
• Let the strategy run and take note of the display tables results.
• Portfolio - Shows each security.
• The strategy runs on each asset in your portfolio.
• The initial capital is equally distributed across each security.
So if you have 5 securities and a starting capital of 100,000$ then each security will run the strategy starting with 20,000$
The total row will aggregate the results on a bar by bar basis showing the total results of your initial capital.
• Net Profit (NP) - Shows profitability.
• Number of Trades (#T) - Shows # of trades taken during backtesting period.
• Typically will want to see this number greater than 100 on the "Total" row.
• Average Trade Length (ATL) - Shows average # of days in a trade.
• Maximum Drawdown (MD ) - Max peak-to-valley equity drawdown during backtesting period.
• This number defines the minimum amount of capital required to trade the system.
• Typically, this shouldn’t be lower than 34% and we will want to allow for at least 50% beyond this number.
• Maximum Loss (ML) - Shows largest loss experienced on a per-trade basis.
• Normally, don’t want to exceed more than 1-2 % of equity.
• Maximum Drawdown Duration (MDD) - The longest duration of a drawdown in equity prior to a new equity peak.
• This number is important to help us psychologically understand how long we can expect to wait for a new peak in account equity.
• Maximum Consecutive Losses (MCL) - The max consecutive losses endured throughout the backtesting period.
• Another important metric for trader psychology, this will help you understand how many losses you should be prepared to handle.
• Profit to Maximum Drawdown (P:MD) - A ratio for the average profit to the maximum drawdown.
• The higher the ratio is, the better. Large profits and small losses contribute to a good PMD.
• This metric allows us to examine the profit with respect to risk.
• Profit Loss Ratio (P:L) - Average profit over the average loss.
• Typically this number should be higher in trend following systems.
• Mean reversion systems show lower values, but compensate with a better win %.
• Percent Winners (% W) - The percentage of winning trades.
• Trend systems will usually have lower win percentages, since statistically the market is only trending roughly 30% of the time.
• Mean reversion systems typically should have a high % W.
• Time Percentage (Time %) - The amount of time that the system has an open position.
• The more time you are in the market, the more you are exposed to market risk, not to mention you could be using that money for something else right?
• Return on Investment (ROI) - Your Net Profit over your initial investment, represented as a percentage.
• You want this number to be positive and high.
• Open Profit (OP) - If the strategy has any open positions, the floating value will be represented here.
• Trading Days (TD) - An important metric showing how many days the strategy was active.
• This is good to know and will be valuable in understanding how long you will need to run this strategy in order to achieve results.
█ FEATURES
These are additional features that extend the original `BTE` features.
- Portfolio backtesting.
- Color coded performance results.
- Circuit Breakers that will stop trading.
- Position reversals on exit. (Simulating the function of always in the market. Similar to strategy.entry functionality)
- Whipsaw Filter
- Moving Average Filter
- Minimum Change Filter
- % Gain Equity Exit
- Popular strategies, (MACD, MA cross, supertrend)
Below are features that were excluded from the original `BTE`
- 2 stage in-trade stops with kick-in rules (This was a subjective decision to remove. I found it to be complex and thwarted my use of the `BTE` for some time.)
- Simple conversion from Study to Strategy modes. (Not possible with multiple securities)
- Coupling with your own external indicator (Not really practical to use with multiple securities, but could be used if signals were generated based on some indicator which was not based on the current chart)
- Use of the Data Window to show detailed bar by bar trade information and global statistics.
- Post Exit Analysis.
- Plotting of reminders and generation of alerts on in-trade events.
- Alerts (These may be added in the future by request when I find the time.)
█ THANKS
The whole PineCoders team for all their shared knowledge and original publication of the BTE and Richard Weismann for his ideas on building robust strategies.
═════════════════════════════════════════════════════════════════════════

POW EdgeHello fellow Trading View member,
Eventually our rebranded update with some extra features for our exclusive 'Edge' Strategy Script.
In this description I will run through;
The strategy itself, what is it?
What does it do?
How does it work?
How can it help you?
How good is it?
What is it.....
The Edge Strategy itself is based upon 5 indicators lining up in total confluence to enter a position in line with a trending move. Adding them together adds more confluence and probability to each individual trade outcome over the longer term. The individual strategies used are based on Trend strategies all used in combination.
The uniqueness to this is how they are combined. Indicators can work to a point individually of course, but combining them together and only trading when all are in a line was our concept, whilst reviewing how each individual indicator can be optimised to work with the others.
Also the motivation was to be the right side of the market in a trending move and capitalising on as much as that move as possible.
The first part is to ensure the candle close is above or below our moving average, we can then check the state and validity of each of the other 4 indicators. Once this confluence is in alignment a trade is valid for entry - this has to be valid at the same time - but not all valid on the same candle - they will come into alignment in different stages. But once they are, our trade is valid.
I will not reveal the other individual 3 indicators but the other is also an ADX function to add a threshold into the strategy to identify a trend - usually above 20/25. This has upsides and downsides as any user can visualise and see in the testing.
We also add to the script to look for a Buy then Sell, Sell then Buy - we found this had more profitable results overall and next phase was to review the money management; where and how we placed our SL and when and why we exited the trade.
Example - for a BUY trade to be valid, all 5 indictors must meet their own criteria before a BUY is printed on the chart. Absolutely no technical analysis is needed to trade this strategy and the data we have is based on using the strategy in isolation - how you wish to use this either independently or supporting your own trading is of course, up to you.
The SL and TP's are based on ATR Multipliers thus ensuring we are factoring in market volatility at that time. We also have a FT (Follow Trend) option, which is a worthy addition for capitalising on big trending moves.
This strategy will work on all markets and timeframes.
We understand and accept that all pairs and markets are different thus we have optimised certain pairs and timeframes with different parameters to provide increased returns, these are hard coded (H1 Timeframe) and also provided for your review.
Profitability is easily viewable in the ‘Strategy Tester’ - this is a great tool. This is where you can see historic / live data for the strategy.
Data like;
The Net Profit
Number of trades
Win Percentage
Every trade taken
Average Win
Average Loss
Maximal DD , etc.
We have individually optimised each pair to ensure this is the case and hard coded these parameters into the strategy. All you need to do is flick between the pairs - the strategy will then identify the pair you are on and change the parameters to suit in the background.
Whilst a trade is open, the strategy will convert all candles to the relevant colour - Green for an uptrend and Red for a downtrend (all customisable).
We find this is helpful for traders psychology - not getting 'spooked' by other candle colours, affecting your decision making.
When a new signal is valid, 'POW BUY' or 'POW SELL' will be displayed on the first candle open for entry. As well as this, you will also have the trade label print which will display the following;
- EP – Entry price
- SL – Stop loss
- TP – Take Profit
- Lot size
The trade information printed will also tell you the pip values of your stop loss and take profit based on how far away they are from the trade entry price.
The lot size printed is customisable and unique to your account- within the strategy settings you can simply input your account balance, currency and risk approach which includes a fixed risk amount, fixed lot size or a fixed percentage.
This removes the need for 3rd party apps or websites to quickly calculate your specific risk on your trade. Thus saving you time and making sure you aren't 'guessing' with your lot size.
No one likes losing more than they thought.
The progress and initial challenges....
To start, our first version simply showed the buy and sell arrows when a trade was valid. However, this caused subjectivity with where we would place our stop loss and how we would manage the exit of the trade once we were in it. So, we identified a solid strategy for this was incorporating the Average True Range (ATR) for SL and TP options.
I was especially keen to add the SL and exit management so I could obtain solid back testing data to support my thoughts that 'this works'. Every trader requires confidence and belief in their strategy, without it you simply won't succeed or be disciplined in your execution.
The other challenge we all face is calculating the lot sizes of our trades right? So, it was important that we incorporated a lot size calculator - its all about making it easy when a trade is valid to enter without trying to calculate this accurately.
Lastly, when pairs are stuck in a range - this can be a testing period of 'chop' for a trend strategy, so we also incorporated the ADX function to enable us to set a threshold level to identify when the instrument is more likely to be trending.
What does it do?
Ultimately, tells you when to buy and sell - where to place your SL and when to exit. Whilst also ensuring your risk management is on point, by displaying your trading lot size. Also providing you with live back tested data at your finger tips thank you to the strategy tester.
How does it work?
This will be visible on your trading view charts once you get access. And will work across all your devices, the trading view website or the app on your phone for example.
You can also use Trading View alerts, so you won't miss a trade and can go about your day as normal without watching the screen. This will work on the Free version of TV, however, in order to benefit from more alerts and templates it makes sense to upgrade to a higher package.
How can it help you?
This will help give you a mechanical approach to your trading. This means, less decision making on your part, with the instant benefit of seeing the data you have at your fingertips thanks to the 'Strategy Tester' TV Function.
It will save you time, you don't need to be in front of your screen or completing any subjective analysis.
Integrated lot size calculator can ensure you are always accurate with your risk - either in percentage or a fixed amount of risk - whichever you prefer.
Understand Probability - this is the key one for me. Losing runs happen in any trading strategy. The great benefit here, is you can see them. How long were the losing runs? How can I prepare and plan my risk management around them are all fundamental keys to managing your emotions and being detached from your trades. No one wants to feel stressed or anxious when trading.
Customisable exit strategies - A specific TP for a 1:1 RR or 1:10 RR for example can be adjusted and you can see instantly how this affects the profitability.
The exit strategy options are shown below;
TP 1/2/3
FT - Follow Trend (no stop loss and follow's from Buys to Sells, Sell to Buy, etc.
SL + FT - SL present, but trade is held until a reverse signal is presented.
How good is it?
We have some really positive back testing data across a range of pairs and markets - equities and indices too.
Drop me a DM to see these and I'll be happy to share.
Below let me show you a screen shot of how this can work for you.
How do you access this?
Please visit our website for signup / purchase information in the first instance (the link is on our trading view signature) or send us a private message on here - its impossible to keep track of comments on our posts so to ensure we don't miss you, a private DM will be great please.
The Back test shown on this example is based on the Trading View mid price and also a realistic starting Capital of £10,000. This test result is also based on a 0.1% risk per trade, with a 5 tick spread and a commission of
Regards
Darren
Disclaimer alert.
Please remember past performance is exactly that - how our strategy performed over those dates tested, it is not obviously a guarantee of future performance. Most of our H1 data is valid from Jan 2017 to now - so 4+ years and data on 650+ trades per pair.

STRATEGY TESTER ENGINE - ON CHART DISPLAY - PLUG & PLAYSo i had this idea while ago when @alexgrover published a script and dropped a nugget in between which replicates the result of strategy tester on chart as an indicator.
So it seemed fair to use one of his strategy to display the results.
This strategy tester can now be used in replay mode like an indicator and you can see what happen at a particular section of the chart which was is not possible in default strategy tester results of TV.
Please read how each result is calculated so you will know what you are using.
This engine shows most common results of strategy tester in a single screen, which are as follows:
1. Starting Capital
2. Current Profit Percentage
3. Max Profit Percentage
4. Gross Profit
5. Gross Loss
6. Total Closed Trades
7. Total Trades Won
8. Total Trades Lost
9. Percentage Profitable
10. Profit Factor
11. Current Drawdown
12. Max Drawdown
13. Liquidation
So elaborating on what is what:
1. Starting Capital - This stays 0, which signifies your starting balance as 0%. It is set to 0 so we can compare all other results without any change in variables. If set to 100, then all the results will be increased by 100. Some users might find it useful to set it to 100, then they can change code on line 41 from to and it should show starting balance as 100%.
2. Current Profit Percentage - This shows your current profit adjusted to current price of the candle, not like TV which shows after candle is close. There is a comment on the line 38 which can be removed and your can see unrealized profit as well in this section. Please note that this will affect Draw-down calculations later in this section.
3. Max Profit Percentage - This will show you your max profit achieved during your strategy run, which was not possible yet to see via strategy tester. So, now you can see how much profit was achieved by your strategy during the run and you can compare it with chart to see what happens during bull-run or bear-run, so you can further optimize your strategy to best suit your desired results.
4. Gross Profit - This is total percentage of profit your strategy achieved during entire run as if you never had any losses.
5. Gross Loss - This is total percentage of loss your strategy achieved during entire run as if you never had any profits.
6. Total Closed Trades - This is total number of trades that your strategy has executed so far.
7. Total Trades Won - This is the total number of trades that your strategy has executed that resulted in positive increase in equity.
8. Totals Trades Lost - This is the total number of trades that your strategy has executed that resulted in decrease in equity.
9. Percentage Profitable - This is the ratio between your current total winning trades divided by total closed trades, and finally multiplied by 100 to get percentage results.
10. Profit Factor - This is the ratio between Gross Profit and Gross Loss, so if profit factor is 2, then it indicates that you are set to gain 2 times per your risk per trade on average when total trades are executed.
11. Current Drawdown - This is important section and i want you to read this carefully. Here draw-down is calculated very differently than what TV shows. TV has access to candle data and calculates draw-down accordingly as per number of trades closed, but here DD is calculated as difference between max profit achieved and current profit. This way you can see how much percentage you are down from max peak of equity at current point in time. You can do back-test of the data and see when peak was achieved and how much your strategy did a draw-down candle by candle.
12. Max Drawdown - This is also calculated differently same as above, current draw-down. Here you can see how much max DD your strategy did from a peak profit of equity. This is not set as max profit percentage is set because you will see single number on display, while idea is to keep it custom. I will explain.
So lets say, your max DD on TV is 30%. Here this is of no use to see Max DD , as some people might want to see what was there max DD 1000 candles back or 10 candle back. So this will show you your max DD from the data you select. TV shows 25000 candle data in a chart if you go back, you can set the counter to 24999 and it will show you max DD as shown on TV, but if you want custom section to show max DD , it is now possible which was not possible before.
Also, now let's say you put DD as 24999 and open a chart of an asset that was listed 1 week ago, now on 1H chart max DD will never show up until you reach 24999 candle in data history, but with this you can now enter a manual number and see the data.
13. Liquidation - This is an interesting feature, so now when your equity balance is less than 0 and your draw-down goes to -100, it will show you where and at what point in time you got liquidated by adding a red background color in the entire section. This is the most fun part of this script, while you can only see max DD on TV.
------------------------------------------------------------------------------
How to Use -
1 word, plug and play. Yes. Actual codes start from line 33.
select overlay=false or remove it from the title in your strategy on first line,
Just copy the codes from line 33 to 103,
then go to end section of your strategy and paste the entire code from line 33 to line 103,
see if you have any duplicate variable, edit it,
Add to chart.
What you see above is very contracted view. Here is how it looks when zoomed in.
imgur.com
----------------------------------------------------------------------------------
Feel free to edit and share and use. If you use it in your scripts, drop me tag. Cheers.

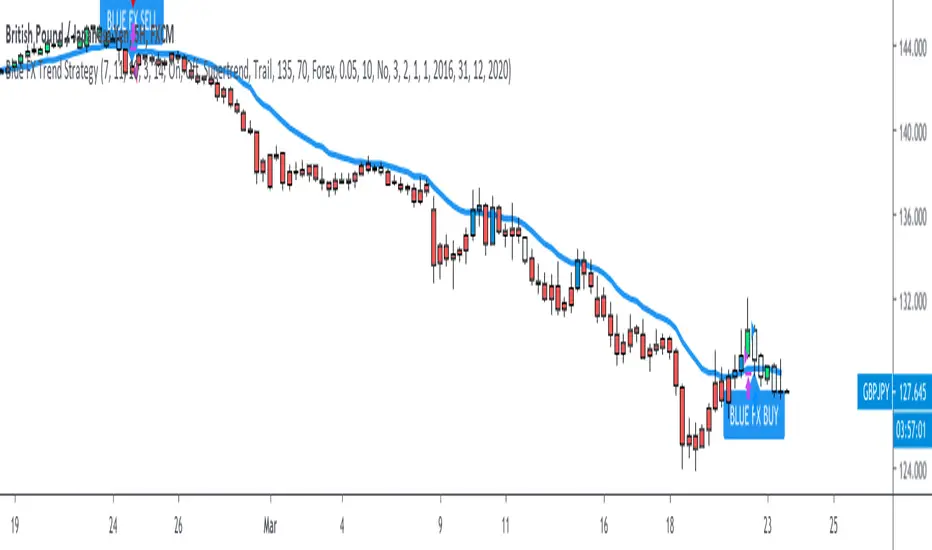
BlueFX Strategy GOLD M15We are releasing this separate script file for trading Gold on the M15 time frame using our strategy. This can now run independently from the main file instead of changing parameters and saving as a template - thus making the use of these specific settings even easier for our traders.
You can see the back testing profitability shown below, although you can not use back testing to predict the future, both the volume of trades, net profit, win rate and draw down demonstrate a solid foundation and data to move forward from.
The strategy itself is explained in the 'Blue FX Strategy' but see below too for more info.
Our strategy will help you identify the current trend in the markets and highlight when this is changing. The strategy itself is based upon 4 indicators lining up in total confluence to increase the probability of the trade being a success.
Absolutely no technical analysis is needed to trade this - this is a trading tool and has solid back testing results trading in isolation - although you may also use to support your own trading - the choice is yours.
When a trade is valid - a Buy or Sell label will appear with the Entry price, SL and multiple TP's shown on the chart.
IMPORTANT note, the test results show and confirm that the most profitable exit strategy with these Gold settings is 'FT&SL' this means we enter the trade with a Stop Loss (SL) and simply hold and follow the trend (Follow Trend = FT) until a reverse signal is printed.
In our supporting video (see related ideas) you can see the impact of changing this target between multiple TP's and the net effect on both win rate and overall net profitability.
The Lot size will also be displayed and this is based on the risk parameters you have set personally in the calculation section.
What is a Trading View Script?
A script is like an indicator but better, we can verify the success of our strategy by using Trading Views strategy tester function. As shown below and on the chart - you can see the 'Buy' and 'Close Buy' on the chart, supported by a live trading log showing you the entry, entry price date, volume and closing price.
This is a great function for numerous reasons; firstly, you know you are using a strategy that has provided a positive expectancy in back testing, secondly you can use this as a trading journal to support your trading too. This in itself can help you with your trading psychology - letting winning trades run is a prime example of this. Take confidence in the statistics and performance over time.
Ultimately, we believe we have saved YOU the need to firstly, find an edge and a strategy - and all of the time it takes to BACKTEST a strategy - to then find it may or may not work - and then you start again!
Disclaimer alert; Please remember past performance is exactly that - how our strategy performed over those dates tested, it is not obviously a guarantee of future performance.
Interested in access or more information?
No problem, simply drop us a DM via trading view for access information.
Thank you for reading.
Darren

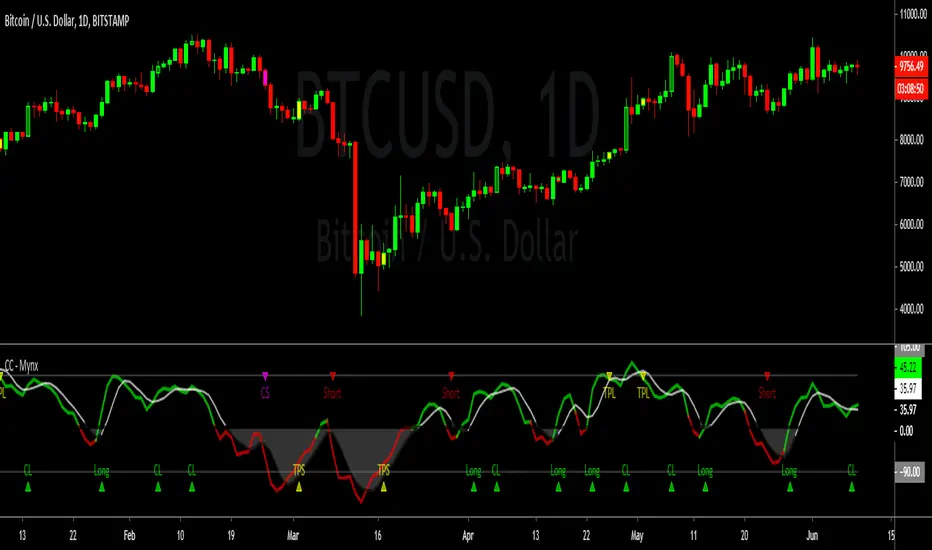
Cracking Cryptocurrency - MynxCracking Cryptocurrency - Mynx
Mynx is a powerful trend-following indicator which logic built in to facilitate nuanced aspects of PTP strategy. Continuation Trades, Early Exit Signals and Full Take Profit Signals are all built into Mynx. Mynx is designed to identify when the market is signaling that a trend is beginning as well as signalling when you may safely re-enter into a pre-existing trend. It also tells you where to exit prematurely to avoid significant capital loss on a losing trade, and when to take full profit in order to get out of a position at maximum profitability.
Should you have difficulty adding it you can search for 'Cracking' in the indicator window of your Trading View Platform, and it will appear along with the rest of our indicators.
As you will notice, Mynx is similar in nature to Time Transformation, in that it is both a Centered Oscillator and a Line Cross Indicator. This allows a wide range of possibilities which we will exploit to extract profit out of the market.
The most important line is the BPM or Mynx Line. This is going to be the thicker, brighter colored line on our indicator that will switch from green to red depending on the dominant trend. The color changing feature of this line will denote where our indicator is in relation to our zero line. If our BPM Line is green, then price is trading above our zero line, if red than it is trading below. Therefore we can quickly see what our last signal was, and whether our indicator is bullish or bearish depending upon the color of our BPM Line. If Green, we are in long territory, if red we are looking for shorts.
Our second area of importance in this indicator is our Noise Line and Area. This is the black or white line which will change color depending on where Noise is relative to our zero line. Black if above the zero line, meaning we are in long territory, and white if below, indicating we are in shorting territory. The area between the zero line and the Noise Line is shaded black or white as well, and denotes no-trade zones for us. If our BPM Line is within our Noise Area, we are not in a trade. We are only in a trade when our BPM Line is breaking away from Noise Line, either to the upside or the downside. When BPM curls back and re-enters our Noise Area, that is an indication to exit our position regardless of our Take Profits or Stop Losses.
Our Zero Line is indicated by a thick black line for easy of identification, which will be our primary signal generator when our BPM Line crosses above or below it, and our faint gray lines are going to be our Overbought and Oversold levels respectively. These will play a function in how we take profits.
Settings
Let's take a look at the settings of our Mynx Indicator.
The first field we will see is our BPM Source, how many beats per minute we want in our cycle length. The default is ten, and through back-testing I find this to be the optimum level.
Our Noise Filtration level corresponds to our Noise Line and Area. Again, I find the default settings as I have programmed them work best on all time frames, however you might find optimum signals by playing around with these settings. As in all things, nuance and experimentation is what excellence is borne of.
We can adjust our Oversold and Overbought Parameters, making it easier or harder for us to get a Full Take Profit Signal from this indicator. We can also adjust our Base Line. Keep in mind, our Base Line is going to be an Exponential Moving Average and here we can adjust the length of our desired Base Line.
To incorporate our Multi-Time Frame feature, below this section we can see that the default option will be to use a Base Line of the current time frame. If however, we want to trade on a Lower Time Frame and reference a base line of another time frame, we can simply un-check that box and input the desired Time Frame of the Base Line we wish to reference.
Now for the true appeal of Mynx in user friendliness, below this we can see that we have full control of the signals we want Mynx to generate for us. By default, we have enabled Mynx's best signals, Trending Signals. We can choose to plot Continuation Crosses and Reversals Within the Trend, both of which are trades we are allowed to take and I recommend taking in a proper PTP system. We can choose to use Mynx as a reversal indicator, to plot Raw Reversals against the trend, which I do not recommend enabling unless you want to by pass PTP entirely. We can choose to plot when Mynx gives us a Full Take Profit signal, a signal to take full profits on our position. We also have the option to plot for early exits. The Option for Sensitive Stop Loss is the same as early exits, and will plot an exit signal every time the BPM Line drifts back into the Noise Area. These are fairly easy to see upon bar closes, so I left it disabled by default. If you enable it you will get a visual signal to exit your position upon a bar close.
One final note, we can adjust the source upon which Mynx is basing her signals. By default, this value is hl2 , which I found in back-testing to be the most efficient with minimum draw down. However, there is a higher profit potential with HLC3 and OHLC4, but be warned that with that extra profit potential comes the risk of more draw down. The draw down settles out in the end, however there will be months where you drastically under perform Alpha, where as hl2 keeps you consistently outperforming the market at all times. This is a very personal choice, and I leave it upon you to make the right one.
In our Style Tab, we can adjust our Color Scheme to better accommodate the way that you trade. I have done my best to be very concise and detailed in labeling to make this task easy.
Strategy
Please let me know of your success stories with Mynx, as well as any features you think would be helpful to add. If you notice any errors within it, please notify me so I can fix them. I have back-tested this strategy many times in many different settings, and it consistently outperforms the market and generates Alpha. I now place it within your hands to achieve the same results. Trade Safely.
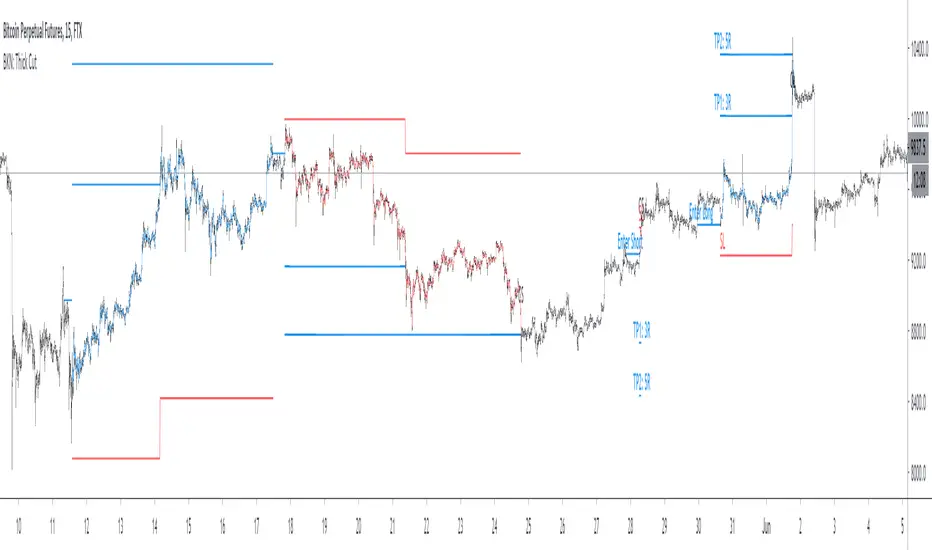
BKN: Thick CutThick Cut is the juiciest BKN yet. This indicator is created to take a profitable trading strategy and turn it into an automated system. We've built in several pieces that professional traders use every day and turned it into an algo that produces on timeframes as low as 1, 3, and 5 minutes!
Limit Order Entries: When criteria is met, an alert is signaled that will send a value to enter a position at a limit price.
Built in Stop Loss: A stop is built in and the value can be sent to your bot using the {{plot}} function or you can rely on a TradingView alert when the stop is hit.
Built in Take Profits: We've built in two separate take profits and the ability to move your stop loss to breakeven after the first take profit is hit. Even if you take 50% profit at 1R and move your stop loss, you already have a profitable trade. Test results show 50% profits at 2R and the remainder at higher returns result in exceptional results.
Position Sizing: We've built in a position size based on your own predetermined risk. Want to risk $100 per trade? Great, put in 100 in the inputs and reference a quantity of {{plot("Position Size")}} in your alert to send a position size to the bot. You can also reference {{plot("Partial Close")}} to pull 50% of the position size closing 50% at TP1 and 50% at TP2.
Backtest results shown are very short term since we are viewing a 15m chart. This can be a profitable strategy on many timeframes, but lower timeframes will maximize results.
A unique script with incredible results. Further forward testing is live.
***IMPORTANT***
For access, please do not comment below. Comments here will not be replied to. Please send a DM here or on my linked Twitter . At this time, this strategy is considered a Beta release as we continue to fine tune settings and more. Expecting 2 weeks of beta with official release around June 6.
BKN: Thick Cut StrategyThick Cut is the juiciest BKN yet. This indicator is created to take a profitable trading strategy and turn it into an automated system. We've built in several pieces that professional traders use every day and turned it into an algo that produces on timeframes as low as 1, 3, and 5 minutes!
Limit Order Entries: When criteria is met, an alert is signaled that will send a value to enter a position at a limit price.
Built in Stop Loss: A stop is built in and the value can be sent to your bot using the {{plot}} function or you can rely on a TradingView alert when the stop is hit.
Built in Take Profits: We've built in two separate take profits and the ability to move your stop loss to breakeven after the first take profit is hit. Even if you take 50% profit at 1R and move your stop loss, you already have a profitable trade. Test results show 50% profits at 2R and the remainder at higher returns result in exceptional results.
Position Sizing: We've built in a position size based on your own predetermined risk. Want to risk $100 per trade? Great, put in 100 in the inputs and reference a quantity of {{plot("Position Size")}} in your alert to send a position size to the bot. You can also reference {{plot("Partial Close")}} to pull 50% of the position size closing 50% at TP1 and 50% at TP2.
Backtest results shown are very short term since we are viewing a 15m chart. This can be a profitable strategy on many timeframes, but lower timeframes will maximize results.
A unique script with incredible results. Further forward testing is live.
***IMPORTANT***
For access, please do not comment below. Comments here will not be replied to. Please send a DM here or on my linked Twitter. At this time, this strategy is considered a Beta release as we continue to fine tune settings and more. Expecting 2 weeks of beta with official release around June 6.

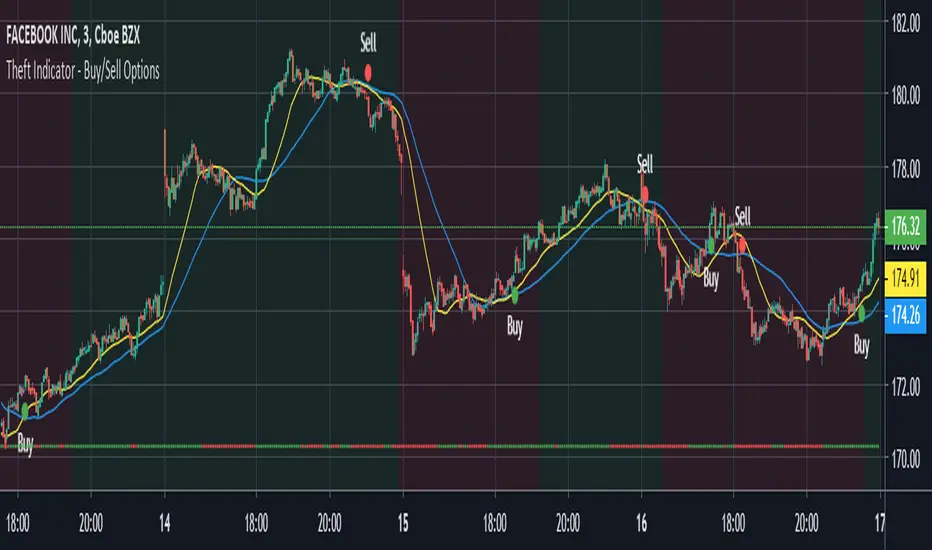
Theft Indicator - Buy/Sell Options Trading 1-3Mins ScalpingWhat is our indicator?
Theft Indicator - Buy/Sell Options Trading Signals is our third published script that shows price action on a certain period of time (We Use ATR indicator). We take pride in enabling trading to become easier for the experienced and the non-experienced traders around the globe. Buy & Sell alerts will be fired once a condition in our algo is met.
Does it Repaint?
Our indicator does NOT re-paint. Although while setting an alert it may pop up the repaint alert, please take into consideration that once a signal is fired on a "CLOSED BAR", our signal will never disappear, they do not repaint.
What Markets is it usable with?
You can use it in any market, Forex, Stocks, Crypto, Indices. All time frames are profitable, not all trades. But the Majority is profitable if you use a stop loss and target price. Although this one is for STOCK OPTIONS, it can work for other markets as well, but it will best perform with STOCKS & OPTIONS TRADING
How to use:
Simple plug and play it to your chart, in addition to a few other indicators we will recommend to you (we still have not published them yet), and this will confirm your trades. You can also connect TV alerts with a bot and let it run. Please be aware that SLIPPAGE time is important, If you run a bot on this indicator you HAVE to know that the buy/sell price will be on the bar AFTER the Candle close (For example: the BUY/SELL alert is on a candle, the buy/sell your bot or you will execute WILL be on the following candle depending on your trading system) THIS IS WITH EVERY SCRIPT, NOT MINE ONLY. We advise you to not leave the bot to trade on its own, you have to monitor and have a specific syntax that we will help you with creating according to your trading style.
How are the Buy/Sell Alerts fired?
We use the simple ATR (Average True Range) indicator. However we have modified the indicator to serve our trading system. Check below for a definition of what ATR is:
What is Average True Range - ATR?
The average true range (ATR) is a technical analysis indicator that measures market volatility by decomposing the entire range of an asset price for that period. Specifically, ATR is a measure of volatility introduced by market technician J. Welles Wilder Jr. The true range indicator is taken as the greatest of the following: current high less the current low; the absolute value of the current high less the previous close; and the absolute value of the current low less the previous close. The average true range is then a moving average, generally using 14 days, of the true ranges.
Why is our indicator special and different from the normal ATR indicators?
We have modified the uniqueness of ATR and changed it slightly to give more accurate signals, we do not promise all trades are profitable, the use of this indicator is up to your own judgement and liability. We believe that we have an indicator like no other ATR.
P.S: This is not financial advice, we are just sharing our indicator that we know has good results, and it will take time for people in -ve profiles to recover losses and for the profiting to be more profitable. We use a specific trading method that only works with it
You can contact me for more information about the indicator, Goodluck :)
Theft Indicator - 5Min Scalping SystemWhat is our indicator?
Theft Indicator - Buy & Sell Alert System is our first published script that shows price action on a certain period of time (We Use ATR indicator). We take pride in enabling trading to become easier for the experienced and the non-experienced traders around the globe. Buy & Sell alerts will be fired once a condition in our algo is met.
Does it Repaint?
Our indicator does NOT re-paint. Although while setting an alert it may pop up the repaint alert, please take into consideration that once a signal is fired on a "CLOSED BAR", our signal will never disappear, they do not repaint.
What Markets is it usable with?
You can use it in any market, Forex, Stocks, Crypto, Indices. All time frames are profitable, not all trades. But the Majority is profitable if you use a stop loss and target price.
How to use:
Simple plug and play it to your chart, in addition to a few other indicators we will recommend to you (we still have not published them yet), and this will confirm your trades. You can also connect TV alerts with a bot and let it run. Please be aware that SLIPPAGE time is important, If you run a bot on this indicator you HAVE to know that the buy/sell price will be on the bar AFTER the Candle close (For example: the BUY/SELL alert is on a candle, the buy/sell your bot or you will execute WILL be in the following candle depending on your trading system. We advise you to not leave the bot to trade on its own, you have to monitor and have a specific syntax that we will help you with creating according to your trading style.
How are the Buy/Sell Alerts fired?
We use the simple ATR (Average True Range) indicator. However we have modified the indicator to serve our trading system. Check below for a definition of what ATR is:
What is Average True Range - ATR?
The average true range (ATR) is a technical analysis indicator that measures market volatility by decomposing the entire range of an asset price for that period. Specifically, ATR is a measure of volatility introduced by market technician J. Welles Wilder Jr. The true range indicator is taken as the greatest of the following: current high less the current low; the absolute value of the current high less the previous close; and the absolute value of the current low less the previous close. The average true range is then a moving average, generally using 14 days, of the true ranges.
Why is our indicator special and different from the normal ATR indicators?
We have modified the mathematical equation and changed it slightly to give more accurate signals, we do not promise all trades are profitable, the use of this indicator is up to your own judgement and liability. We believe that we have an indicator like no other ATR.
P.S: This is not financial advice, we are just sharing our indicator that we know has good results, and it will take time for people in -ve profiles to recover losses and for the profiting to be more profitable. We use a specific trading method that only works with it
You can contact me for more information about the indicator, Goodluck :)

Theft Indicator - BUY/SELL AlertsWhat is our indicator?
Theft Indicator - Buy & Sell Alert System is our first published script that shows price action on a certain period of time (We Use ATR indicator). We take pride in enabling trading to become easier for the experienced and the non-experienced traders around the globe. Buy & Sell alerts will be fired once a conditions in our algo is met.
Does it Repaint?
Our indicator does NOT re-paint. Although while setting an alert it may pop up the repaint alert, please take into consideration that once a signal is fired on a "CLOSED BAR", our signal will never disappear, they do not repaint.
What Markets is it usable with?
You can use it in any market, Forex, Stocks, Crypto, Indices. We recommend high time frames but you can also use it on the 1 minute chart if you are a scalper and a risk taker. All time frames are profitable, not all trades. But the Majority is profitable. We will soon add a backtest strategy for it, there is no ETA on it tho.
How to use:
Simple plug and play it to your chart, in addition to a few other indicators we will recommend to you (we still have not published them yet), and this will confirm your trades. You can also connect TV alerts with a bot and let it run. Please be aware that SLIPPAGE time is important, If you run a bot on this indicator you HAVE to know that the buy/sell price will be on the bar AFTER the Candle close (For example: the BUY/SELL alert is on a candle, the buy/sell your bot or you will execute WILL be in the following candle depending on your trading system. Theft Indicator - Buy/Sell Alerts work best with higher time frames, however it works on smaller time frames, we recommend 15 mins, 30 mins, 1hr, 4hr. It just depends on your trading style. Please contact us if you do not understand how to use it.
How are the Buy/Sell Alerts fired?
We use the simple ATR (Average True Range) indicator. However we have modified the indicator to fit our trading system. Check below for a definition of what ATR is:
What is Average True Range - ATR?
The average true range (ATR) is a technical analysis indicator that measures market volatility by decomposing the entire range of an asset price for that period. Specifically, ATR is a measure of volatility introduced by market technician J. Welles Wilder Jr. The true range indicator is taken as the greatest of the following: current high less the current low; the absolute value of the current high less the previous close; and the absolute value of the current low less the previous close. The average true range is then a moving average, generally using 14 days, of the true ranges.
Why is our indicator special and different from the normal ATR indicators?
We have modified the mathematical equation and changed it slightly to give more accurate signals, we do not promise all trades are profitable, the use of this indicator is up to your own judgement and liability. We believe that we have an indicator like no other ATR because of our algo that is different from the normal ATR calculation.
P.S: This is not financial advice, we are just sharing our indicator that we know has good results, and it will take time for people in -ve profiles to recover losses and for the profiting to be more profitable.
You can contact me for more information about the indicator, Goodluck :)

Blue FX Trend StrategyHi, welcome to the Blue FX Trend Strategy Script.
What does it do?
Our strategy will help you identify the current trend in the markets and highlight when this is changing. The strategy itself is based upon 4 indicators lining up in total confluence to increase the probability of the trade being a success, this is specifically an EMA, MACD settings, Supertrend criteria and also Momentum.
Absolutely no technical analysis is needed to trade this successfully - this can be used on all time frames and all pairs - obviously with varying profitability as all pairs work differently - this can be reviewed quickly in 'Strategy Tester' to hone in on your own desired settings.
When all criteria is in alignment the strategy will convert all candles to the relevant colour - Green for an uptrend and Red for a downtrend; a candle that is printed normally simply shows that no current trend is in place to warrant a colour change. A normal coloured candle could possibly indicate a change in current market direction or the market consolidating before a further move in the initial direction. When a new signal is valid 'Blue FX Buy'' or 'Blue FX Sell' will be displayed and the small arrow shown on candle open for entry.
How do I use it?
Our strategy is invite only - upon joining our group we will allow you access to the script. This will then simply display on your device ready for you to start trading from. There is substantial functionality within the strategy, you can;
See the success of the default settings in the past using the 'Strategy Tester' Function for numerous settings
1. Following the settings 'Trail'
2. Changing your TP function with the other criteria listed
3. Using a Fixed TP or SL function
Upon changing the Script to 'Fixed' you will see numerous trades on the chart displayed differently.
Scaling into a profitable position is also possible - this is ideally done when the candle colour confirms the trend is continuing after rejection/support from the EMA; we show this below;
You could also enter here if you missed the initial sell signal, we have MA rejection and a red printed candle indicating all confluences are in play and we have high probability for the move to continue.
How do I know its profitable?
We have built numerous customisable settings into the strategy for you to see that this is profitable - you can visually see this too. The settings are also customisable to find the right criteria for the right pair on the right time-frame. Ultimately, with the strategy confluences in place, you are putting probability in your favour and can quickly determine the trend in place if there is one. Within the customisable settings there is a compound function too, so if you were to compound your profit the results can be exceptional.
We have also added an H4 confluence, so you can ensure if trading on a lower time-frame you are in the overall direction of the H4 trend too, a useful setting for more confluence again.
Where do I set my Stop loss or Take Profit?
There is no right or wrong to this and we have attempted to build numerous ways of doing this into the strategy for reference.
For setting a SL you could;
1. Use a fixed SL.
2. Place the SL below the last high or low in the trend.
3. Use an ATR function.
4. Place the SL 5 pips below the last 3 candles.
5. Or, trail the price if you are on screen until the next signal is given and a new trend starts - although unless a big trend, you may miss out on some profit by the time price has pulled back.
For placing a Take Profit, you could;
1. Use a fixed TP.
2. Look for the next supply/demand area on the chart (if it breaks and candle colour supports direction - you could enter again).
3. Use an ATR function.
5. Or, trail the price if you are on screen until the next signal is given and a new trend starts - although unless a big trend, you may miss out on some profit by the time price has pulled back.
6. Secure multiple TPs - 20/50/100 pips with Stop loss to entry after the first target is hit.
Here are some examples of the Buy and Sell signals in action;
Will also work on Commodities and Indices as shown below too;
Our recommended visual settings are below;
1. Set to'Trail' Strategy
2. Under 'Style' tab, select Trades on Chart, but un-select both Signal Labels and Quantity to clean up the chart - these settings are useful when testing to see where the trades are opened and closed.
3. We like the candles changing colour to the trend and criteria set however, these can be turned off to display normal bullish and bearish candles.
When reviewing profitability you can do this by selecting 'Overview' 'Performance Summary' and 'List of Trades'.
Please consider that the settings based into the strategy could differ to your own money management rules and your management of your SL and TP as outlined above - we have tried to cover as many bases as possible here.
We look forward to you using this strategy to profit from the market, please share your feedback and results with us.
Kind regards
Blue FX Team
EMASARPLEASE READ THE FULL DESCRIPTION BEFORE BUYING OR USING THIS INDICATOR
EMASAR (pronounced Emma-sar) is a strategy based on Exponential Moving Averages and the Parabolic SAR . This is a position trading approach that is derived from Tyler Jenks’ Consensio.
This strategy was developed with four objectives in mind: (1) managing risk (2) protecting from missing out on major moves (3) maximizing risk:reward (4) staying in a trending market and taking profit before it fully reverses.
EMASAR does a great job at accomplishing all of the above through the buy and sell signals that are generated. The data provided below is from the signals that occurred on Bitcoin (Bitstamp) from January 1, 2015 to present (November 11, 2019).
(1) Risk is tightly managed, relative to the winners, and losing positions will be exited before the market moves too far against.
The biggest losing trade on Bitcoin, for the time period outlined above, is -18.47%.
(2) Following the EMASAR buy and sell signals guarantees that one will not miss out on a major trend. As a result of the indicators used for this system it is mathematically impossible for a major trend to occur without providing a buy or sell signal. This system isn't meant to catch exact tops or bottoms but it will do a great job of capturing ~85% of a trend.
(3) On average the winning trades will be 5.55 times the losing trades. There will be stretches where the losers are bigger than the winners and this could last for many months, maybe even a year. However, over the long run the average reward is expected to be 5.55 times the average risk*.
*Past performance does not guarantee future results!
(4) This indicator was designed to capitalize on parabolic markets, specifically Bitcoin and alt coins. Crypto markets have a tendency to get moving so fast that many indicators become all but useless.
Entries can get signaled too late and exits will get signaled way too early. This is specifically true when using oscillators that are designed to identify overbought or oversold environments. EMASAR does a great job of keeping us in a position for the duration of a trend and this includes the major parabolic runs that Bitcoin has a tendency to go on.
Take a look at the two charts below which illustrates the buy and sell signals that occurred at the beginning and end of the 2017 and 2019 parabolic moves. Green = Buy | Blue = Exit | Red = Short
Long signaled at $4,190.27 on September 29th, 2017
Exit signaled at $13,647 on January 14th, 2018
Short signaled at $12,050 on January 16th, 2018
Close Short signaled at $3,684 on February 18th, 2019
Long signaled at $3,684 on February 18th, 2019
Exit signaled at $9,614 on July 16th, 2019
Short signaled at $10,328 on July 22nd, 2019
When Bitcoin, or other alts, really get moving it can be very difficult to distinguish between a correction and a full reversal. We do not want to be exiting during a minor correction, instead this is a time when we want to be holding on or looking to buy the dip.
This is a very fragile balance. The market has a very strong tendency to make corrections looks like reversals and to make reversals look like corrections. Therefore it is very important to have a tool(s) that you trust to distinguish in between the two.
I believe that EMASAR is the best way to find that balance - if I knew of a better way then I would be using it instead!
Following these signals will help us to hold onto positions while the market is still trending in our favor when most think that it has moved too far / too fast, and it will also get us out before a market fully reverses.
Keep in mind that there will be times when we exit a market that is in danger of reversing, only to buy back higher later on. That is okay because it enables us to properly manage risk during times of uncertainty and buying back in at a higher price is more than worth the opportunity cost.
Lets look at the signals above in chronological order:
1) Close Long: $2,274
2) Open Short: $2,347
3) Exit Short: $2,934
4) Open Long: $2,766
5) Close Long: $3,124
6) Enter Long: $4,190
A long was closed at $2,274 after Signal #1 and was re-entered after Signal #4 at $2,766. Additionally a long was closed at $3,124 after Signal #5 and was re-entered on the following signal at $4,190. These are examples of some of the bad signals that will occur. Something to pay attention to is the ratio of the risk to the reward. When the market turns against us EMASAR will quickly signal an exit or a re entry.
EMASAR also works great in traditional markets. The S&P 500 has been on a tear lately after creating new all time highs in October of 2019. It has resumed it's strong bull trend and therefore it is a great market to have long exposure to. That being said we are well overdue for a correction and most people, including myself, expect the next bear market to be much more severe than the last two. Therefore I would not want to have long exposure unless equipped with a very reliable method for taking profit before it fully reverses.
Let's take a look at the S&P 500 weekly EMASAR signals using the preferred settings outlined below:
In August of 1990 EMASAR signaled a 'Close Long' at $308. At that time the market was in danger of fully reversing. When that didn't happen EMASAR gave a signal to re enter at $369 which resulted in losing 19.8% in opportunity cost. That is quite okay because it would have allowed us to properly protect ourselves in the event that the market proceeded to crash. Instead we entered a massive bull market that culminated in the dot com bubble. Notice how EMASAR kept us in for the entire duration of that bull run and then signaled an exit very close to the top at $1,294. It got us back in by the end of 2004 after the market had bottomed. Yet again it kept us in for the following multi year bull market before signaling an exit very close to the top at $1,270.
The action that followed in 2016 looks very similar to what happened in 1990 - 1991. An exit was signaled when the market was in danger of fully reversing. When that didn't happen a re entry was signaled 14% higher. Now the market appears to be taking off in another parabolic advance. There is no way to know how far this next run will go or how long it will last. Nevertheless I feel highly confident that I will be able to hold on for the majority of the trend and then get fully out before it reverses thanks to the signals provided by EMASAR.
When looking at the signals on Gold we will notice striking similarities to the signals in the S&P 500 as well as Bitcoin.
Notice how an entry was signaled very close to the bottom at $323 in June of 2002. An exit was also signaled very close to the top at $1,441 in April of 2013. Throughout that runup there was one bad signal that cost some opportunity. It's very important to understand that missing out on opportunity is well worth the price because it allows us to effectively manage risk. EMASAR also recently provided a long signal at $1,401 which preceded this recent runup.
Settings
Default settings work best for crypto, however the time multiplier should be adjusted for markets that are not open 24/7. For commodities and FOREX my default is 40 and for stocks I use 24. The Moving Averages can be adjusted as well. The period can be changed and you can also select SMA or EMA. I always use the EMA's and strongly prefer the 50 and 200. We have noticed good results with the 9 and 54 EMA's as well. The shorter the period that the Moving Average is set to the more frequent the signals will be. This will generally improve risk:reward while decreasing strike rate. For crypto the best time frames are the 4h and 6h. For traditional markets the best time frames are the Daily, 3D and Weekly. EMASAR can be used on smaller time frames as well, specifically in crypto. The 15m and 1h have shown good results.
Risks
The biggest risks with trading EMASAR revolve around disobeying the signals. Risk management is built into this system with the exit signals that will occur, however it is up to the individual to execute those signals. Passing on an exit signal could lead to a big loss which would have a dramatic impact on the ROI. Most trading systems will have small and medium losses with small, medium and large wins. That is exactly how this works. The small - medium losses and wins will mostly be a wash and will account for roughly 80% of the trades. The large wins will happen about 20% of the time and will make up 80% - 90% of the profits.
Therefore the two biggest risks are passing on signals entirely, or exiting preemptively. Getting chopped in and out of a market can be quite frustrating. If you become overwhelmed with negative emotions then it could cause you to pass up on the next signal. That signal will often be the one that more than makes up for the small - medium losses that preceded.
On average EMASAR will provide one signal every 6 weeks when using the default settings on the 4h chart. Therefore missing one entry could turn an otherwise profitable year into a loser. If electing to trade a system, whether it is EMASAR or another, it is crucial to commit to taking every signal regardless of outside variables (namely your personal bias about market direction or frustration that follows a losing stretch).
Another major risk with this system is taking too much profit too soon. When getting into a trade that has the potential to be a big winner it can be challenging to continue holding through the swings. Anyone that has watched paper profits vanish will be inclined to start exiting after the market makes a big move in his or her favor. While this is better than watching profits completely evaporate, this mistake can be enough to turn a profitable system into one that loses to the market. If 80% - 90% of our profits come from 10% - 20% of our trades then it is vital we do not cut those positions off at the knees.
If taking too much profit too soon then you will consistently turn potential large winners into medium winners. This may lead to making money over the long run which will make it very difficult to realize that anything is wrong. However making money and beating the market are two very different things. Exiting early and making money is nearly as big of a risk as missing entries entirely.
If you have the discipline to execute signals in a timely manner after they are triggered and the emotional control to let the winners run despite the appearance of a vastly overbought / oversold market, then you should have what it takes to beat the market with EMASAR.
If you are not an experienced trader then it is very important to start out small. The only way to learn is to trade in a live environment and the only way to succeed is to risk much less than you can afford to lose. If you have $2,000 to trade with then start with a maximum position size of $20 - $50 and don’t be shy about scaling that down even further. Focus on ROI instead of actual dollars made. If you can return 100% on a $20 roll then you should be able to do the same with a $2,000 roll.
Important Notes
Make sure that you read / understand the risks outlined above. If you jump into this without understanding the unique risks that this system entails then you are going to have a bad time.
This indicator was developed around the 4h and that is where it works best. For crypto adjusting to higher TF’s will cause for bad results as the entries / exits will be late to the party. For traditional markets the Daily - Weekly time frames are preferred. It was not originally intended for smaller TF's but we have seen some good results on the 15m and 1h. The RSI can be a great compliment when using on smaller TF's. Adding a rule for not entering when RSI > 75 or < 25 and instead entering when RSI retests 50 will help to avoid some bad signals.
Alerts can be set for this indicator. Simply make sure that it is visible on the chart, then click the alert icon on the top panel. In the first dropdown set 'Condition' to 'EMASAR' and the second 'Condition' for the upcoming signal. For example if just entered long then set the second condition to 'Close Long' and you will be notified as soon as that signal occurs. If waiting for the next long entry then set the second condition to 'Open Long' so on and so forth. There is an 'All in One' alert that is also available. If you select that then you will be alerted any time that a signal occurs. The message will tell you to check the chart to see which signal caused the alert.
How to Buy
The EMASAR Indicator is available for purchase on my website. The link can be found in my signature or in the tagline of my Trading View profile.
The price is $500 per year which is only payable in Bitcoin. That also includes access to a private Telegram group.

Quantum Trend MonitorCurrency pairs never go up or down in a straight line. They rise and fall constantly, creating pullbacks and reversals. And with each rise and fall, so your emotions rise and fall. Hope, then fear, then hope again. This is when the market will try to frighten you out of a strong position. It is when you are most vulnerable.
But not if you have the Quantum Trend Monitor. And here, you get two indicators for the price of one!
The Quantum Trend Monitor has been designed to absorb these temporary pauses and pullbacks. It analyses the price action, and only changes to a transitional color of dark red or dark blue, if the trend is showing a temporary sign of weakness. If it is a true change in trend direction, the indicator will change to a bright color, as the new trend develops.
In other words, the Quantum Trend Monitor, does just that. It monitors the strength of the trend. This is displayed as a solid horizontal bar at the bottom of the screen. The trend monitor works in conjunction with the Quantum Trends indicator, helping to keep you in – guess what – the trend. One of the hardest things to do in trading. But, with the Quantum Trend Monitor, it’s a breeze. We call it, ‘the profit generator’, as that’s exactly what it is. It will help you hold any position for longer periods, maximising your profits. No more closing out early and suffering from trader regret. No more emotional trading decision. Just watch your Quantum Trend Monitor, which….. monitors it for you.
The Quantum Trend Monitor displays four colours at the bottom of the screen as a solid bar:
Bright blue – strongly bullish trend
Bright red – strongly bearish trend
Dark blue – weakness in trend
Dark red – weakness in trend
First, the Quantum Trends indicator alerts you to a possible new trend. If the trend is strong, the Quantum Trend Monitor will change to either bright blue or bright red, supporting the Trends indicator as the trend develops.
Used in conjunction with a multiple time frame approach, it is the indicator which will really make ‘the trend your friend’. Now you will be able to monitor the trends in multiple timeframes in real time, reducing risk, improving returns, and increasing your overall profitability.
The Quantum Trends create the signal, its sister indicator the Quantum Trend Monitor then kicks in. Together, these two indicators provide you with the perfect tools to manage your position. No more fear, no more doubt, no more uncertainty. Watch your trading account grow, as you allow your profits to run – with confidence!
And guess what – it doesn’t end there.
Remember we said you get two indicators for the price of one here! Well, to help you further, the Quantum Trend Monitor comes with its own unique trend line, which gives you a further ‘heads up’ on the trend. For clarity and simplicity, this indicator overlays the Quantum Trend Monitor and appears as a yellow line. The line chart shows the momentum of the trend and works as follows:
If the yellow trend line is above the zero line, there is a bullish trend in place
If the yellow trend line is below the zero line, there is a bearish trend in place
When the yellow trend line crosses the zero line, the trend has reversed
The further the yellow trend line gets from the zero line, the greater the strength and momentum of the trend
As the old saying goes – two heads are better than one. Here we could say – two indicators are better than one. Now with the Quantum Trend Monitor and the yellow trend line, you have a complete picture of the trend. Staying in and maximising your profits has never been easier.
And finally.. this is the next generation of TradingView indicators and virtually all our indicators can be configured to suit your own trading style. Why? Well, you buy everything else to suit you and your personality – from clothes to cars – so why not trading indicators? After all, as a scalping forex trader you will have different requirements to a swing or trend trader. You wouldn’t buy clothes that don’t fit, so why put up with indicators that cannot be configured. Simple.
One size fits all does not apply – in our view!
So, just like our other indicators, the Quantum Trend Monitor can be ‘tweaked’ to suit your trading style – the benefits are self-evident. Your trading consistency and profits will improve. After all, you are now using tools matched to the job. Precision trading requires precision tools and fine tuning. Don’t make do with second best.
With the Quantum Trend Monitor, you are in control. Just like the volume control on your radio, you adjust the sensitivity of the indicator to suit your trading style. Turning up the sensitivity a little alerts you earlier to periods of congestion – important if you are purely scalping. Turn it down a little, and this will smooth out these phases and keep you in those longer term trends for maximum profits.
The two indicators work in all timeframes.
Getting in is easy – staying in is hard. With the Quantum Trend Monitor and the associated trend line, staying in becomes easy too!

Trend Scalping Strategy - ForexHi all,
I have created the attached strategy for my own use primarily but thought I would share it as my experience to date is that it is profitable in particular circumstances, so thought I would open this out to the community to see if it can be successfully applied on any other pairs and timeframes.
I have protected the source code at this time - mainly because it needs massive tidying up! If I ever get time to do this then I will
The concept of the strategy is based upon the slingshot method - the strategy fundamentally does the following:
- Tests each candle for a new short term trend based upon EMAs
- If there is a new trend, check the RSI and ensure it isnt above the upper RSI threshold (for long positions) and below the lower RSI threshold (for short positions)
- If it passes the RSI check, entry is valid and draws a bar on the chart to show the opening entry position, stop loss position, take profit 1 and take profit 2 positions.
I have backtested this across 28 pairs on the M15 timeframe, comprising of a total of 140,000 candles (35,000 hours of trading). Across this period, 18 of the 28 pairs I looked at were profitable, with overall significant profit if live traded across the 28.
I have live tested 5 pairs on the same timeframe:
- GBPJPY
- GBPUSD
- GBPEUR
- CADJPY
- EURJPY
These pairs have to date given a rough ROR (Return on Risk) position of approx 60% average per trade.
All of the above has been done with the following inputs:
- RSI Upper - 68
- RSI Lower - 32
- Stop Loss - 0.0015
- TP1 - 0.002
- TP2 - 0.004
The SL and TPs are based on a decimal entry of a percentage movement - i.e. the Stop loss above reflects a 0.15% movement, etc etc. Obviously if this were to be tested on longer time frames it is likely that these would need to be larger figures.
I have also tested this live with great success on the S&P 500 and the FTSE, with the following settings:
Indicator Timeframe TP1 TP2 SL Upper Lower
FTSE M5 0.0015 0.004 0.001 70 30
SPX M5 0.0015 0.004 0.001 75 35
Three key notes on trading this below - THESE ARE VERY IMPORTANT!
- This is NOT a high strike rate strategy. Strike rate on profitable pairs is between approx 45 and 55% (although I have seen as low as 35% and still seen significant profit). This has two natural conclusions - risk management is VITAL (I risk 0.5% on each trade, but this may in fact be high for this strategy), and be prepared for potentially significant drawdowns. I have seen certainly drawdowns of 20 consecutive losing trades (counting TP1 and TP2 as 2 trades) and probably longer, which obviously means drawdowns of 10% or greater. The other thing to bear in mind is that with this kind of strike rate, you shouldnt be setting TP1 at a 1:1 risk reward or lower.
- Take Profit 1 is easy - straight Stop and Limit orders. Take Profit 2 is a trailing stop with a start point of the limit for TP1, with then a trailing stop of this distance. This means that should you win on TP1, TP2 is a risk free trade but also trails in for profit if TP2 isnt reached (which it normally isnt). DO NOT set TP2 as a standard stop and limit, this rapidly makes this strategy unprofitable. The point here is that if you reach TP1 you are in some form of trend where you want to capture as much profit as you can.
- Do not enter a trade mid candle. The strategy is based upon the close of the trending candle not the "live" price during this candle, so no need to rush into a trade. If you enter mid candle you will find more often than not that the indicator wasnt for a valid trade by the candle close.
Also, standard disclaimer - past performance is no guarantee of future performance, and if you choose to use this strategy/indicator you do so 100% at your own risk. As a minimum, pick your pairs carefully - I have found particular unprofitability with this strategy with the AUD and NZD pairs so I have ruled these out completely at present, although with different timeframes and inputs these may of course be profitable.
I hope this is helpful for someone...I'd welcome any feedback or other setups where this is profitable.
Moving forward, I want to do some more work on this strategy to rule out some of the more negative trades, and I primarily intend to do this using pivots - however this will be an as and when I get chance.
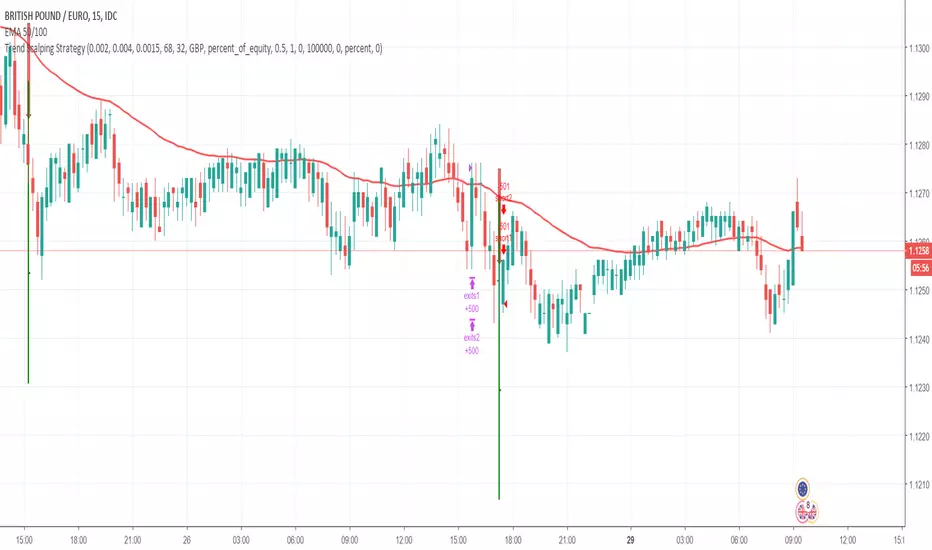
PrettyGoodIndicator by Clefsphere9/12/2018 Amazon current stop is at 1487.
PrettyGoodIndicator. A strategy which seeks a favorable entry point and then holds through normal volatility to let profits run. Green background is when the signal is bullish. Script is written to show back-test results. Dates of back-test period can be adjusted. Strategy is for Long trades only.
Features:
* Features a Moving Stop which is based on volatility. A multiplier is used and can be adjusted for more or less volatility. Of course the dilemma of stops is that adjusting to tighter stop may result in more stop outs, less profits. Whereas, looser stop may result in larger losses, larger profits. This Moving Stop usually adjusts Up but possibly might move Down depending on a new signal(s) after the original signal. This flexible moving stop usually gives the stock extra room to fluctuate because of the signal triggering again within the trade.
* When subsequent signal triggers occur during trade, Moving Stop will adjust accordingly, possibly downward, to allow for the new signal.
* When each profit target is reached, profit target (in green) moves up and Moving Stop (orange) moves Up.
* A Hard Stop (red line) is also used as a fail safe. It moves to break-even when certain profitably is reached. Once Hard Stop moves to break-even it will not move down.
* The gray volatility bands that plot between trades are where Hard stop and profit target will be set when signal happens. This indicator allows for large drawdowns even though it uses stops, so allocate more or less funds according to the loss that would occur if lower volatility bands/stop reached.
* Review the back-test results in the chart and let me know if you want to check it out for a trial run.
Coded with latest PineScript version 3. For more information and to request for use, go to: marketcast.wordpress.com
Thanks for your interest and support!
Disclaimer: This information is not trading advice and is for educational purposes only. Trade at your own risk. Past performance is not a guarantee of future results.

Indexrate Code A(i)Indexrate Code A is an indicator based on the Indexrate Code B indicator and is part of the Indexrate Code Algorithm Suite. This indicator is designed for automated trading platforms.
The Indexrate Code Algorithm Suite can be used for any trading instrument and on any existing market (Stock Market, Forex, Cryptocurrency Market, etc.).
By gaining access to Indexrate Code A, you gain access to the entire Indexrate Code Algorithm Suite.
Indexrate Code A is a combination of indicators and oscillators, individually developed and integrated with two primary and two secondary trading strategies, allowing traders to optimize their entry points. This suite of indicators and oscillators is the result of two years of research, market observation, and strategy optimization to identify the best entry signals.
Key Indicators & Oscillators in Indexrate Code A:
Momentum (hidden – part of Indexrate Code B)
Difference Momentum (hidden – part of Indexrate Code B)
StochRSI (hidden – part of Indexrate Code B)
Money Flow Index (MFI) (hidden – part of Indexrate Code B)
EMA (partially displayed)
Trend HMA
Sequential
Trend Score WMA (hidden – part of Indexrate Code B)
Parabolic SAR
Volume (displayed in the status bar)
Heiken Ashi (displayed on candles)
EMA (Partially Displayed)
The EMA (Exponential Moving Average) consists of a group of curves – 13, 25, 50, 100, and 200 EMA. There are additional hidden curves used in one of the entry strategies. The EMA helps traders assess market direction, trend reversals, and dynamic support/resistance levels.
EMAs calculate the average asset price over a selected period, giving more weight to recent prices, which are more relevant for trend development. As a result, EMAs react faster to price drops and surges, making them popular among traders.
The indicator displays five EMAs:
13 EMA (Green)
25 EMA (Purple)
50 EMA (Orange)
100 EMA (Blue)
200 EMA (Red)
Example of EMA Usage
EMAs often act as dynamic support/resistance levels – prices where an asset is likely to temporarily reverse direction.
If the price is above the EMA and approaches it, a rebound upward is more likely than a breakdown.
If the price is below the EMA and rises toward it, a resumption of a downtrend is more likely than a breakout.
EMAs can also identify well-known patterns like the Golden Cross and Death Cross.
Golden Cross
A bullish pattern where a short-term EMA crosses above a long-term EMA (e.g., 50EMA > 200EMA). This signals a potential uptrend.
Death Cross
A bearish pattern where a short-term EMA crosses below a long-term EMA (e.g., 50EMA < 200EMA). This signals a potential downtrend.
Trend HMA
A trend indicator based on the Hull Moving Average (HMA).
The HMA is an advanced moving average that accurately detects trend reversals and filters signals. The slow-period HMA defines the trend, while the fast-period HMA identifies short-term movements.
Example of Trend HMA Usage
Green = Long (bullish)
Red = Short (bearish)
White = Weak trend
The indicator also supports divergence detection:
Green Label = Bullish divergence
Red Label = Bearish divergence
White Label = Uncertainty
Sequential
Helps traders confirm trend direction and strength. It labels candles with numbers (1 to 9), indicating trend stages.
Blue Numbers = Long Trend
Gray Numbers = Short Trend
Red Candle = End of Long Trend
Green Candle = End of Short Trend
Example of Sequential Usage
When the indicator reaches Signal #9, a trend reversal is likely. The probability increases if it reaches Signal #13.
Parabolic SAR
A trend-following indicator that signals potential reversals.
Blue Line = Long
Gray Line = Short
Crossings indicate trend reversals
Example of Parabolic SAR Usage
The dots switch sides when a trend reversal is likely.
Optimizing Settings (33 Parameters for 100% Profitability)
Traders can fine-tune 33 parameters to maximize profitability. Indexrate Code B visually assists in optimization, as all its parameters are embedded in Indexrate Code A.
Recommended Timeframes
Works on any timeframe (e.g., 4H, 6H).
For Heiken Ashi charts, enable real price display in settings to avoid misleading averages.
Important Notes
No indicator guarantees 100% success – Markets are driven by human psychology (supply & demand).
Technical analysis relies on past data (price & volume).
Indexrate Code evaluates trends, price, volume, and trader psychology.
All future updates will be free.
"Trading is about probabilities. Investing is about opportunities. No one knows the future—always protect your profits."

Gold Multi TP Strategy📘 Strategy Description: Gold Multi Take-Profit Strategy (XAUUSD)
This strategy is designed for Gold (XAUUSD) and works on any timeframe (recommended: 15-min or higher). It executes trades based on a simple EMA crossover logic with optional higher-timeframe and ATR-based filters to confirm trend direction and volatility.
🔑 Core Features
✅ Directional control: Trade only long, short, or both directions (Strategy Direction)
✅ Multi-level Take Profit: Scale out at up to 4 configurable profit targets
✅ Fixed Stop Loss: Set custom SL distance for risk control
✅ Position Sizing: Allocate different percentages to each TP level
✅ HTF Trend Filter (optional): Align trades with weekly candle trend
✅ ATR Filter (optional): Improve entries with volatility-based filter
⚙️ Inputs Explained
Input Name Function
Strategy Direction Choose to trade all, long, or short only
Length of Filter Length of the moving average used for HTF trend filter
Candle Time Reference candle timeframe in minutes (e.g., 1440 for daily)
Length of ATR Period for ATR calculation (volatility)
HTF Higher timeframe for filter (e.g., 1 week)
Filter Checkbox Enable/disable trend filter
Stop Loss Fixed SL distance in price units
Qty_percent1-3 % of position allocated to TP1–TP3 (rest goes to TP4)
Take profit1–4 TP levels (in price units) from entry price
🧠 Logic Overview
Entry triggered on EMA 20/50 crossover
Optional filter: entry allowed only if current price is above its HTF MA (bullish) or below (bearish)
Position is scaled out at up to 4 profit levels using different qty_percent
SL remains fixed throughout the trade
📊 Best Use
Intraday trading on XAUUSD, ideally during London/NY sessions
Trending or breakout conditions
Works best with additional confluence (price action, S/R, news)
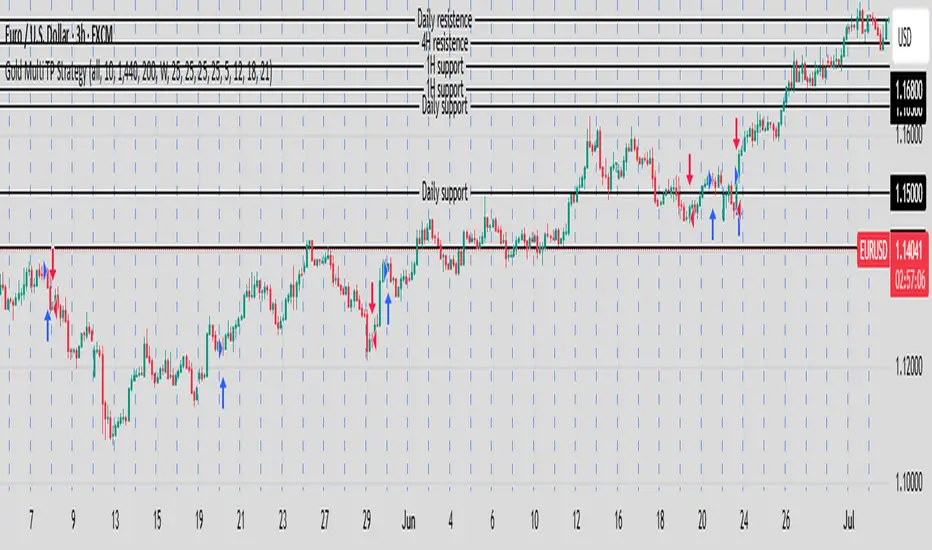
52SIGNAL RECIPE Coinbase Institutional Smart Money DetectorCoinbase Institutional Smart Money Detector
◆ Overview
Coinbase Institutional Smart Money Detector is an innovative indicator that detects the buying and selling movements of institutional investors through Coinbase Prime in real-time. This powerful tool tracks the flow of funds from large institutions to provide valuable signals before significant market direction changes occur. It can be applied to Bitcoin charts on any exchange, allowing traders to follow the "smart money" movements of institutions anytime, anywhere.
The unique strength of this indicator lies in its comprehensive assessment of institutional investors' consecutive trading behaviors, volume patterns, and trend strength by analyzing Coinbase data in real-time. By providing clear visual representation of institutional fund flow data that is difficult for ordinary traders to access, you gain the opportunity to move alongside the big players in the market.
─────────────────────────────────────
◆ Key Features
• Coinbase Prime Data Analysis: Tracks institutional movements in real-time by analyzing data from Coinbase Prime, an institutional-only service
• Real-time Institutional Fund Flow Monitoring: Immediately detects large institutions' spot buying/selling activities, allowing positioning ahead of the market
• Universal Exchange Compatibility: Applicable to Bitcoin charts on any exchange, enabling use on your preferred trading platform
• Institutional Continuity Analysis: Identifies continuous institutional activity by tracking consecutive buying/selling patterns
• Smart Volume Analysis: Detects increased volume compared to averages and analyzes key trading time periods
• Trend Strength Measurement: Quantifies and displays the strength of upward/downward trends by analyzing candle patterns
• Intuitive Visualization: Clearly marks institutional activity points on charts through bar coloring and labels
• Real-time Strength Display: Calculates and displays current trend strength in a table in real-time
• Customizable Settings: Allows customization of key parameters to match your trading style
─────────────────────────────────────
◆ Understanding Signal Types
■ Institutional Buy Signal
• Definition: Occurs when institutional investors show consecutive buying activity through Coinbase Prime, accompanied by increased volume and strong upward trend
• Visual Representation: Translucent blue bar coloring and "Institution Buying Detected!" label on the candle where the buy signal occurs
• Market Interpretation: Indicates that institutional investors are actively buying spot Bitcoin, which is likely to lead to price increases
• Signal Strength Factors:
▶ Consecutive price increase patterns
▶ Above-average volume
▶ Strong upward trend strength measurement
▶ Significant price movement
■ Institutional Sell Signal
• Definition: Occurs when institutional investors show consecutive selling activity through Coinbase Prime, accompanied by increased volume and strong downward trend
• Visual Representation: Translucent pink bar coloring and "Institution Selling Detected!" label on the candle where the sell signal occurs
• Market Interpretation: Indicates that institutional investors are actively selling spot Bitcoin, which is likely to lead to price decreases
• Signal Strength Factors:
▶ Consecutive price decrease patterns
▶ Above-average volume
▶ Strong downward trend strength measurement
▶ Significant price movement
─────────────────────────────────────
◆ Understanding Trend Strength
■ Trend Strength Measurement Method
• Definition: Measures trend strength by analyzing the ratio of up/down candles over a recent period
• Visual Representation: Displayed in the table as "BULL STRENGTH" or "BEAR STRENGTH" with percentage value and "STRONG" or "WEAK" status
• Strength Threshold: Strong/weak determination according to user-configurable threshold
• Calculation Method:
▶ Upward trend strength = (Number of upward candles) / (Total analysis period)
▶ Downward trend strength = (Number of downward candles) / (Total analysis period)
▶ Displayed as "STRONG" when strength is above threshold, "WEAK" when below
■ Utilizing Trend Strength
• Signal Filtering: Generates signals only when trend strength is strong, reducing false signals
• Trend Confirmation: Evaluates the health and sustainability of the current market trend
• Entry/Exit Decisions: Consider entering in strong trends and exiting when trends weaken
• Risk Management: Develop strategies to reduce position size in weak trends and increase in strong trends
─────────────────────────────────────
◆ Practical Trading Applications
■ Institutional Buy Signal Strategy
• Trend Reversal Scenario:
▶ Setup: Strong institutional buy signal during a downtrend
▶ Entry: Buy after signal confirmation in the next candle
▶ Stop Loss: Below the low of the signal candle
▶ Take Profit: When reaching previous major resistance or when trend strength weakens
• Trend Continuation Scenario:
▶ Setup: Institutional buy signal after correction in an uptrend
▶ Entry: Buy after signal confirmation
▶ Stop Loss: Below recent major low
▶ Take Profit: Gradually take profits considering trend strength
■ Institutional Sell Signal Strategy
• Trend Reversal Scenario:
▶ Setup: Strong institutional sell signal during an uptrend
▶ Entry: Sell after signal confirmation in the next candle
▶ Stop Loss: Above the high of the signal candle
▶ Take Profit: When reaching previous major support or when trend strength weakens
• Trend Continuation Scenario:
▶ Setup: Institutional sell signal after bounce in a downtrend
▶ Entry: Sell after signal confirmation
▶ Stop Loss: Above recent major high
▶ Take Profit: Gradually take profits considering trend strength
■ Multi-Timeframe Approach
• Higher Timeframe Direction Confirmation:
▶ Check institutional signals and trend strength on daily/4-hour charts
▶ Use for setting main trading direction
• Lower Timeframe Entry Point Finding:
▶ Wait for lower timeframe signals that align with higher timeframe direction
▶ Use for capturing precise entry points
• Cross-Timeframe Signal Alignment:
▶ Signal strength increases when signals occur in the same direction across multiple timeframes
▶ Capture high-probability trading opportunities
─────────────────────────────────────
◆ Indicator Settings Guide
■ Main Setting Parameters
• Institutional Continuity Period:
▶ Purpose: Sets the period to check institutional consecutive buying/selling activity
▶ Lower value: Generates more signals, increases responsiveness
▶ Higher value: Reduces number of signals, increases reliability
• Trend Strength Threshold:
▶ Purpose: Sets the minimum threshold for determining strong trends
▶ Lower value: More signals, less filtering
▶ Higher value: Generates signals only in stronger trends, higher filtering
─────────────────────────────────────
◆ Synergy with Other Indicators
• Support/Resistance Levels:
▶ Institutional signals occurring at key support/resistance levels have higher probability
▶ Combination of key technical analysis levels and institutional activity provides powerful signals
• Moving Averages:
▶ Pay attention to institutional signals near key moving averages (50MA, 200MA)
▶ Strong trend change possibility when moving average crossovers coincide with institutional signals
• RSI/Momentum Indicators:
▶ Institutional buy signals in oversold conditions increase reversal probability
▶ Institutional sell signals in overbought conditions increase reversal probability
• Volume Profile:
▶ Institutional signals at high volume nodes confirm important price levels
▶ Institutional activity in key trading areas greatly impacts price direction
• Market Structure:
▶ Institutional signals near key market structures (higher highs/lows, lower highs/lows) suggest structural changes
▶ Coincidence of market structure changes and institutional activity indicates important trend turning points
─────────────────────────────────────
◆ Conclusion
Coinbase Institutional Smart Money Detector provides traders with valuable insights by tracking spot Bitcoin trading activities of institutional investors through Coinbase Prime in real-time. Because it can be applied to Bitcoin charts on any exchange, you can utilize it immediately on your preferred trading platform.
The core value of this indicator is providing intuitive visualization of institutional fund flow data that is difficult for ordinary traders to access. By comprehensively analyzing consecutive price movements, volume increases, and trend strength to capture institutional activity, you gain the opportunity to move alongside the big players in the market.
Clear buy/sell signals based on Coinbase Prime data and real-time trend strength measurements help traders quickly grasp market conditions and make strategic decisions. By integrating this powerful tool into your trading strategy, secure a competitive edge to understand where the market's smart money is flowing and position accordingly.
─────────────────────────────────────
※ Disclaimer: Like all trading tools, the Institutional Smart Money Detector should be used as a supplementary indicator and not relied upon exclusively for trading decisions. Past patterns of institutional behavior may not guarantee future market movements. Always employ appropriate risk management strategies in your trading.
Coinbase Institutional Smart Money Detector
◆ 개요
Coinbase Institutional Smart Money Detector는 코인베이스 프라임(Coinbase Prime)을 통한 기관 투자자들의 현물 비트코인 매수/매도 움직임을 실시간으로 감지하는 혁신적인 지표입니다. 이 강력한 도구는 대형 기관들의 자금 흐름을 추적하여 중요한 시장 방향 전환이 일어나기 전에 귀중한 신호를 제공합니다. 어떤 거래소의 비트코인 차트에도 적용 가능하여 트레이더들이 언제 어디서든 기관의 "스마트 머니" 움직임을 따라갈 수 있게 해줍니다.
이 지표의 독보적인 강점은 코인베이스 데이터를 실시간으로 분석하여 기관 투자자들의 연속적인 매매 행동, 거래량 패턴, 그리고 추세 강도를 종합적으로 평가한다는 점입니다. 일반 트레이더들이 접근하기 어려운 기관 자금 흐름 데이터를 시각적으로 명확하게 제공함으로써, 여러분은 시장의 큰 손들과 함께 움직일 수 있는 기회를 얻게 됩니다.
─────────────────────────────────────
◆ 주요 특징
• 코인베이스 프라임 데이터 분석: 기관 전용 서비스인 코인베이스 프라임의 데이터를 실시간으로 추적하여 기관의 움직임 포착
• 실시간 기관 자금 흐름 모니터링: 대형 기관들의 현물 매수/매도 활동을 즉각적으로 감지하여 시장에 앞서 포지셔닝 가능
• 모든 거래소 호환성: 어떤 거래소의 비트코인 차트에도 적용 가능하여 선호하는 트레이딩 플랫폼에서 활용 가능
• 기관 연속성 분석: 연속적인 매수/매도 패턴을 추적하여 기관의 지속적인 활동 식별
• 스마트 볼륨 분석: 평균 대비 거래량 증가를 감지하고 주요 거래 시간대를 분석
• 추세 강도 측정: 캔들 패턴을 분석해 상승/하락 추세의 강도를 수치화하여 표시
• 직관적 시각화: 바 컬러링과 라벨을 통해 기관 활동 지점을 차트에 명확하게 표시
• 실시간 강도 표시: 현재 추세의 강도를 실시간으로 계산하여 테이블에 표시
• 사용자 정의 설정: 주요 매개변수를 조정하여 자신의 트레이딩 스타일에 맞게 커스터마이징 가능
─────────────────────────────────────
◆ 신호 유형 이해하기
■ 기관 매수 신호
• 정의: 코인베이스 프라임을 통해 기관 투자자들이 연속적인 매수 활동을 보이며, 이와 함께 거래량 증가와 강한 상승 추세가 나타날 때 발생
• 시각적 표현: 매수 신호가 발생한 캔들에 반투명 파란색 바 컬러링과 함께 "Institution Buying Detected!" 라벨 표시
• 시장 해석: 기관 투자자들이 적극적으로 현물 비트코인을 매수하고 있으며, 이는 곧 가격 상승으로 이어질 가능성이 높음을 의미
• 신호 강도 요소:
▶ 연속적인 가격 상승 패턴
▶ 평균보다 높은 거래량
▶ 강한 상승 추세 강도 측정값
▶ 유의미한 가격 변동
■ 기관 매도 신호
• 정의: 코인베이스 프라임을 통해 기관 투자자들이 연속적인 매도 활동을 보이며, 이와 함께 거래량 증가와 강한 하락 추세가 나타날 때 발생
• 시각적 표현: 매도 신호가 발생한 캔들에 반투명 분홍색 바 컬러링과 함께 "Institution Selling Detected!" 라벨 표시
• 시장 해석: 기관 투자자들이 적극적으로 현물 비트코인을 매도하고 있으며, 이는 곧 가격 하락으로 이어질 가능성이 높음을 의미
• 신호 강도 요소:
▶ 연속적인 가격 하락 패턴
▶ 평균보다 높은 거래량
▶ 강한 하락 추세 강도 측정값
▶ 유의미한 가격 변동
─────────────────────────────────────
◆ 추세 강도 이해하기
■ 추세 강도 측정 방식
• 정의: 최근 일정 기간 동안의 상승/하락 캔들 비율을 분석하여 추세의 강도를 측정
• 시각적 표현: 테이블에 "BULL STRENGTH" 또는 "BEAR STRENGTH"로 표시되며, 백분율 값과 함께 "STRONG" 또는 "WEAK" 상태 표시
• 강도 임계값: 사용자가 설정 가능한 임계값에 따라 강함/약함 판정
• 계산 방식:
▶ 상승 추세 강도 = (상승 캔들 수) / (전체 분석 기간)
▶ 하락 추세 강도 = (하락 캔들 수) / (전체 분석 기간)
▶ 강도가 임계값 이상일 때 "STRONG", 미만일 때 "WEAK"로 표시
■ 추세 강도의 활용
• 신호 필터링: 추세 강도가 강할 때만 신호를 생성하여 허위 신호 감소
• 추세 확인: 현재 시장 추세의 건전성과 지속 가능성 평가
• 진입/퇴출 결정: 강한 추세에서 진입하고 약한 추세로 전환될 때 퇴출 고려
• 리스크 관리: 약한 추세에서는 포지션 크기를 줄이고, 강한 추세에서는 늘리는 전략 수립 가능
─────────────────────────────────────
◆ 실전 트레이딩 응용
■ 기관 매수 신호 활용 전략
• 추세 전환 시나리오:
▶ 설정: 하락 추세 중 강한 기관 매수 신호 발생
▶ 진입: 신호 확인 후 다음 캔들에서 매수
▶ 손절: 신호 캔들의 저점 아래
▶ 이익실현: 이전 주요 저항선 도달 시 또는 추세 강도가 약해질 때
• 추세 지속 시나리오:
▶ 설정: 상승 추세 중 조정 후 기관 매수 신호 발생
▶ 진입: 신호 확인 후 매수
▶ 손절: 최근 주요 저점 아래
▶ 이익실현: 추세 강도를 고려하여 단계적으로 이익실현
■ 기관 매도 신호 활용 전략
• 추세 전환 시나리오:
▶ 설정: 상승 추세 중 강한 기관 매도 신호 발생
▶ 진입: 신호 확인 후 다음 캔들에서 매도
▶ 손절: 신호 캔들의 고점 위
▶ 이익실현: 이전 주요 지지선 도달 시 또는 추세 강도가 약해질 때
• 추세 지속 시나리오:
▶ 설정: 하락 추세 중 반등 후 기관 매도 신호 발생
▶ 진입: 신호 확인 후 매도
▶ 손절: 최근 주요 고점 위
▶ 이익실현: 추세 강도를 고려하여 단계적으로 이익실현
■ 다중 시간프레임 접근법
• 상위 시간프레임 방향성 확인:
▶ 일봉/4시간봉에서 기관 신호 및 추세 강도 확인
▶ 주 트레이딩 방향 설정에 활용
• 하위 시간프레임 진입점 찾기:
▶ 상위 시간프레임 방향과 일치하는 하위 시간프레임 신호 대기
▶ 정밀한 진입점 포착에 활용
• 시간프레임 간 신호 일치 확인:
▶ 여러 시간프레임에서 동일한 방향의 신호가 발생할 때 신호 강도 증가
▶ 높은 확률의 트레이딩 기회 포착
─────────────────────────────────────
◆ 지표 설정 가이드
■ 주요 설정 매개변수
• Institutional Continuity Period (기관 연속성 확인 기간):
▶ 목적: 기관의 연속적인 매수/매도 활동을 확인할 기간 설정
▶ 낮은 값: 더 많은 신호 생성, 반응성 증가
▶ 높은 값: 신호 수 감소, 신뢰성 증가
• Trend Strength Threshold (추세 강도 임계값):
▶ 목적: 추세가 강하다고 판단할 최소 임계값 설정
▶ 낮은 값: 더 많은 신호, 낮은 필터링
▶ 높은 값: 더 강한 추세에서만 신호 생성, 높은 필터링
─────────────────────────────────────
◆ 다른 지표와의 시너지
• 지지/저항 레벨:
▶ 주요 지지/저항 레벨에서 발생하는 기관 신호는 확률이 더 높음
▶ 기술적 분석의 핵심 레벨과 기관 활동의 결합은 강력한 시그널 제공
• 이동평균선:
▶ 주요 이동평균선(50MA, 200MA) 근처에서 발생하는 기관 신호 주목
▶ 이동평균선 돌파와 기관 신호가 일치할 때 강한 추세 변화 가능성
• RSI/모멘텀 지표:
▶ 과매수/과매도 상태에서 발생하는 기관 신호는 반전 가능성 높임
▶ 모멘텀 다이버전스와 기관 신호의 일치는 강력한 반전 신호
• 볼륨 프로파일:
▶ 높은 볼륨 노드에서 발생하는 기관 신호는 중요한 가격 레벨 확인
▶ 주요 거래 영역에서의 기관 활동은 가격 방향에 큰 영향 미침
• 시장 구조:
▶ 주요 시장 구조(높은 고점/저점, 낮은 고점/저점) 근처에서 발생하는 기관 신호는 구조 변화 암시
▶ 시장 구조 변화와 기관 활동의 일치는 중요한 추세 전환점 표시
─────────────────────────────────────
◆ 결론
Coinbase Institutional Smart Money Detector는 코인베이스 프라임을 통한 기관 투자자들의 현물 비트코인 거래 활동을 실시간으로 추적하여 트레이더들에게 귀중한 통찰력을 제공합니다. 어떤 거래소의 비트코인 차트에도 적용 가능하기 때문에, 여러분이 선호하는 트레이딩 플랫폼에서 바로 활용할 수 있습니다.
이 지표의 핵심 가치는 일반 트레이더들이 접근하기 어려운 기관 자금 흐름 데이터를 직관적으로 시각화하여 제공한다는 점입니다. 연속적인 가격 움직임, 거래량 증가, 그리고 추세 강도를 종합적으로 분석하여 기관의 활동을 포착함으로써, 여러분은 시장의 큰 손들과 함께 움직일 수 있는 기회를 얻게 됩니다.
코인베이스 프라임 데이터를 기반으로 한 명확한 매수/매도 신호와 실시간 추세 강도 측정은 트레이더들이 시장 상황을 한눈에 파악하고 신속하게 전략적 결정을 내릴 수 있게 도와줍니다. 이 강력한 도구를 여러분의 트레이딩 전략에 통합함으로써, 시장의 스마트 머니가 어디로 흘러가는지 파악하고 그에 따라 포지셔닝할 수 있는 경쟁 우위를 확보하세요.
─────────────────────────────────────
※ 면책 조항: 모든 트레이딩 도구와 마찬가지로, Institutional Smart Money Detector는 보조 지표로 사용해야 하며 트레이딩 결정을 전적으로 의존해서는 안 됩니다. 과거의 기관 행동 패턴이 미래 시장 움직임을 보장하지는 않습니다. 항상 적절한 리스크 관리 전략을 트레이딩에 활용하세요.

Automated Scalping Signals with TP/SL Indicator [QuantAlgo]🟢 Overview
The Automated Scalping Signals with Take Profit & Stop Loss Indicator is a multi-timeframe trading system that combines market structure analysis with directional bias filtering to identify potential scalping opportunities. It detects Points of Interest (POI) including Fair Value Gaps (FVG) and Order Blocks (OB) while cross-referencing entries with higher timeframe exponential moving average positioning to create systematic entry conditions.
The indicator features adaptive timeframe calculations that automatically scale analysis periods based on your chart timeframe, maintaining consistent analytical relationships across different trading sessions. It provides integrated trade management with stop loss calculation methods, configurable risk-reward ratios, and real-time performance tracking through dashboard displays showing trade statistics, bias direction, and active position status.
This advanced system is designed for low timeframe trading, typically performing optimally on 1 to 15-minute charts across popular instruments such as OANDA:XAUUSD , CME_MINI:MES1! , CME_MINI:ES1! , CME_MINI:MNQ1! , CBOT_MINI:YM1! , CBOT_MINI:MYM1! , BYBIT:BTCUSDT.P , BYBIT:ETHUSDT.P , or any asset and timeframe of your preference.
🟢 How It Works
The indicator operates using a dual-timeframe mathematical framework where higher timeframe exponential moving averages establish directional bias through cross-over analysis, while simultaneously scanning for specific market structure patterns on the POI timeframe. The timeframe calculation engine uses multiplication factors to determine analysis periods, ensuring the bias timeframe provides trend context while the POI timeframe captures structural formations.
The structural analysis begins with FVG detection, which systematically scans price action to identify imbalances where gaps exist between consecutive candle ranges with no overlapping wicks. When such gaps are detected, the algorithm measures their size against minimum thresholds to filter out insignificant formations. Concurrently, OB recognition analyzes three-candle sequences, examining specific open/close relationships that indicate potential institutional accumulation zones. Once these structural patterns are identified, the algorithm cross-references them against the higher timeframe bias direction, creating a validation filter that only permits entries aligned with the prevailing EMA cross-over state. When price subsequently intersects these validated POI zones, entry signals generate with the system calculating entry levels at zone midpoints, then applying the selected stop loss methodology combined with the configured risk-reward ratio to determine take profit placement.
To mirror realistic trading conditions, the indicator incorporates configurable slippage calculations that account for execution differences between intended and actual fill prices. When trades reach their take profit or stop loss levels, the algorithm applies slippage adjustments that worsen the exit prices in a conservative manner - reducing take profit fills and increasing stop loss impact. This approach ensures backtesting results reflect more realistic performance expectations by accounting for spread costs, market volatility during execution, and liquidity constraints that occur in live trading environments.
It also has a performance dashboard that continuously tracks and displays comprehensive trading metrics:
1/ Bias TF / POI TF: Displays the calculated timeframes used for bias analysis and POI detection, showing the actual periods (e.g., "15m / 5m") that result from the multiplier settings to confirm proper adaptive timeframe selection
2/ Bias Direction: Shows current market trend assessment (Bullish, Bearish, or Sideways) derived from EMA cross-over analysis to indicate which trade directions align with prevailing momentum
3/ Data Processing: Indicates how many price bars have been analyzed by the system, helping users verify if complete historical data has been processed for comprehensive strategy validation
4/ Total Trades: Displays the cumulative number of completed trades plus any active positions, providing volume assessment for statistical significance of other metrics
5/ Wins/Losses: Shows the raw count of profitable versus unprofitable trades, offering immediate insight into strategy effectiveness frequency
6/ Win Rate: Reveals the percentage of successful trades, where values above 50% generally indicate effective entry timing and values below suggest strategy refinement needs
7/ Total R-Multiple: Displays cumulative risk-reward performance across all trades, with positive values demonstrating profitable system operation and negative values indicating net losses requiring analysis
8/ Average R Win/Loss: Shows average risk-reward ratios for winning and losing trades separately, where winning averages approaching the configured take profit ratio indicate minimal slippage impact while losing averages near -1.0 suggest effective stop loss execution
9/ TP Ratio / Slippage: Displays the configured take profit ratio and slippage settings with calculated performance impact, showing how execution costs affect actual versus theoretical returns
10/ Profit Factor: Calculates the ratio of total winning amounts to total losing amounts, where values above 1.5 suggest robust profitability, values between 1.0-1.5 indicate modest success, and values below 1.0 show net losses
11/ Maximum Drawdown: Tracks the largest peak-to-trough decline in R-multiple terms, with smaller negative values indicating better capital preservation and risk control during losing streaks
🟢 How to Use
Start by applying the indicator to your chart and observe its performance across different market conditions to understand how it identifies bias direction and POI formations. Then navigate to the settings panel to configure the Bias Timeframe Multiplier for trend context sensitivity and POI Timeframe Multiplier for structural analysis frequency according to your trading preference and objectives.
Next, fine-tune the EMA periods in Bias Settings to control trend detection sensitivity and select your preferred POI types based on your analytical preference. Proceed to configure your Risk Management approach by selecting from the available stop loss calculation methods and setting the Take Profit ratio that aligns with your risk tolerance and profit objectives. Complete the setup by customizing Display Settings to control table visibility and trade visualization elements, adjusting UI positioning and colors for optimal chart readability, then activate Alert Conditions for automated notifications on trade entries, exits, and bias direction changes to support systematic trade management.
🟢 Examples
OANDA:XAUUSD
CME_MINI:MES1!
CME_MINI:ES1!
CME_MINI:MNQ1!
CBOT_MINI:YM1!
BYBIT:BTCUSDT.P
BINANCE:SOLUSD
*Disclaimer: Past performance is not indicative of future results. None of our statements, claims, or signals from our indicators are intended to be financial advice. All trading involves substantial risk of loss, not just upside potential. Users are highly recommended to carefully consider their financial situation and risk tolerance before trading.

KST Strategy [Skyrexio]Overview
KST Strategy leverages Know Sure Thing (KST) indicator in conjunction with the Williams Alligator and Moving average to obtain the high probability setups. KST is used for for having the high probability to enter in the direction of a current trend when momentum is rising, Alligator is used as a short term trend filter, while Moving average approximates the long term trend and allows trades only in its direction. Also strategy has the additional optional filter on Choppiness Index which does not allow trades if market is choppy, above the user-specified threshold. Strategy has the user specified take profit and stop-loss numbers, but multiplied by Average True Range (ATR) value on the moment when trade is open. The strategy opens only long trades.
Unique Features
ATR based stop-loss and take profit. Instead of fixed take profit and stop-loss percentage strategy utilizes user chosen numbers multiplied by ATR for its calculation.
Configurable Trading Periods. Users can tailor the strategy to specific market windows, adapting to different market conditions.
Optional Choppiness Index filter. Strategy allows to choose if it will use the filter trades with Choppiness Index and set up its threshold.
Methodology
The strategy opens long trade when the following price met the conditions:
Close price is above the Alligator's jaw line
Close price is above the filtering Moving average
KST line of Know Sure Thing indicator shall cross over its signal line (details in justification of methodology)
If the Choppiness Index filter is enabled its value shall be less than user defined threshold
When the long trade is executed algorithm defines the stop-loss level as the low minus user defined number, multiplied by ATR at the trade open candle. Also it defines take profit with close price plus user defined number, multiplied by ATR at the trade open candle. While trade is in progress, if high price on any candle above the calculated take profit level or low price is below the calculated stop loss level, trade is closed.
Strategy settings
In the inputs window user can setup the following strategy settings:
ATR Stop Loss (by default = 1.5, number of ATRs to calculate stop-loss level)
ATR Take Profit (by default = 3.5, number of ATRs to calculate take profit level)
Filter MA Type (by default = Least Squares MA, type of moving average which is used for filter MA)
Filter MA Length (by default = 200, length for filter MA calculation)
Enable Choppiness Index Filter (by default = true, setting to choose the optional filtering using Choppiness index)
Choppiness Index Threshold (by default = 50, Choppiness Index threshold, its value shall be below it to allow trades execution)
Choppiness Index Length (by default = 14, length used in Choppiness index calculation)
KST ROC Length #1 (by default = 10, value used in KST indicator calculation, more information in Justification of Methodology)
KST ROC Length #2 (by default = 15, value used in KST indicator calculation, more information in Justification of Methodology)
KST ROC Length #3 (by default = 20, value used in KST indicator calculation, more information in Justification of Methodology)
KST ROC Length #4 (by default = 30, value used in KST indicator calculation, more information in Justification of Methodology)
KST SMA Length #1 (by default = 10, value used in KST indicator calculation, more information in Justification of Methodology)
KST SMA Length #2 (by default = 10, value used in KST indicator calculation, more information in Justification of Methodology)
KST SMA Length #3 (by default = 10, value used in KST indicator calculation, more information in Justification of Methodology)
KST SMA Length #4 (by default = 15, value used in KST indicator calculation, more information in Justification of Methodology)
KST Signal Line Length (by default = 10, value used in KST indicator calculation, more information in Justification of Methodology)
User can choose the optimal parameters during backtesting on certain price chart.
Justification of Methodology
Before understanding why this particular combination of indicator has been chosen let's briefly explain what is KST, Williams Alligator, Moving Average, ATR and Choppiness Index.
The KST (Know Sure Thing) is a momentum oscillator developed by Martin Pring. It combines multiple Rate of Change (ROC) values, smoothed over different timeframes, to identify trend direction and momentum strength. First of all, what is ROC? ROC (Rate of Change) is a momentum indicator that measures the percentage change in price between the current price and the price a set number of periods ago.
ROC = 100 * (Current Price - Price N Periods Ago) / Price N Periods Ago
In our case N is the KST ROC Length inputs from settings, here we will calculate 4 different ROCs to obtain KST value:
KST = ROC1_smooth × 1 + ROC2_smooth × 2 + ROC3_smooth × 3 + ROC4_smooth × 4
ROC1 = ROC(close, KST ROC Length #1), smoothed by KST SMA Length #1,
ROC2 = ROC(close, KST ROC Length #2), smoothed by KST SMA Length #2,
ROC3 = ROC(close, KST ROC Length #3), smoothed by KST SMA Length #3,
ROC4 = ROC(close, KST ROC Length #4), smoothed by KST SMA Length #4
Also for this indicator the signal line is calculated:
Signal = SMA(KST, KST Signal Line Length)
When the KST line rises, it indicates increasing momentum and suggests that an upward trend may be developing. Conversely, when the KST line declines, it reflects weakening momentum and a potential downward trend. A crossover of the KST line above its signal line is considered a buy signal, while a crossover below the signal line is viewed as a sell signal. If the KST stays above zero, it indicates overall bullish momentum; if it remains below zero, it points to bearish momentum. The KST indicator smooths momentum across multiple timeframes, helping to reduce noise and provide clearer signals for medium- to long-term trends.
Next, let’s discuss the short-term trend filter, which combines the Williams Alligator and Williams Fractals. Williams Alligator
Developed by Bill Williams, the Alligator is a technical indicator that identifies trends and potential market reversals. It consists of three smoothed moving averages:
Jaw (Blue Line): The slowest of the three, based on a 13-period smoothed moving average shifted 8 bars ahead.
Teeth (Red Line): The medium-speed line, derived from an 8-period smoothed moving average shifted 5 bars forward.
Lips (Green Line): The fastest line, calculated using a 5-period smoothed moving average shifted 3 bars forward.
When the lines diverge and align in order, the "Alligator" is "awake," signaling a strong trend. When the lines overlap or intertwine, the "Alligator" is "asleep," indicating a range-bound or sideways market. This indicator helps traders determine when to enter or avoid trades.
The next indicator is Moving Average. It has a lot of different types which can be chosen to filter trades and the Least Squares MA is used by default settings. Let's briefly explain what is it.
The Least Squares Moving Average (LSMA) — also known as Linear Regression Moving Average — is a trend-following indicator that uses the least squares method to fit a straight line to the price data over a given period, then plots the value of that line at the most recent point. It draws the best-fitting straight line through the past N prices (using linear regression), and then takes the endpoint of that line as the value of the moving average for that bar. The LSMA aims to reduce lag and highlight the current trend more accurately than traditional moving averages like SMA or EMA.
Key Features:
It reacts faster to price changes than most moving averages.
It is smoother and less noisy than short-term EMAs.
It can be used to identify trend direction, momentum, and potential reversal points.
ATR (Average True Range) is a volatility indicator that measures how much an asset typically moves during a given period. It was introduced by J. Welles Wilder and is widely used to assess market volatility, not direction.
To calculate it first of all we need to get True Range (TR), this is the greatest value among:
High - Low
abs(High - Previous Close)
abs(Low - Previous Close)
ATR = MA(TR, n) , where n is number of periods for moving average, in our case equals 14.
ATR shows how much an asset moves on average per candle/bar. A higher ATR means more volatility; a lower ATR means a calmer market.
The Choppiness Index is a technical indicator that quantifies whether the market is trending or choppy (sideways). It doesn't indicate trend direction — only the strength or weakness of a trend. Higher Choppiness Index usually approximates the sideways market, while its low value tells us that there is a high probability of a trend.
Choppiness Index = 100 × log10(ΣATR(n) / (MaxHigh(n) - MinLow(n))) / log10(n)
where:
ΣATR(n) = sum of the Average True Range over n periods
MaxHigh(n) = highest high over n periods
MinLow(n) = lowest low over n periods
log10 = base-10 logarithm
Now let's understand how these indicators work in conjunction and why they were chosen for this strategy. KST indicator approximates current momentum, when it is rising and KST line crosses over the signal line there is high probability that short term trend is reversing to the upside and strategy allows to take part in this potential move. Alligator's jaw (blue) line is used as an approximation of a short term trend, taking trades only above it we want to avoid trading against trend to increase probability that long trade is going to be winning.
Almost the same for Moving Average, but it approximates the long term trend, this is just the additional filter. If we trade in the direction of the long term trend we increase probability that higher risk to reward trade will hit the take profit. Choppiness index is the optional filter, but if it turned on it is used for approximating if now market is in sideways or in trend. On the range bounded market the potential moves are restricted. We want to decrease probability opening trades in such condition avoiding trades if this index is above threshold value.
When trade is open script sets the stop loss and take profit targets. ATR approximates the current volatility, so we can make a decision when to exit a trade based on current market condition, it can increase the probability that strategy will avoid the excessive stop loss hits, but anyway user can setup how many ATRs to use as a stop loss and take profit target. As was said in the Methodology stop loss level is obtained by subtracting number of ATRs from trade opening candle low, while take profit by adding to this candle's close.
Backtest Results
Operating window: Date range of backtests is 2023.01.01 - 2025.05.01. It is chosen to let the strategy to close all opened positions.
Commission and Slippage: Includes a standard Binance commission of 0.1% and accounts for possible slippage over 5 ticks.
Initial capital: 10000 USDT
Percent of capital used in every trade: 60%
Maximum Single Position Loss: -5.53%
Maximum Single Profit: +8.35%
Net Profit: +5175.20 USDT (+51.75%)
Total Trades: 120 (56.67% win rate)
Profit Factor: 1.747
Maximum Accumulated Loss: 1039.89 USDT (-9.1%)
Average Profit per Trade: 43.13 USDT (+0.6%)
Average Trade Duration: 27 hours
These results are obtained with realistic parameters representing trading conditions observed at major exchanges such as Binance and with realistic trading portfolio usage parameters.
How to Use
Add the script to favorites for easy access.
Apply to the desired timeframe and chart (optimal performance observed on 1h BTC/USDT).
Configure settings using the dropdown choice list in the built-in menu.
Set up alerts to automate strategy positions through web hook with the text: {{strategy.order.alert_message}}
Disclaimer:
Educational and informational tool reflecting Skyrexio commitment to informed trading. Past performance does not guarantee future results. Test strategies in a simulated environment before live implementation.
