PTStratX Trial - Multi Period Tester for Profit Trailer 2PTStratX Trial - Multi Period Tester for Profit Trailer 2
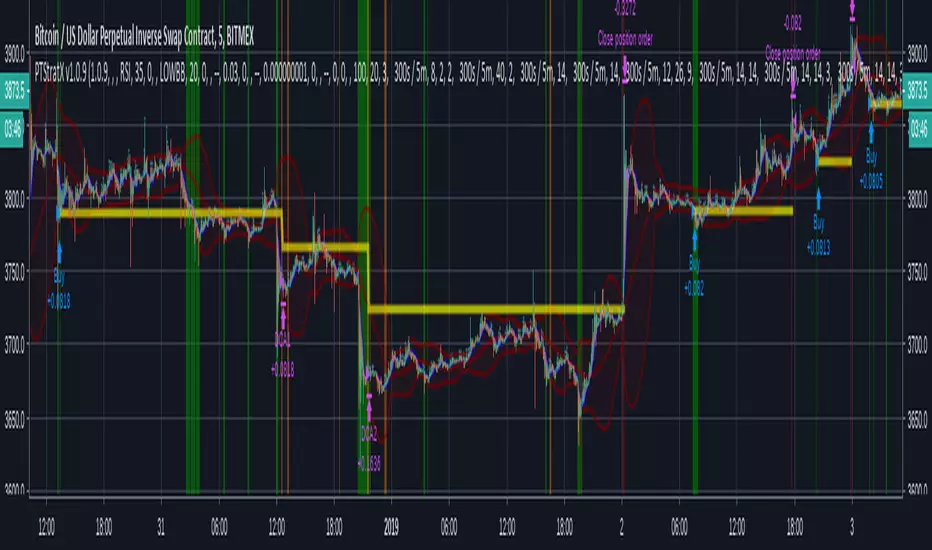
Profit Trailer 2 introduces trading with multiple indicators and indicator settings for Buy, DCA and Sell orders.
For the first time, it is possible to test and view up to 5 indicators in different time periods (1 min - 1 week) in one chart simultaneously!
Even experienced traders and chart analysts are facing difficulties now and struggle to create suitable strategies.
This script allows to find this "best" strategy with ease, learn about the indicators, visually verify your best strategy and finally run backtests (simulation) with historical data.
You immediately see if the strategy is good for profitable trades and then can test it by using the strategy tester in TradingView to find out how lucrative it would have been.
You find a list of all features here: ptstratx.com
Attention: This is the free trial version of PTStratX. It gives you an idea of the functionality of the full featured script. Please note, this trial version is restricted to BTC/USD within 30min resolution and a timeframe from April 10th to 12th, 2018, any other parameters will show no results.
Go to for the full featured version.
For further information on the full version of PTStratX, please visit ptstratx.com.
DISCLAIMER
The creators of this script are not financial advisors, and as such, this script is no financial advice. Anything seen or used within this script is here simply for educational purposes and it is up to you to decide what to do with this information and its results. Please do your own research and verify any statements made before deciding to act upon them. Do not commit any of your own resources to any trading or cryptocurrency activities without first verifying the accuracy of the information and know that your decisions are your own.
Cari dalam skrip untuk "profit"

PTStratX - Multi Period Tester for Profit Trailer 2PTStratX - Multi Period Tester for Profit Trailer 2
Profit Trailer 2 introduces trading with multiple indicators and indicator settings for Buy, DCA and Sell orders.
For the first time, it is possible to test and view up to 5 indicators in different time periods (1 min - 1 week) in one chart simultaneously!
Even experienced traders and chart analysts are facing difficulties now and struggle to create suitable strategies.
This script allows to find this "best" strategy with ease, learn about the indicators, visually verify your best strategy and finally run backtests (simulation) with historical data.
You immediately see if the strategy is good for profitable trades and then can test it by using the strategy tester in TradigView to find out how lucrative it would have been.
You find a list of all features here: ptstratx.com
For access to the full version of PTStratX, please visit ptstratx.com for further information.
DISCLAIMER
The creators of this script are not financial advisors, and as such, this script is no financial advice. Anything seen or used within this script is here simply for educational purposes and it is up to you to decide what to do with this information and its results. Please do your own research and verify any statements made before deciding to act upon them. Do not commit any of your own resources to any trading or cryptocurrency activities without first verifying the accuracy of the information and know that your decisions are your own.
SMACROSS for ProfitTrailer by BotIndicatorsThis is a highly adjustable indicator for the ProfitTrailer Crypto Currency Trading Bot.
You can use it to visualize the SMACROSS buy strategy. Here is how it works:
Set the candle size by setting your TV candle time accordingly
Set the candles used for Slow and Fast SMA Lines in the settings of this Indicator
Set the cross candles according to your needs.
Also set the buy value you would like to use on your bot to visualize the buy zones. You can set it either positive or negative.
The indicator will then show the Fast SMA, Slow SMA as well as the areas where the actual price exceeds the buy value you have set and would generate a buy signal for Profit Trailer. Please keep in mind that Profit Trailer may still use trailing buy and trailing profit to optimize your buy/sell situation, this can obviously not be shown through this indicator.
Note: This is a first public release, future modifications may follow and are then shown on this site as updates. Always read this page to the end.

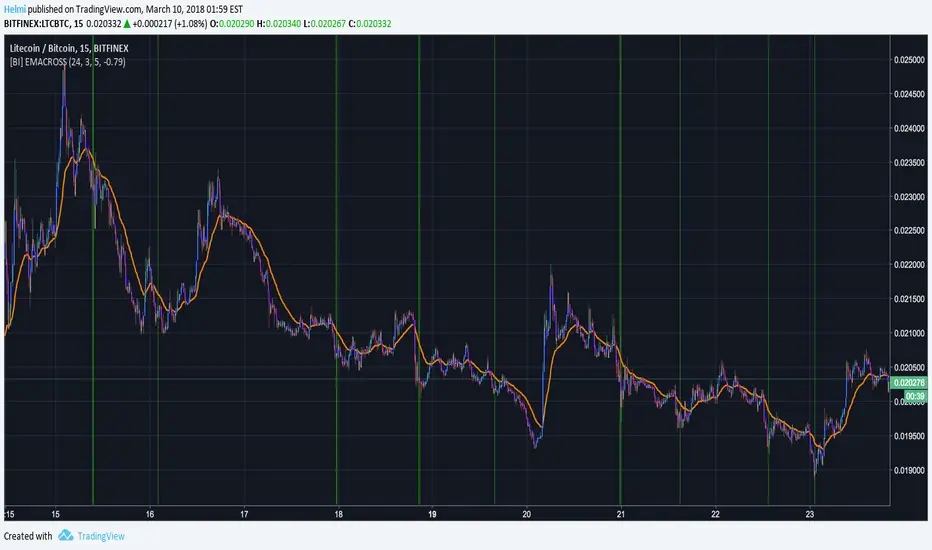
EMACROSS for ProfitTrailer by BotIndicatorsThis is a highly adjustable indicator for the ProfitTrailer Crypto Currency Trading Bot.
You can use it to visualize the EMACROSS buy strategy. Here is how it works:
Set the candle size by setting your TV candle time accordingly
Set the candles used for Slow and Fast EMA Lines in the settings of this Indicator
Set the cross candles according to your needs.
Also set the buy value you would like to use on your bot to visualize the buy zones. You can set it either positive or negative.
The indicator will then show the Fast EMA, Slow EMA as well as the areas where the actual price exceeds the buy value you have set and would generate a buy signal for Profit Trailer. Please keep in mind that Profit Trailer may still use trailing buy and trailing profit to optimize your buy/sell situation, this can obviously not be shown through this indicator.
Note: This is a first public release, future modifications may follow and are then shown on this site as updates. Always read this page to the end.
OBV for ProfitTrailer by BotIndicatorsThis is a highly adjustable indicator for the ProfitTrailer Crypto Currency Trading Bot.
It showcases a special version of OBV how it is calculated by ProfitTrailer. Due to the limitations in how ProfitTrailer works this does not reflect the values of a classical OBV.
Important note: Due to differences in price update you won't be able to compare the live values calculated by the Bot and the ones on Tradingview. They will likely differ a lot due to different update cycles. We are trying to improve this in the future but we don't know if it cand be handled any better.
Note: This is a first public release, future modifications may follow and are then shown here as updates. Always read this page to the end.

EMAGAIN for Profit Trailer by BotIndicatorsThis is a highly adjustable indicator for the ProfitTrailer Crypto Currency Trading Bot.
You can use it to visualize the EMAGAIN buy strategy. Here is how it works:
Set the candle size by setting your TV candle time accordingly
Set the candles used for Slow and Fast EMA Lines in the settings of this Indicator
Also set the buy value you would like to use on your bot to visualize the buy zones. You can set it either positive or negative.
The indicator will then show the Fast EMA, Slow EMA as well as the the areas where the actual price exceeds the buy value you have set and would generate a buy signal for Profit Trailer. Please keep in mind that Profit Trailer may still use trailing buy and trailing profit to optimize your buy/sell situation, this can obviously not be shown through this indicator.
Note: This is a first public release, future modifications may follow and are then shown on this site as updates. Always read this page to the end.

SMASPREAD for Profit Trailer by BotIndicatorsThis is a highly adjustable indicator for the ProfitTrailer Crypto Currency Trading Bot.
You can use it to visualize the SMASPREAD buy strategy. Here is how it works:
Set the candle size by setting your TV candle time accordingly
Set the candles used for Slow and Fast SMA Lines in the settings of this Indicator
Also set the buy value you would like to use on your bot to visualize the buy zones. You can set it either positive or negative.
The indicator will then show the Fast SMA, Slow SMA as well as the the areas where the actual price exceeds the buy value you have set and would generate a buy signal for Profit Trailer. Please keep in mind that Profit Trailer may still use trailing buy and trailing profit to optimize your buy/sell situation, this can obviously not be shown through this indicator.
Note: This is a first public release, future modifications may follow and are then shown on this site as updates. Always read this page to the end.

LOWBB and HIGHBB for Profit Trailer by BotIndicatorsThis is a highly adjustable indicator for the ProfitTrailer Crypto Currency Trading Bot.
You can use it to visualize the LOWBB and HIGHBB buy/sell strategy. Here is how it works:
Set the candle size by setting your TV candle time accordingly
Set the amount of candles used for the Bollinger Band in the settings of this indicator
Also set the buy/sell value used and select your choice of either LOWBB or HIGHBB
The indicator will then show your offset line from either the high (HIGHBB) or low (LOWBB) Bollinger Band border and it will also mark the areas where the actual price exceeds this value and would generate a buy (or sell) signal for Profit Trailer. Please keep in mind that Profit Trailer may still use trailing buy and trailing profit to optimize your buy/sell situation, this can obviously not be shown through this indicator.
Note: This is a first public release, future modifications may follow and are then shown on this site as updates. Always read this page to the end.
→ For Feedback and Updates as well as Help on how to work with this indicator, please visit this Website:

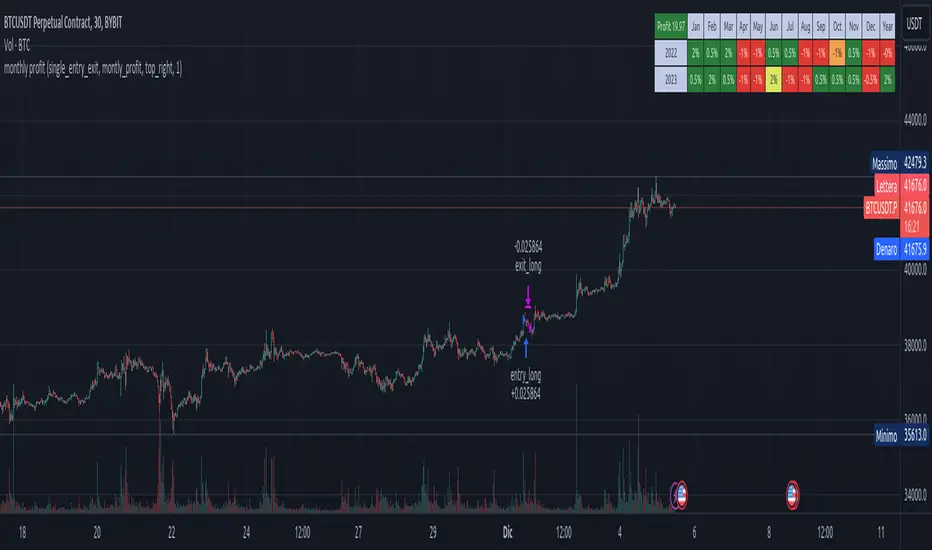
Stx Monthly Trades ProfitMonthly profit displays profits in a grid and allows you to know the gain related to the investment during each month.
The profit could be computed in terms of gain/trade_cost or as percentage of equity update.
Settings:
- Profit: Monthly profit percentage or percentage of equity
- Table position
This strategy is intended only as a container for the code and for testing the script of the profit table.
Setting of strategy allows to select the test case for this snippet (percentage grid).
Money management: not relevant as strategy is a test case.
This script stand out as take in account the gain of each trade in relation to the capital invested in each trade. For example consider the following scenario:
Capital of 1000$ and we invest a fixed amount of 1000$ (I know is too risky but is a good example), we gain 10% every month.
After 10 months our capital is of 2000$ and our strategy is perfect as we have the same performance every month.
Instead, evaluating the percentage of equity we have 10% the first month, 9.9% the second (1200$/1100$ - 1) and 5.26% the tenth month. So seems that strategy degrade with times but this is not true.
For this reason, to evaluate my strategy I prefer to see the montly return of investment.
WARNING: The strategy provided with this script is only a test case and allows to see the behavior with different "trades" management, for these reason commision are set to zero.
At the moment only the provided test cases are handled:
test 1 - single entry and single exit;
test 2 - single entry and multiple exits;
test 3 - single entry and switch position;
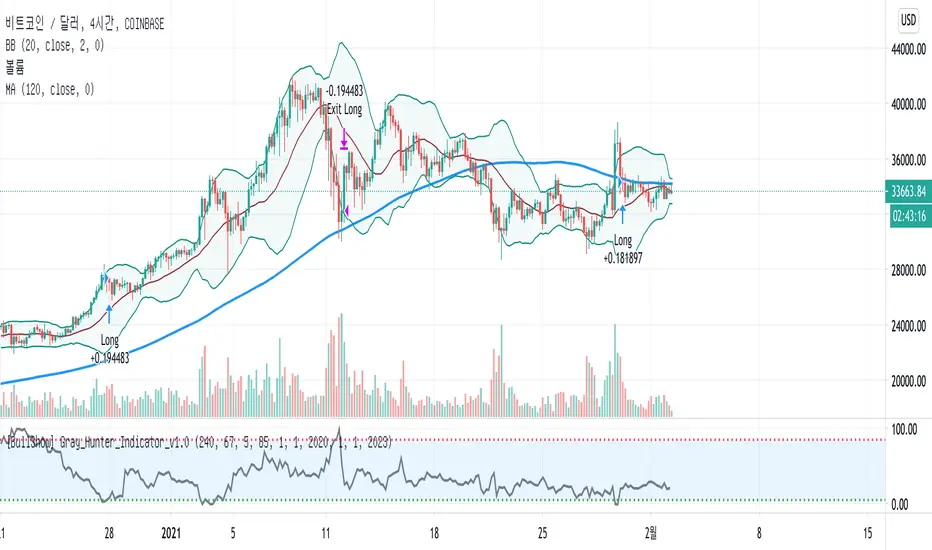
[BullShow] Gray_Hunter_Indicator_v1.0 - Legendary ProfitOver the past 10 years, the price of Bitcoin and cryptocurrency has been dominated by miners. However, since the coronavirus, as the money supply of each government increases and the value of the money decreases accordingly, institutional investors are increasingly intervening in the price of bitcoin. In particular, it is no exaggeration to say that the rise of Bitcoin in recent years was led by institutional investors.
Accordingly, in the past, the indicator of HashRate or Profitability of Mining was an important index for cryptocurrency investment, but now is the time to examine the investment movement of institutions.
This idea is an idea to follow the movement of institutional investors.
I created an index based on the correlation and disparity between the price of institutional investors and the price of bitcoin.
Accuracy increases after the corona, when institutional investors start buying in earnest.
There is no repainting on the chart.
If you are interested in my strategy, Use the link below to obtain access to this indicator or PM me to obtain access
Indicators are shared only with supporters.
Bless you and thanks all!
지난 10년동안 비트코인 및 암호화폐의 가격은 채굴자에 의해 좌지우지 되어 왔습니다. 그러나 코로나바이러스 이후 각 정부의 화폐 공급이 많아지고 그에 따라 화폐가치가 하락하면서 기관투자자의 개입이 조금씩 많아지고 있는 상황입니다. 특히 2020년 최근들어 비트코인의 상승은 기관투자자가 이끌었다고 해도 과언이 아닙니다.
이에따라 과거에는 HashRate 또는 Profitability of Mining의 지표가 암호화폐 투자에 있어서 큰 index였지만 이제는 기관의 투자동향을 보다 더 살펴야 할 때입니다.
그래서 오늘 소개 해 드리고 싶은 전략은 기관의 움직임을 추종하는 전략입니다.
기관투자자들의 매수가격과 비트코인가격의 상관관계 및 이격도를 가지고 지표를 만들었습니다.
기관 투자자들이 본격적으로 매수를 시작하는 코로나 이후 부터 정확도가 증가합니다.
차트에 리페인팅은 없습니다.
Indicator의 공유는 Supporter 분들에게만 해 드리고 있습니다.
축복합니다 언제나 승리하세요!
Indicator Information
* Indicator is only working on the time frame (not support D,W,M and Seconds)
* Initial indicator sets under 1 to buy, over 85 sell
* The accuracy and reliability of indicators rise sharply from 2020, From the point when institutional market intervention increases rapidly
* Other altcoins buy and sell at the same time frame as Bitcoin.
* 해당 인디케이터는 시간 범위에서만 작동합니다 (D, W, M 및 초는 지원하지 않음).
* 초기 지표셋팅은 1아래에서 매수, 85 이상에서 매도
* 지표의 정확성과 신뢰성은 기관의 시장 개입이 급격히 증가하는 2020 년부터 급격히 증가합니다.
* 다른 알트 코인은 비트 코인과 동시에 매매합니다.
Back Testing
Back testing start from 2020. 01 . 01
Initial_capital: 1000
percent_of_equity: 100%
Commission: 0.2%
Profit
BTCUSDT: 559.12%
ETHUSDT: 1675.08%
XRPUSDT: 1121.74%
XLMUSDT: 1003.23%
LINKUSDT: 2087.28%
LTCUSDT: 781.35%
BCHUSDT: 310.89%
BNBUSDT: 706.14%
XMRUSDT: 667.08%
DASHUSDT: 570.35%
TRXUSDT: 796.54%
ADAUSDT: 1352.74%
CIVICUSDT: 3259.17%
IOTAUSDT: 935.22%
WAVESUSDT: 4187.95%
BEST Trailing Take Profit StrategyHello traders
Hope you enjoyed your weekend on my behalf. Was staying home working ... ^^
This is my first strategy educational post I'm doing ever
While I'm generally against posting strategies because it's very easy to fake performance numbers... I cannot prevent myself from sharing a few cool strategy snippets anyway.
So from now on, I'll be sharing a few strategies also - generally not to showcase performance but only to show what pinescript can do.
As once again strategy performance can be faked is so many ways... :)
What's on the menu?
We all know what a trailing-stop is. right? right? Ok... sharing the definition here :)
A trailing stop is designed to protect gains by enabling a trade to remain open and continue to profit as long as the price is moving in the investor's favor. The order closes the trade if the price changes direction by a specified percentage or dollar amount.
But...do you know what a trailing profit is?
Short definition : Well the same but with your profit limit order.
Long definition : A trailing profit is designed to increase your gains by enabling a trade to remain open and continue to profit as long as the price is moving in the investor's favor. The order closes the trade if the price hits the trailing profit level specified percentage or dollar amount.
Some trading strategies used both a trailing stop AND trailing profit. Not making any recommendation here - only sharing what's possible in the realm of trading and pinescripting
Trigger me I'm famous
I developed many trading strategies in my career and often I've been asked to trigger a trailing-stop or trailing-profit once a certain % move has been made.
I integrated here a Take Profit trigger - once hit, it will activate the trailing profit
On the screenshot below, the TP trigger is plotted in orange. Once the price goes past that level for the first time, I'll start trailing the profit level.
In other words, when we see a price makes an interesting move in percentage value - we decide to offset the profit as we concluded that once it reached such distance - then it leads often to more profit
Of course, using only a trailing profit without stop/trailing-stop/invalidation isn't smart and the surest way to kiss goodbye a trading capital and trading and your good mood
See you tomorrow for another strategy snippet
All the BEST
Dave

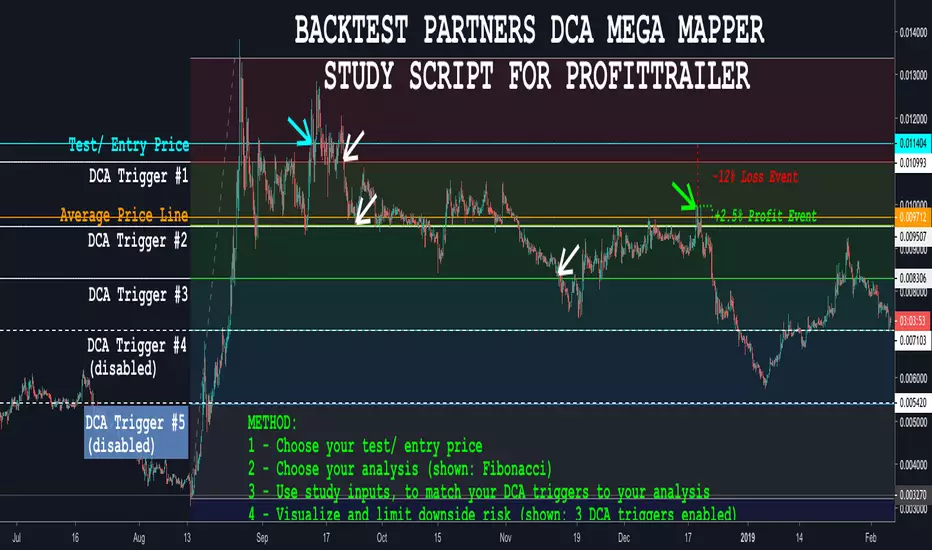
BACKTEST PARTNERS DCA MEGA MAPPER STUDY SCRIPT FOR PROFITTRAILERBacktest Partners Mega Mapper (BPMM) is an advanced DCA analysis script, allowing cryptocurrency traders to sync their ProfitTrailer trading bot buy levels, triggers and order sizes with their technical analysis charting results in TradingView.
For a complete functional demo, and to learn more about subscribing to this invite-only script, please visit us at backtest.partners
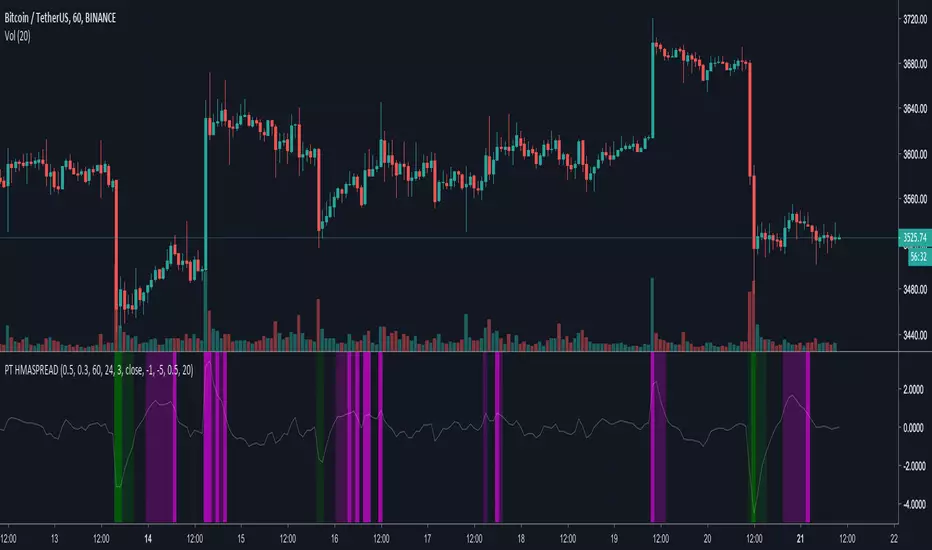
[ProfitTrailer] HMASPREAD Buy/Sell studyProfitTrailer buy/sell study for HMASPREAD strategy.
The script highlights the region where trailing is most likely to succeed.
PTStratX Beta - Multi Period Tester for Profit Trailer 2PTStratX Beta - Multi Period Tester for Profit Trailer 2
This is our official beta release for our supporters to test new features.
You can find the full version here:
Changelog v1.0.9a Beta
Added:
- STOCHRSID, STOCHRSIK and STOCHRSICROSS strategy, but not as accurate as our other indicators, we will work on that in the in the following updates
Changed:
- code optimizations to reduce compilation time

PTStratX Free - Multi Period Tester for Profit Trailer 2PTStratX Free Edition - Multi-Period Backtesting Tool for Profit Trailer 2!
PTStratX is free for everyone and can be used immediately without prior activation!
It is now free for everyone to create, test and optimize your own Buy, DCA and Sell strategies.
Look how your bot will perform with your strategy and optimize and enhance it with other indicators.
Now the time has come: PTStratX Free Edition is here!
More information about PTStratX Free and other scripts can be found at PTStratX.com
Have fun and discover the incredible possibilities of PTStratX!
If you like our work, we would be pleased about a donation.
BTC: 37ufrNH75U4btRGn23PEnZmqdhn1gmysbf

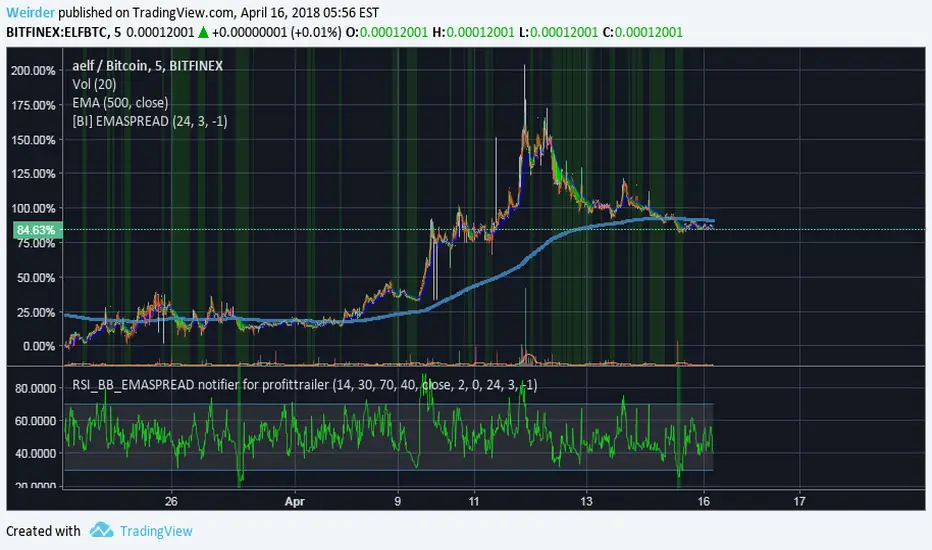
RSI_BB_EMASPREAD for profittrailer v2Script to assess the combination of RSI, BB & EMASPREAD triggers for profittrailer v2. The script also includes an alert mechanism, use it via the standard tradingview alerts.
Be mindful of being on the correct candle length. 5 minutes usually.
Let me know if you think something should be improved. Feedback is appreciated.
If I feel like it I might expand on it, let me know if it adds value for you.
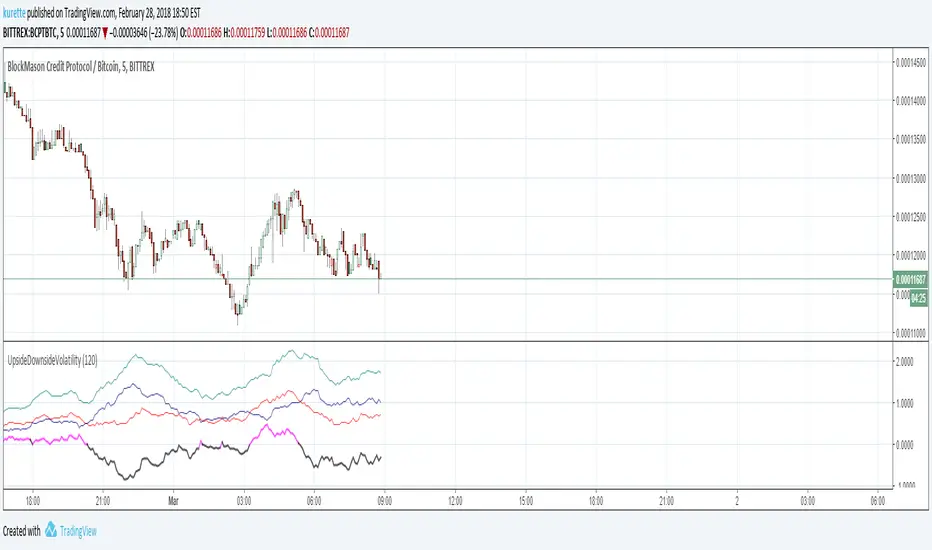
PTF_UpDownVolatility for Profit Trailer FeederThis indicator for Profit Trailer Feeder plots out the values for four different Offset Groups:
1) Upside Volatility - green line
2) Downside Volatility - red line
3) Average Candle Size - orange histogram
4) UpsideDownsideVolatilityDifference - orange histogram
The user can switch between viewing histogram as either Average Candle Size or UpsideDownsideVolatilityDifference

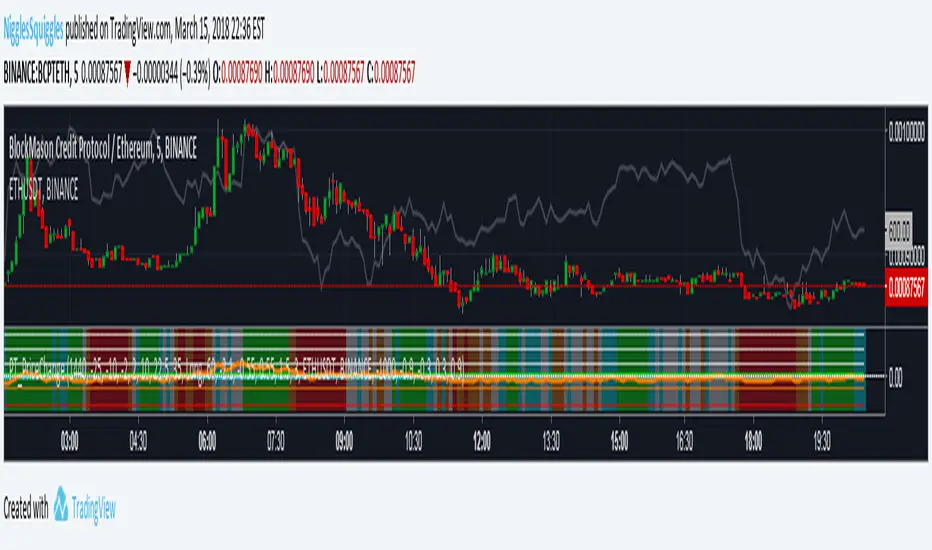
PTF_Short and Long Term Price Change for Profit Trailer FeederThis indicator plots out the short term or long term price trend change as used in Profit Trailer Feeder.
It also has an optional background colouring that indicates the base coin price trend for use with "MinBaseCoinPriceChange".
Each time window (long or short) has its own customisable levels, that the user can input their own values into.
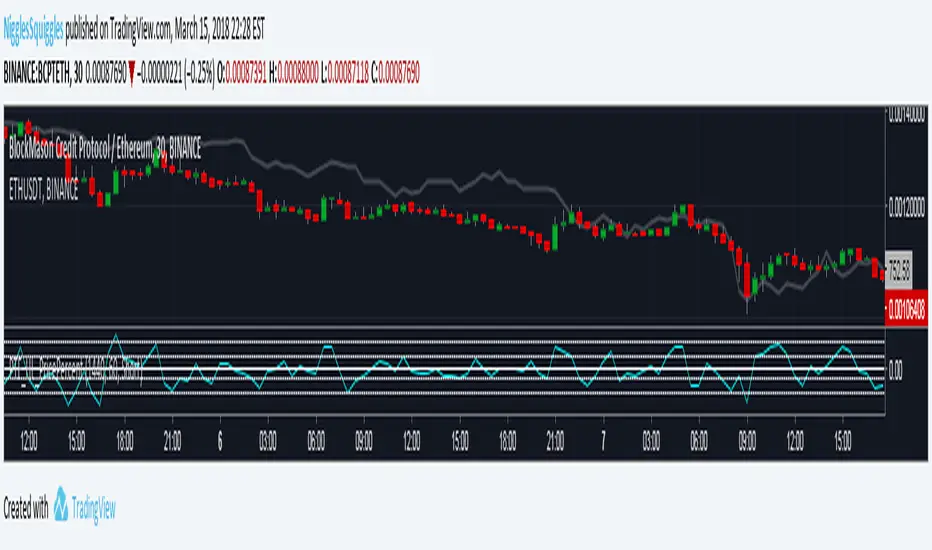
PTF_HighLowPricePercentage for Profit Trailer FeederThis indicator plots out the values for "HighLowPricePercentage" and "LongerTermHighLowPricePercentage" as used in Profit Trailer Feeder.
It has an option to switch from "MinutesToMeasureTrend" (Short) to "MinutesForLongerTermTrend" (Long).
Upside Downside Volatility of ProfitTrailer FeederThis is to calculate UpsideVolatility, DownsideVolatility, UpsideDownsideVolatilityDifference, and AverageCandlesize in offset group of ProfitTrailer Feeder.
Volatilities are average changes between open and high or between open and low of 5 miniue candles in designated time frame by MinutesToMeasureTrend which can be inputable in format of this script.
In other words, volatilites are SMAspread between open and high or between open and low prices.
As described in wiki, use this script in 5 minute candle chart.
This script is to help myself understand the criteria of Feeder.
Any comments and suggestions are welcome.
Low SMA of SMAgain over the chart for ProfitTrailerLow SMA of SMAgain over the chart for ProfitTrailer
This script prints low SMA line over the chart.
Buy value and time frame numbers can be modified in format.
Basically this is same with previous scripts of mine.
Though this does not show the spread between the price and low SMA line (SMAgain) and buy value, you can see the buy trailing signal.
If you set buy value positive for gain starategy, the buy trailing will start from the time point indicated by "▲".
If you set buy value negative for gain starategy, the buy trailing will start from the time point indicated by "▼".
This script is to help myself understand the buy strategies of ProfitTrailer.
Any comments and suggestions are welcome.

EMASPREAD Indicator for Profit TrailerThis is a graphical representation of the EMASPREAD strategy on Profit Trailer. Now Made Public
