[ProfitTrailer:Feeder] Stochastics Just like RSI the Stochastics Indicator is very often used in ProfitTrailer:Feeder and therefore I decides to create this script so people can easily test/tryout there specific inputs.
Note: Because there's a difference (in outcome) between the calculation function from TV and the traditional calculation (used by ProfitTrailer) I created an option to select the kind of calculation you prefer.
Enjoy!
Cari dalam skrip untuk "profit"

[ProfitTrailer:Feeder] RSIBecause RSI is so commonly used in creating strategies for ProfitTrailer:Feeder is decided to translate this indicator to PineCode so you can test your settings based on the variables PTF offers.
Please let me know what you think and if you consider this kind of content valuable please 'like & follow' me.
Enjoy and thanks in advance!

[ProfitTrailer:Feeder] High/Low % ChangeThis script was created to help people determine which HighLowPercentageChange settings work for them in the ProfitTrailer bot as well as set specific groupings in PTFeeder. For more in-depth knowledge on how it's calculated/works I would advice you to visit the ProfitTrailer and/or PtFeeder wiki pages. Massive thanks to NigglesSquiggles for creating the first version!
If you have any questions, please just let me know! Enjoy
[ProfitTrailer:Feeder] ATRThis script was created to help people determine which ATR settings work for them in the ProfitTrailer bot as well as set specific groupings in PTFeeder. For more in-depth knowledge on how it's calculated/works I would advice you to visit the ProfitTrailer and/or PtFeeder wiki pages.
If you have any questions, please just let me know! Enjoy

[PT] SMA Cross Buy/Sell studyProfitTrailer study for SMA Cross buy/sell strategies.
The script highlights the regions where trailing is most likely to succeed.

[ProfitTrailer] EMA Cross StudySupport buy/sell parameters for EMACROSS strategy.
The script highlights the regions where trailing is most likely to be successful.
[ProfitTrailer] Bollinger Bands HIGHBB/LOWBB StudyBollinger Bands study for ProfitTrailer.
Supports buy/sell parameters configuration for both LOWBB/HIGHBB strategies.
Highlights regions where trailing is most likely to be fulfilled and buy/sell order placed.


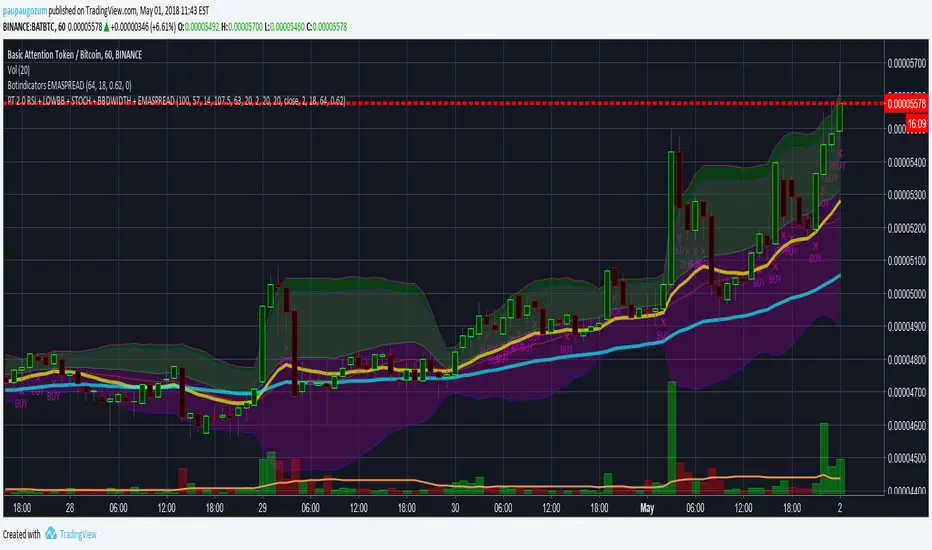
PT 2.0 RSI + LOWBB + STOCH + BBWIDTH + EMASPREADProfitTrailer 2.0 - Backtest for RSI + LOWBB + STOCH + BBWIDTH + EMASPREAD. Default settings are meant to buy up during a pump, but stops buying at the top of the pump. Optimized for 1-hour time frame. Adjust default values as you see fit for shorter timeframes.
**In the process of adding STOCH**
PT 2.0 RSI + LOWBB + EMAGAINProfit Trailer 2 RSI, LOWBB, EMAGAIN strategy for spotting better buys. Will be adding STOCH soon.
Please leave a PM for suggestions.

ProfitTrailer v2 EMAGAIN & RSI Buy SignalsUse this script to tweak and visualize your ProfitTrailer v2 EMAGAIN + RSI buy strategy. The indicator will show you when the bot will buy based on your inputs.
Inputs Available
- Fast & Slow EMA
- Buy value (0 to -10)
- Enable/Disable Buy Signals
- Enable/Disable RSI
- Set RSI Values
With this indicator you will see what a big difference RSI makes as supposed to just using EMAGAIN. I will incorporate sell signals shortly. Comments and suggestions welcome.

Profitable Loser Model [MMT]Profitable Loser Model
Overview
The Profitable Loser Model is a powerful PineScript v6 indicator designed to enhance your trading by visualizing key price levels, session open zones, Fibonacci retracements, and premium/discount zones. This overlay indicator provides traders with a customizable toolkit to analyze market structure across any timeframe, making it ideal for intraday and swing trading strategies.
Features
Open Zone Visualization
- Plots a box based on the open and close of the first candle in a user-defined timeframe (default: 5-minute).
- Customizable box color, projection offset, and label size (Tiny, Small, Normal, Large).
- Displays a timeframe label (e.g., "5m Open Zone") for quick reference, toggleable on/off.
Session Open Lines
- Optionally draws horizontal lines at key session opens (8:30 AM, 9:30 AM, 1:30 PM, Midnight, New York time).
- Customize line color, style (Solid, Dashed, Dotted), width, and label size for each session.
- Perfect for identifying critical intraday price levels.
Premium and Discount Zones
- Highlights premium (above midpoint) and discount (below midpoint) zones based on session high/low.
- Toggleable with customizable colors and projection offsets.
- Helps traders spot overbought/oversold areas for potential mean-reversion trades.
Fibonacci Retracement Levels
- Plots user-defined Fibonacci levels (default: 0.23, 0.35, 0.5, 0.62, 0.705, 0.79, 0.886, 1, 1.1).
- Customizable line style, width, color, and labels (showing percentage and/or price).
- Dynamically adjusts based on price movement relative to the open zone.
Take Profit (TP) and Stop Loss (SL) Levels
- Highlights TP (default: 0.23) and SL (default: 1.1) Fibonacci levels with distinct colors.
- Fully customizable to align with your risk-reward strategy.
How It Works
- Session Detection : Resets daily (or per user-defined timeframe) to capture the first candle's open, high, low, and close.
- Open Zone : Draws a box between the open and close, extended forward by the projection offset.
- Session Lines : Plots lines at specified session opens with customizable styles and labels.
- Fibonacci Retracement : Adjusts levels dynamically based on session high/low and price action.
- Premium/Discount Zones : Calculated from the session range midpoint, updated in real-time.
Settings
- Open Zone :
- Timeframe (default: 5m), Calculate Timeframe (default: Daily).
- Toggle label, adjust size, box color, and projection offset.
- Session Open Lines :
- Enable/disable lines for 8:30 AM, 9:30 AM, 1:30 PM, Midnight.
- Customize color, style, width, label size, and vertical offset.
- Premium/Discount Zones :
- Toggle visibility, set colors, and adjust projection offset.
- Fibonacci Retracement :
- Toggle visibility, set custom levels, line style, width, color, and label options.
- Adjust projection offset.
- TP/SL :
- Set TP/SL Fibonacci levels and colors.
Use Cases
- Intraday Trading : Use session open lines and open zones to trade key market hours.
- Swing Trading : Leverage Fibonacci levels for potential reversal or continuation zones.
- Risk Management : Set precise TP/SL levels based on Fibonacci retracements.
- Market Structure : Identify overbought/oversold zones with premium/discount areas.
Notes
- Optimized with `dynamic_requests = true` for efficient real-time data handling.
- Visual elements (boxes, lines, labels) are cleaned up at the start of each new session.
- Session lines use New York time (`America/New_York`) for alignment with major markets.

Profit Harvester System
(1) Strategy Introduction
- This is a profit harvesting system, an optimized high frequency trading strategy, by invitation only
- It can achieve a stable average annual return and is suitable for most crypto-currency markets
- It is recommended that the initial capital of one crypto-currency pair is greater than 2000 USDT
- You need to bear some floating loss, but don't worry, the strategy will stop profit and reduce positions automatically
- Support leverage from 1 to 5 times, but note that there is a strong leveling risk when leverage is greater than 1 times
- Support strategy alerts. You can add alerts at the top of the trading panel
(2) Parameters
- Indicator Resolution
- Min Resolution (Minutes) : The resolution of the indicator, i.e. the interval for updating the indicator, default 240 minutes
- MA Trending Line
- Draw Trending Line? : Draw trend lines to determine the long/short direction
- Moving Average Type : Type of moving average, default is SMA
- Moving Average Period : The period of the moving average, SMA30 by default
- Normalized On Balance Volume
- Draw Normalized On Balance Volume? : Plot the normalized OBV to show the volume/price relationship
- Moving Average Type : Type of moving average, default is EMA
- Moving Average Period : The period of the moving average, EMA21 by default
- Sigma of Normalized On Balance Volume : Upper and lower range of normalized OBV for determining the energy of the volume/price relationship
- Trading settings
- What Trades Should Be Taken? : The trading direction, supports long only, short only or no trade
- Maximum Shares of Position : The maximum number of shares of the position, i.e. the initial capital (default is 2000) is divided into that number of shares equally
- First Shares on Entrying Position : The number of shares occupied when entrying position to avoid missing the trend market
- Profit Ratio for Average Entry Price : Close all positions and cancel all orders when the current price exceeds the average position price and the profit rate is reached
- Increase Ratio for Next Share : Equal proportion of the order price when adding position
- Trading Leverage (Risk Term) : Trading leverage supports from 1 to 5 times, 2 by default. However, there is a strong leveling risk when the leverage is greater than 1!
- Max Floating Loss of Equity (Risk Term) : How much do you wanna risk. When the max floating loss threshold is reached, the position will be closed and all orders will be canceled!
- Price Trail Stop : Whether enable price trail stop mode to obtain more profits
(3) About usage
- This strategy is by invitation only. If you are interested in this strategy or would like to use it, please leave a message
- The default parameters is suitable for VETUSDT, MATICUSDT, ATOMUSDT, XRPUSDT and so on
- It is highly recommended to use long-only direction rather than short-only direction because the market will not go down forever
(4) Exceptions
- When "Increase Ratio for Next Share" is too small and "Maximum Shares of Position" is too large, there may be an error that the number of orders exceeds 9000, which is caused by the limitation of tradingview itself
Happy trading and enjoy your life!
————————————————————————————————————————
(1) 策略简介
- 这是一个利润收割系统,一种优化的高频交易策略,仅限受邀请使用
- 可以达到稳定的平均年化收益率,且适用于大部分数字货币市场
- 建议单个数字货币交易对的基础资金大于2000USDT,避免单笔交易资金低于最低交易资金限制
- 需要您承受一定的浮亏,但是不用担心,本策略会自动执行止盈和解套
- 支持1至5倍的杠杆,但是需要注意,杠杆大于1倍时存在爆仓风险
- 支持策略提醒,在交易面板上方添加策略提醒即可
(2) 参数说明
- Indicator Resolution
- Min Resolution (Minutes) : 指标的分辨率,即更新指标的间隔,默认240分钟更新1次
- MA Trending Line
- Draw Trending Line? : 是否需要绘制趋势线,用于判断多空方向
- Moving Average Type : 移动平均线的类型,默认为SMA
- Moving Average Period : 移动平均线的周期,默认为240分钟下的30日均线
- Normalized On Balance Volume
- Draw Normalized On Balance Volume? : 是否需要绘制归一化OBV指标,该指标反应量价关系
- Moving Average Type : 移动平均线的类型,默认为EMA
- Moving Average Period : 移动平均线的周期,默认为240分钟下的21日均线
- Sigma of Normalized On Balance Volume : 归一化OBV的上下区间,用于判断量价关系的能量
- Trading settings
- What Trades Should Be Taken? : 代表可以交易的方向,支持仅多头、仅空头或不交易
- Maximum Shares of Position : 仓位的最大份数,即将初始资金(默认为2000)等分为该份数的资金
- First Shares on Entrying Position : 当开仓后,首仓占用的份数,以避免错过趋势行情
- Profit Ratio for Average Entry Price : 当前价格大于仓位均价,并达到该收益率时,关闭所有仓位并取消所有挂单
- Increase Ratio for Next Share : 等比加仓的价格比例
- Trading Leverage (Risk Term) : 交易杠杆,支持1-5倍杠杆,默认为2倍杠杆,但是杠杆大于1倍时存在爆仓风险!
- Max Floating Loss of Equity (Risk Term) : 自开仓开始,您愿意承受的最大浮亏,当达到该浮亏后,仓位全平并取消所有订单!
- Price Trail Stop : 是否启用尾单止盈模式,以收割更多的利润
(3) 使用说明
- 该策略仅限受邀请使用,如果您对该策略感兴趣或者想要使用我的脚本,请给我留言
- 默认参数适用于 VETUSDT MATICUSDT ATOMUSDT XRPUSDT 等交易对
- 强烈建议使用多头交易而不是空头交易,因为市场不会永远下跌
(4) 异常情况
- 当"Increase Ratio for Next Share"设置过小而"Maximum Shares of Position"设置过大时,可能会出现订单数量超过9000的错误,这是tradingview本身的限制导致的
祝大家交易愉快

Profit Maximizer PMax Strategy - Long-ShortI developed a different strategy perspective for the Profit Maximizer PMax indicator prepared by Kıvanç Özbilgiç.
When you come to the settings section;
- You will see 2 options as Straregy Type. You can test the price and pmax intersections as different strategies.
- I added the Long-Short option for spot traders to calculate the profitability rate correctly. Spot traders should not choose this option.
Here you can set alarms on the original indicator with the parameters you find successful.
Türkçe:
Kıvanç Özbilgiç tarafından hazırlanan Profit Maximizer PMax indikatör için farklı bir strateji bakış açısı geliştirdim.
Ayarlar bölümüne geldiğinizde;
- Straregy Type olarak 2 seçenek göreceksiniz. Fiyat kesişimi ve pmax kesişimlerini, farklı stratejiler olarak test edebilirsiniz.
- Spot işlem yapanlar için karlılık oranını doğru hesaplayabilmeleri için Long-Short seçeneği ekledim. Spot işlem yapanların bu seçeneği seçmemeleri gerekmektedir.
Burada başarılı bulduğunuz parametreler ile orijinal indikatör üzerinde alarmlar kurabilirsiniz.

Moving Average profit targets with var sizeProfit target:
Profit targets are those scenarios where the system expects to be greater than the actual return at the end of the transaction: they may be short-term benefits, such as a favorable price shock model.
In short-term transactions, profit objectives are essential. Price fluctuations make any favorable event likely to turn around in an instant. Moreover, profit objectives are more difficult to integrate into the longer-term trading system, because they are afraid of losing larger profits at risk, so they will replace them with smaller but more frequent gains. As a follower of the trend, once you make a profit and stop earning, but the trend direction is still intact, you need to find a way to re-enter the transaction to avoid losing the rare but very large market situation.
Profit target is best calculated based on price volatility (V), and the most commonly used method:
For Long, the system buy point (E), needs to be multiplied by the average true volatility or annualized volatility :E+f×V.
The net value multiplier f used to calculate the profit level is usually obtained through data mining.

Profitable Moving Average CrossoverHi everyone!
Introduction
A popular use for moving averages is to develop simple trading systems based on moving average crossovers. A trading system using two moving averages would give a buy signal when the shorter (faster) moving average advances above the longer (slower) moving average. A sell signal would be given when the shorter moving average crosses below the longer moving average. The speed of the systems and the number of signals generated will depend on the length of the moving averages.
There are many types of averages that are based on different techniques. Each type has its drawbacks and merits. And if we decide to choose a certain type of average for the trading system, then how do we know that our choice is optimal?
What is this tool?
This tool will help you to choose this type to create the most profitable trading system based on crossovers for the specified periods. It backtests pairs of each type throughout the whole instrument's history and shows Net Profit curves as a result. So, the type of the most profitable crossover system will be at the top of list of labels on the chart. (Click on the price scale, point to "Labels" and switch off "No Overlapping Labels" option).
Settings
The main settings are periods for each type pair of fast and slow moving averages.
Additionally, it allows to customize some multi-parametric moving averages such as JMA, ALMA, McGinley Dynamic, Adaptive Laguerre Filter etc.
1st Period (default: 14 )
2nd Period (default: 50 )
1st ALF Median Length (default: 5 )
2nd ALF Median Length (default: 5 )
1st ALMA Offset (default: 0.85 )
1st ALMA Sigma (default: 6 )
2nd ALMA Offset (default: 0.85 )
2nd ALMA Sigma (default: 6 )
1st HF Scaling Factor (default: 3 )
2nd HF Scaling Factor (default: 3 )
1st JMA Phase (default: 50 )
2nd JMA Phase (default: 50 )
1st MD Constant (default: 0.6 )
2nd MD Constant (default: 0.6 )
1st MHLMA Range (default: 10 )
2nd MHLMA Range (default: 10 )
1st PWMA Power (default: 2 )
2nd PWMA Power (default: 2 )
1st REMA Lambda (default: 0.5 )
2nd REMA Lambda (default: 0.5 )
1st RMF Median Length (default: 5 )
2nd RMF Median Length (default: 5 )
1st T3 Alpha (default: 0.7 )
2nd T3 Alpha (default: 0.7 )
MAMA & FAMA Fast Limit (default: 0.5 )
MAMA & FAMA Slow Limit (default: 0.05 )
Supported types of averages and filters (use short titles to match averages on the chart)
AHMA , Ahrens MA (by Richard D. Ahrens)
ALMA , Arnaud Legoux MA (by Arnaud Legoux and Dimitris Kouzis-Loukas)
ALF , Adaptive Laguerre Filter (by John F. Ehlers)
ARSI , Adaptive RSI
BF2 , Butterworth Filter with 2 poles
BF3 , Butterworth Filter with 3 poles
DEMA , Double Exponential MA (by Patrick G. Mulloy)
DWMA , Double Weighted (Linear) MA
EDCF , Ehlers Distance Coefficient Filter (by John F. Ehlers)
EHMA , Exponential Hull MA
EMA , Exponential MA
EVWMA , Elastic Volume Weighted MA (by Christian P. Fries)
FRAMA , Fractal Adaptive MA (by John F. Ehlers)
GF1 , Gaussian Filter with 1 pole
GF2 , Gaussian Filter with 2 poles
GF3 , Gaussian Filter with 3 poles
GF4 , Gaussian Filter with 4 poles
HFSMA , Hampel Filter on Simple Moving Average
HFEMA , Hampel Filter on Exponential Moving Average
HMA , Hull MA (by Alan Hull)
HWMA , Henderson Weighted MA (by Robert Henderson)
IDWMA , Inverse Distance Weighted MA
IIRF , Infinite Impulse Response Filter (by John F. Ehlers)
JMA , Jurik MA (by Mark Jurik, )
LF , Laguerre Filter (by John F. Ehlers)
LMA , Leo MA (by ProRealCode' user Leo)
LSMA , Least Squares MA (Moving Linear Regression)
MAMA & FAMA , (by John F. Ehlers, special case that used as a benchmark)
MD , McGinley Dynamic (by John R. McGinley)
MHLMA , Middle-High-Low MA (by Vitali Apirine)
PWMA , Parabolic Weighted MA
REMA , Regularized Exponential MA (by Chris Satchwell)
RMA , Running MA (by J. Welles Wilder)
RMF , Recursive Median Filter (by John F. Ehlers)
RMTA , Recursive Moving Trend Average (by Dennis Meyers)
SHMMA , Sharp Modified MA (by Joe Sharp)
SMA , Simple MA
SSF2 , Super Smoother Filter with 2 poles (by John F. Ehlers)
SSF3 , Super Smoother Filter with 3 poles (by John F. Ehlers)
SWMA , Sine Weighted MA
TEMA , Triple Exponential MA (by Patrick G. Mulloy)
TMA , Triangular MA (generalized by John F. Ehlers)
T3 , (by Tim Tillson)
VIDYA , Variable Index Dynamic Average (by Tushar S. Chande)
VWMA , Volume Weighted MA (by Buff P. Dormeier)
WMA , Weighted (Linear) MA
ZLEMA , Zero Lag Exponential MA (by John F. Ehlers and Ric Way)
NOTE : The results may vary on different tickers and timeframes.
If you see the preview result it doesn't mean that these crossovers will be profitable on other instruments and timeframes. This is a normal situation because time series and their characteristics differ.
I know that because I tested this tool before publishing.
NOTE 2 : You can use this tool by yourself and experiment with it, or you can order a study and I will share the spreadsheet that contains results with you.
Good luck!

Profitability IndexDisplays the percent difference from the outer Bollinger Band to the middle Bollinger Band, in addition to the Simple Moving Average of the Profitability Index itself.
Grants the trader the ability to quickly ascertain the instrument's profitability based on its current and recent percentage of movement.
Profitable Mondays & Losing FridaysHere's a Pine Script that marks profitable Mondays and losing Fridays for a given stock:
Explanation
Input Parameter: The script allows you to input the stock symbol, defaulting to SPX.
Daily Returns: It calculates the daily return based on the closing price.
Day Identification: It checks if the current day is Monday or Friday.
Conditions:
Profitable Mondays: Marks with a green background if Monday's return is positive.
Losing Fridays: Marks with a red background if Friday's return is negative.
Visualization: Uses bgcolor to highlight the respective days on the chart.
You can adjust the stockSymbol input to analyze different stocks.
Profitable Contrarian scalpingUses the 5 period and 10 period VMWAs that have been smoothed with a 5 period SMA of the close price. Normally, a short crossover long formation signals a buy signal, but as scalpers know, the 1 minute chart moves so fast and with so much volatility that lagging indicators get wrecked by the market. According, this strategy operates under the assumption that by the time this lagging indicator makes a signal, the price is ready to reverse. Losses are taken swiftly in the case of a continuation pattern. This indicator averages a 55-65% profitable rate and is almost always a positive P/L on the 1 minute chart of the most commonly traded assets.
Of course, there may be validity for this indicator outside the 1 minute chart, but I have found such success to be very limited. Accordingly, use this indicator on SPY, TQQQ, TSLA, AMZN, and major cryptos on the 1 min chart.

Profitable Strategy Forex 80 by LukasHello all,
Herewith I publish my Forex strategy, it's works for major pairs only.
I ran more than a thousand test to get this result! :))
The strategy have more than 8 Buy and Sell signal condition with 2 core signal provider.
You can turn on/off each 7 signal and find the most profitable combination for each pairs.
If you trade on lower timeframe, you can turn on "Higher Timeframe MA".
It's also will trigger buy/sell when breakout from monthly high / low when entry condition meets.
You can set weekly or monthly.
I work on 4H timeframe when develop the script, so best use is 4H.
Basically i want to make reliable strategy that can automate trade
without the need to check chart every minutes! Hahha
So i think higher time frame is the best time to start,
and I found 4H chart on Forex have more clear structure and volatility .
I make the signal visible, it consist of 3 line represent The Pairs, Base and Counter pairs,
basically when Green line on top it means Base currency is strong, vice versa.
You may share your setting in the comment section, so others can try it :)
For this result I turn on Signal A,C,D,E,F
Signal A and B use special RSI
Signal C and D use special MACD
Signal E use RSI
Signal F use EMA and DEMA combination
In my opinion each pairs has unique character, some of them move faster than others.
So, adjust the setting for each pairs will benefit you more.
For further develop of this strategy, please give me feedback! :)

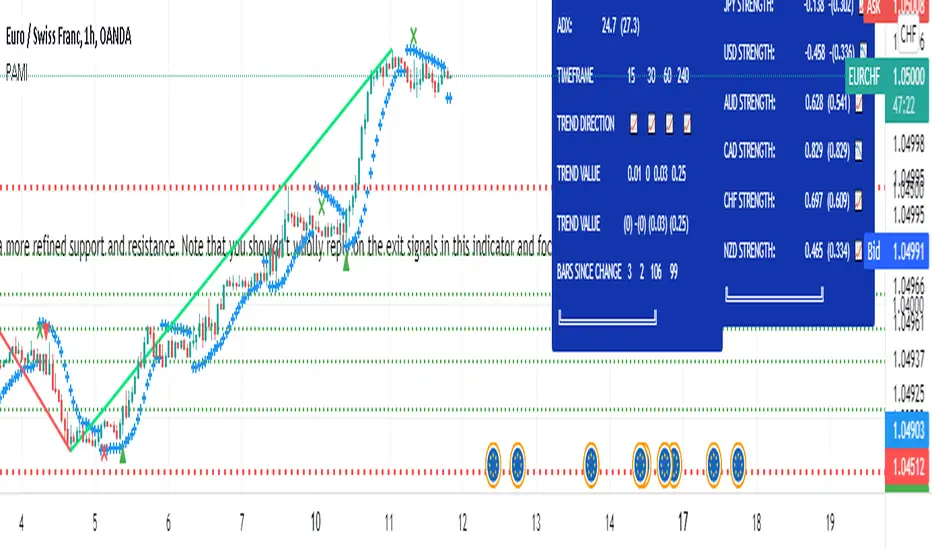
Profit Accumulator Main IndicatorMAIN INDICATOR (PAMI)
I've been using this indicator for several months now and allowed me to make some good profits as a result of this. I use this indicator in conjuntion with a number of others to allow me to make an informed decision on which trades to take and which are false signals.
The main indicator uses a number of methods including trend, momentum, volatility and volume to identify entry points into the market and exit points. The exit points are an estimate and your own target profit levels should also be used.
The following keys are used on the chart:
Green Up Arrow: Long Entry
Green Cross: Long Exit
Red Down Arrow: Short Entry
Red Cross: Short Exit
The main indicator is set up with custom alerts for when a long or short entry and exit signal is triggered.
I've been using this successfully on the one hour FX charts, but seems to work equally as well on higher or lower time frames (not less than 15min).
The main indicator has a number of tools in the settings that can be used to assist with trading. This includes
Bollinger Bands
Current Moving Averages
Multi-Timeframe Moving Averages
Chandelier Exits.
The chart is shown with the Bollinger Band overlay.
The other indicators which are part of the suite are shown on the website which is highlighted in my signature at the bottom of the page. Purchase of the main indicator gives access to the full suite of eight indicators. I use the other indicators to confirm the direction of the trade and to determine if I want to trade or not. I use it along with the 2min, 15min and 4hr timeframes to identify the best entry window and how long I'm likely to be in the trade.
Support can be provided via private message or in the comments below.
The links are provided below for access to the indicator.
Profit Hunter @DaviddTechProfit Hunter @DaviddTech is an advanced multi-strategy indicator designed to give traders a significant edge in identifying high-probability trading opportunities across all market conditions. By combining the power of T3 adaptive moving averages, ADX-based trend strength analysis, SuperTrend trailing stops, and dynamic support/resistance detection, this indicator delivers a complete trading system in one powerful package.
## 📊 Recommended Usage
Timeframes: Most effective on 1H, 4H, and Daily charts for swing trading; 5M and 15M for day trading
Markets: Works across all markets including Forex, Crypto, Indices, and Stocks
Setup Guidelines: Look for T3 crossovers with strong ADX readings (>25) coinciding with breakout signals (yellow dots/red crosses) near key support/resistance levels for highest probability entries
## 🔥 Key Features:
### T3 Adaptive Trend Detection:
Utilizes premium T3 adaptive indicators instead of standard EMAs for superior smoothing and accuracy
Dynamic color-shifting cloud formation between fast and slow T3 lines reveals immediate trend direction
Proprietary transparency algorithm intensifies cloud colors during strong trends based on real-time ADX readings
### Advanced Support & Resistance Mapping:
Automatically identifies and marks key market structure levels during T3 crossovers
Dynamic horizontal level plotting with optional extension for monitoring future price interactions
Intelligent level validation - converts to dotted lines when price breaks through, maintaining visual clarity
### SuperTrend Trailing Stoploss System:
Professional-grade white trailing stop indicator adapts to market volatility using ATR calculations
Generates precise entry and exit signals with optional buy/sell labels at critical reversal points
Visual trend state highlighting for immediate assessment of current market position
### Breakout Detection & Confirmation:
Sophisticated dual-algorithm breakout system combining Bollinger Bands and Keltner Channels
Visual breakout alerts with yellow dots (bullish) and red crosses (bearish) for instant pattern recognition
Validates breakouts against T3 trend direction to minimize false signals
### Alpha Edge Color System:
Utilizes DaviddTech's signature color scheme with bullish green and bearish pink
Revolutionary transparency algorithm translates ADX readings into precise visual intensity
Higher ADX values produce more vivid colors, instantly communicating trend strength without additional indicators
## 💰 Trading Applications:
Alpha Discovery: Identify emerging trends before the majority of market participants
Precision Entry/Exit: Use SuperTrend signals combined with support/resistance levels for optimal trade execution
Risk Management: Set stops based on the white trailing stoploss line for mathematically-optimized protection
Trend Confirmation: Validate setups using the T3 cloud direction and ADX-based intensity
Breakout Trading: Capture explosive moves with confirmed Bollinger/Keltner breakout signals
Swing Position Management: Monitor extended support/resistance levels for multi-day positioning
## ✨ Strategy Example
As shown in the chart image, ideal entries occur when:
The T3 cloud turns bullish (green) or bearish (pink) with strong color intensity
A yellow dot (bullish) or red cross (bearish) breakout signal appears
Price respects the white SuperTrend line as support/resistance
The trade aligns with key horizontal support/resistance levels identified by the indicator
## 📝 Attribution
This indicator builds upon and enhances concepts from:
Market Trend Levels Detector by BigBeluga (support/resistance detection framework)
T3 indicator implementation by DaviddTech (adaptive moving average system)
Average Directional Index (ADX) methodology for trend strength measurement
Profit Hunter @DaviddTech represents the culmination of advanced technical analysis methodologies in one seamless system.

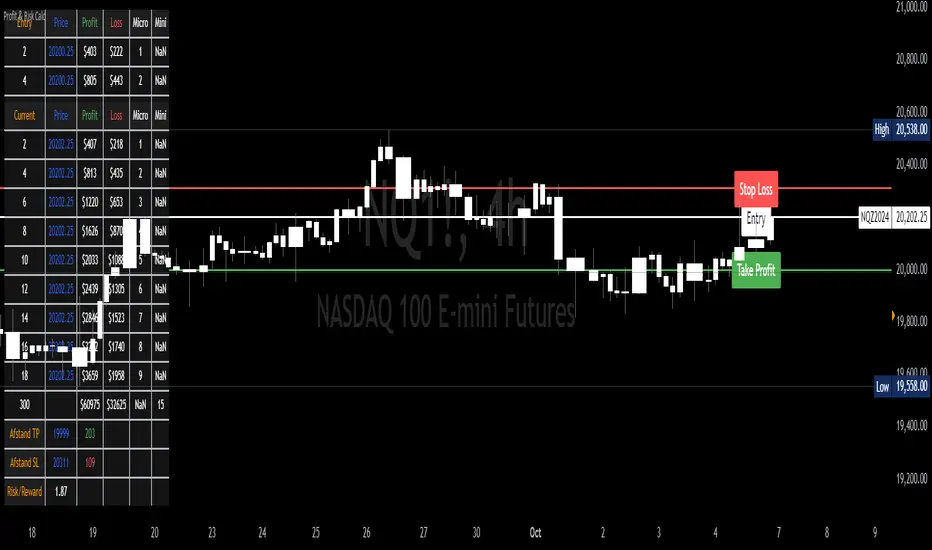
Profit & Risk CalculatorThe "Profit & Risk Calculator" script in Pine Script (TradingView) is designed to help users calculate potential profit and risk when trading, and to provide alerts when specific price levels are reached (such as entry price, take profit, or stop loss). It includes several components as described below:
1. Input Fields:
The user can manually input various prices: entry price, stop loss price, and take profit price, with steps of 0.25.
There is also an option to input a custom value (e.g., for personal lot sizing) and a total investment amount.
2. Dynamic Lines:
The script draws dynamic horizontal lines for the input prices: entry line (white), stop loss line (red), and take profit line (green).
These lines are automatically updated based on the entered price levels.
3. Labels for the Lines:
Labels are added to the lines to visually indicate the entry, stop loss, and take profit levels on the chart.
4. Long and Short Position Calculations:
The script calculates potential profit and loss for both long (profit if the price goes up) and short (profit if the price goes down) positions.
It also calculates the distance between entry and take profit, and distance between entry and stop loss, along with the risk/reward ratio (RR).
5. Alerts:
The script generates alerts when one of the following conditions is met:
Entry Condition: The price touches or exceeds the entry price (high >= entryPrice).
Stop Loss Condition: The price touches or drops below the stop loss price (low <= stopLossPrice).
Take Profit Condition: The price touches or exceeds the take profit price (high >= takeProfitPrice).
6. Lot Calculations:
The script calculates both micro and mini lot sizes based on a preset table and the custom value.
The results are displayed in a table on the chart.
7. Profit/Risk Table:
The script shows two tables:
One table calculates the profit, loss, and risk/reward ratio based on the input entry price.
A second table shows the same calculations based on the current price.
8. Chart Display:
The script places tables and other visual data on the chart, such as preset values, profit and loss calculations, and the distance from take profit and stop loss to the entry price.
English Explanation of Each Part of the Script
1. Input Fields
The script starts with several input fields where the user can specify the entry price, stop loss price, take profit price, custom value, and investment amount. These values help define the parameters for risk/reward calculations.
2. Dynamic Horizontal Lines
Three horizontal lines are drawn on the chart, representing the entry price, stop loss price, and take profit price. These lines update dynamically based on user input.
3. Dynamic Line Updates
As the user adjusts their inputs, the position of the lines is updated in real-time to match the new price levels. This keeps the chart visually accurate.
4. Labels for Lines
Labels are placed on the chart next to each price line, allowing the user to clearly see which line represents which price level.
5. Long and Short Position Calculations
The script calculates the potential profit or loss for both long (prices go up) and short (prices go down) positions, providing users with an idea of their potential gains or losses.
6. **6. Risk/Reward Ratio Calculation
This calculates the Risk/Reward Ratio (RR) by dividing the distance between the take profit and entry price by the distance between the entry and stop loss price. This gives the trader an idea of how much risk they're taking relative to the potential reward.
7. Alert Conditions
The alert conditions are defined based on the price hitting the set levels:
Entry Condition: If the price goes up and touches the entry level, the alert is triggered.
Stop Loss Condition: If the price drops and hits the stop loss level, the alert is triggered.
Take Profit Condition: If the price rises and reaches the take profit level, the alert is triggered.
8. Alert Configuration
Each condition is linked to an alert that sends a message when the specific price level is touched. The alerts notify the user when the entry, stop loss, or take profit levels are hit.
9. Lot Calculations
The script includes a function that calculates micro and mini lot sizes based on a preset table and a custom value input by the user. This is useful for adjusting lot sizes to the desired amount and determining position sizes for trades.
10. Entry Price-Based Profit & Loss Table
A table is generated on the chart that displays detailed information about the profit, loss, and risk/reward ratio based on the entry price. It helps traders see the potential outcomes for different lot sizes.
11. Current Price-Based Profit & Loss Table
This second table provides similar information as the first but calculates profit, loss, and risk/reward based on the current price. This allows the trader to see how their position performs as the market price changes in real time.