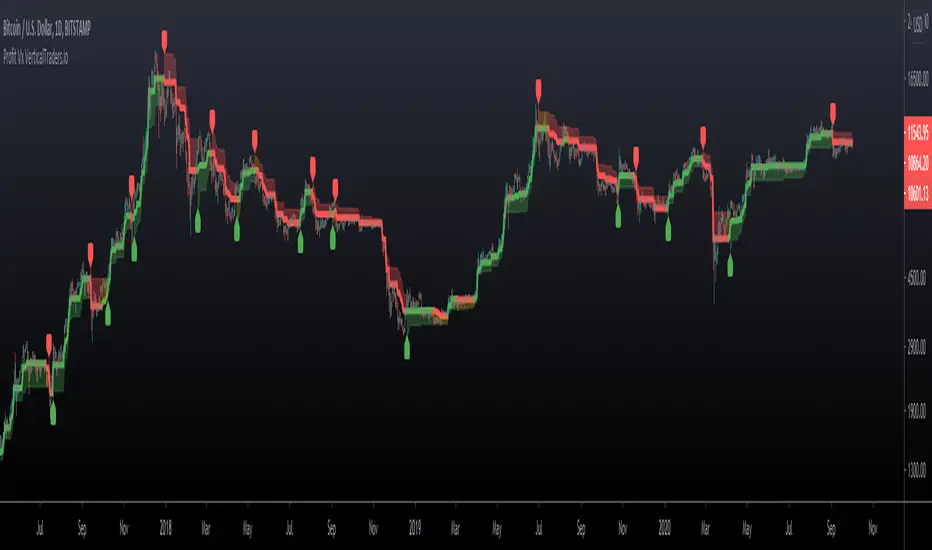
Profit VxProfit Vx
- Labels for Long and Short entries
- Take Profit point base on %
- Candlestick color, orange is warning or not trending zone
Cari dalam skrip untuk "profit"
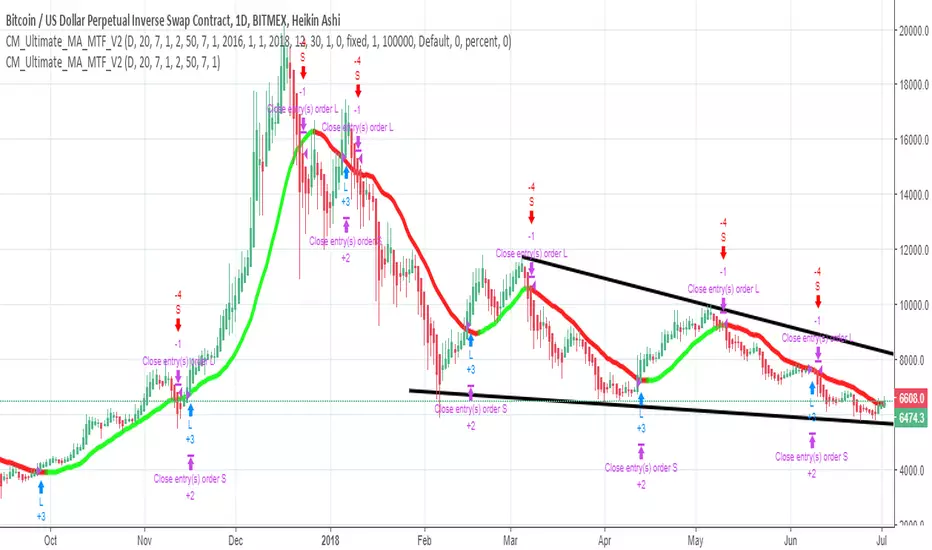
BTC-USD Strategy profit with cross basisHello all,
I modified a public script with long and short signals when the basis line is cross by Heikin Ashi.
It's a real-time script and not a scam. The profit is realized with one or two contracts.
You can add alerts and link it to robots for trade.
For access PM,
GaetanLpp
Enhanced RSI KDE | Advanced FiltersThis is an enhanced version of the excellent RSI (Kernel Optimized) indicator originally created by @fluxchart. Full credit goes to fluxchart for the innovative KDE (Kernel Density Estimation) concept and the solid foundation that made this enhancement possible.
🙏 CREDITS & ACKNOWLEDGMENTS
Original Creator: @fluxchart - RSI (Kernel Optimized)
Original Concept: Kernel Density Estimation applied to RSI pivot analysis
Enhancement: Advanced filtering system and signal optimization- profitgang
License: Mozilla Public License 2.0
🚀 WHAT'S NEW IN THIS ENHANCED VERSION
Building upon fluxchart's brilliant KDE RSI foundation, this version adds:
🔥 Advanced Filtering System:
Multi-Timeframe Confluence - Confirms signals across higher timeframes
Volume Confirmation - Only signals on above-average volume
Volatility Range Filter - Avoids signals in choppy or extreme conditions
Trend Context Analysis - Considers overall market direction
Adaptive Pivot Detection - Adjusts sensitivity based on market volatility
🎯 Signal Quality Improvements:
Confluence Scoring - Each signal gets a quality score (1-6)
Label Cooldown System - Prevents chart clutter with smart spacing
Higher Activation Thresholds - More selective signal generation
Risk Management Integration - Auto stop-loss and take-profit levels
📊 Enhanced Dashboard:
Real-time filter status monitoring
KDE probability percentages
Confluence scores for both directions
Volume and volatility readings
⚙️ HOW IT WORKS
The indicator maintains fluxchart's core KDE methodology:
Collects RSI values at historical pivot points
Creates probability density functions using Gaussian/Uniform/Sigmoid kernels
Identifies high-probability zones for potential reversals
NEW: Multiple filters must align before generating signals, dramatically reducing false positives while maintaining the accuracy of high-probability setups.
🎛️ RECOMMENDED SETTINGS
Confluence Score: 5/6 (very selective)
Activation Threshold: Medium or High
Multi-Timeframe: Enabled with 2/2 alignment
Volume Filter: Enabled (1.5x threshold)
All other filters: Enabled for maximum quality
📈 BEST USE CASES
Swing Trading - Higher timeframe confirmation reduces whipsaws
Quality over Quantity - Fewer but much higher probability signals
Risk Management - Built-in stop/target levels for each signal
Multi-Asset Analysis - Works on stocks, crypto, forex, commodities
⚠️ IMPORTANT NOTES
This is a quality-focused indicator - expect fewer but better signals
Backtest thoroughly on your specific assets and timeframes
The original fluxchart indicator remains excellent for different trading styles
Consider this an alternative approach, not a replacement
🤝 COLLABORATION & FEEDBACK
Special thanks to @fluxchart for creating the original innovative KDE RSI concept. This enhancement wouldn't exist without that solid foundation.
Feel free to suggest improvements or share your results! The goal is to build upon great work in the community.

NQ Climax Signals - Chart OverlayThis specialized overlay indicator identifies extreme volume exhaustion points (climaxes) in NQ1! (Nasdaq 100 E-mini futures) that often signal major market reversals. By analyzing volume spikes relative to historical patterns, it helps traders spot potential turning points before they become obvious to the broader market.
Key Features
🎯 Climax Detection Technology
Selling Climax: Extreme red candle volume indicating selling exhaustion (potential reversal UP)
Buying Climax: Extreme green candle volume indicating buying exhaustion (potential reversal DOWN)
Volume Ratio Analysis: Compares current volume to 30-day historical averages
Dynamic Thresholds: Adjustable sensitivity for different market conditions
📍 Precision Signal Placement
Chart Overlay: Signals appear directly on price bars where they occur
Fixed Positioning: Signals remain stable regardless of chart scaling or zoom level
Clear Visual Hierarchy: Purple for selling climax, blue for buying climax
Dual Display Options: Text labels or clean diamond shapes
⚡ Real-Time Analysis
Live Calculations: Updates with each new candle
30-Day Lookback: Analyzes recent volume patterns for context
Smart Filtering: Only triggers on true volume extremes
Background Highlighting: Subtle chart tinting during climax events
Trading Applications
🔄 Reversal Trading
Selling Climax at Support: High probability bounce setup
Buying Climax at Resistance: High probability rejection setup
Counter-trend Entries: Fade extreme moves with volume confirmation
Risk Management: Clear invalidation levels based on climax bars
📊 Market Structure Analysis
Volume Exhaustion Points: Identify where trends may pause or reverse
Institutional Activity: Spot large player capitulation or distribution
Market Sentiment Extremes: Recognize panic selling or euphoric buying
Confirmation Tool: Validate other technical analysis signals
How Volume Climaxes Work
🔴 Selling Climax (Purple Signals)
Definition: Extremely high volume on red candles
Psychology: Panic selling, forced liquidation, capitulation
Opportunity: Often marks short-term or intermediate bottoms
Action: Consider long positions with proper risk management
🔵 Buying Climax (Blue Signals)
Definition: Extremely high volume on green candles
Psychology: FOMO buying, euphoria, exhaustion buying
Opportunity: Often marks short-term or intermediate tops
Action: Consider short positions with proper risk management
Technical Specifications
📈 Algorithm Details
Volume Multiplier: Default 2.5x average (customizable 2.0-5.0x)
Ratio Threshold: Default 1.5 for trend confirmation
Lookback Period: 30 days (customizable 1-250 days)
Update Frequency: Real-time with each tick
🎛️ Customization Options
Show/Hide Labels: Toggle between text and diamond displays
Sensitivity Adjustment: Fine-tune trigger thresholds
Background Effects: Optional chart highlighting
Alert System: Comprehensive notification setup
Best Practices
✅ Optimal Usage
Combine with Support/Resistance: Climaxes near key levels are most reliable
Confirm with Price Action: Look for reversal candlestick patterns
Use Proper Position Sizing: Climax trades can be volatile
Set Clear Stops: Define risk before entering any position
⚠️ Important Considerations
Not Every Climax Reverses: Some lead to continuation after brief pause
Context Matters: Consider overall trend and market structure
Volume Quality: Higher timeframe confirmation strengthens signals
Risk Management: Always use appropriate stop losses
Educational Value
This indicator teaches traders to:
Recognize Volume Patterns: Understand how volume reveals market psychology
Identify Exhaustion: Spot when trends may be running out of steam
Time Market Entries: Enter near potential turning points
Develop Market Feel: Build intuition for volume-price relationships
Installation & Setup
Add this overlay indicator directly to your NQ futures chart
Adjust volume multiplier based on recent market volatility
Enable alerts for automatic climax notifications
Combine with the companion "NQ Volume Analysis" oscillator for complete analysis
Disclaimer
This indicator is for educational and informational purposes only. Volume climax signals do not guarantee reversals and should be used as part of a comprehensive trading strategy. Past performance does not predict future results. Trading futures involves substantial risk of loss and is not suitable for all investors.
💡 Developed by ProfitGang Trading Community
Advanced volume analysis tools for serious traders
🔔 Enable alerts to catch every climax signal!
⭐ Rate and review if this tool improves your trading!
Companion Tools
NQ Volume Analysis: Complete multi-timeframe volume oscillator
Works Best Together: Use both indicators for comprehensive volume analysis
Professional Trading Suite: Part of ProfitGang's advanced indicator collection
#NQFutures #VolumeClimax #ReversalTrading #VolumeAnalysis #FuturesTrading #TechnicalAnalysis #ProfitGang #TradingSignals

Floor and Roof Indicator with SignalsFloor and Roof Indicator with Trading Signals
A comprehensive support and resistance indicator that identifies premium and discount zones with automated signal generation.
Key Features:
Dynamic Support/Resistance Zones: Calculates floor (support) and roof (resistance) levels using price action and volatility
Premium/Discount Zone Identification: Highlights areas where price may find resistance or support
Customizable Signal Frequency: Control how often signals are displayed (every Nth occurrence)
Visual Signal Table: Optional table showing the last 5 long and short signal prices
Multiple Timeframe Compatibility: Works across all timeframes
Technical Details:
Uses ATR-based calculations for dynamic zone width adjustment
Combines Bollinger Bands with highest/lowest price analysis
Smoothing options for cleaner signal generation
Fully customizable colors and display options
How to Use:
Floor Zones (Blue): Potential support areas where long positions may be considered
Roof Zones (Pink): Potential resistance areas where short positions may be considered
Signal Crosses: Visual markers when price interacts with key levels
Signal Table: Track recent signal prices for analysis
Settings:
Length: Period for calculations (default: 200)
Smooth: Smoothing factor for cleaner signals
Zone Width: Adjust the thickness of support/resistance zones
Signal Frequency: Control signal display frequency
Visual Options: Customize colors and table position
Alerts Available:
Long signal alerts when price touches discount zones
Short signal alerts when price reaches premium zones
Educational Purpose: This indicator is designed to help traders identify potential support and resistance areas. Always combine with proper risk management and additional analysis.
This description focuses on the technical aspects and educational value while avoiding any language that could be interpreted as financial advice or guaranteed profits.

Dynamic TestingInput Parameters
`lookbackPeriod` : Number of candles to check for determining the highest high (resistance) and lowest low (support) levels.
`atrPeriod` : The period for calculating the Average True Range (ATR), a measure of market volatility.
`atrMultiplierSL` : Multiplier to calculate the stop-loss distance relative to the ATR.
`atrMultiplierTP1` and `atrMultiplierTP2` : Multipliers to calculate two take-profit levels relative to ATR.
`rewardToRisk` : The ratio between reward (profit) and risk (stop loss) for trade management.
---
Core Calculations
ATR (Average True Range)
atr = ta.atr(atrPeriod)
ATR is computed using the specified period to gauge price volatility.
Volume SMA
volumeSMA = ta.sma(volume, atrPeriod)
The script calculates the simple moving average of volume over the same period as ATR. This is used as a threshold for validating high-volume scenarios.
---
Support and Resistance Levels
`support` : Lowest price over the last `lookbackPeriod` candles.
`resistance` : Highest price over the same period.
`supportBuffer` and `resistanceBuffer` : These are "buffered" zones around support and resistance, calculated using half of the ATR to prevent false breakouts.
---
Entry Scenarios
Bullish Entry (`isBullishEntry`)
The close is above the buffered support level.
The low of the current candle touches or breaks below the support level.
The trading volume is greater than the `volumeSMA`.
Bearish Entry (`isBearishEntry`)
The close is below the buffered resistance level.
The high of the current candle touches or exceeds the resistance level.
The trading volume is greater than the `volumeSMA`.
---
Box Visualization
Bullish and Bearish Boxes
Bullish Box (`bullishBox`):
- A green, semi-transparent rectangle around the support level to highlight the bullish entry zone.
- Dynamically updates based on recent price action.
Bearish Box (`bearishBox`):
- A red, semi-transparent rectangle around the resistance level to highlight the bearish entry zone.
- Adjusts similarly as price evolves.
---
Stop Loss and Take Profit Calculations
Bullish Trades
Stop Loss (`bullishSL`): Calculated as support - atrMultiplierSL * ATR .
Take Profit 1 (`bullishTP1`): support + rewardToRisk * atrMultiplierTP1 * ATR .
Take Profit 2 (`bullishTP2`): support + rewardToRisk * atrMultiplierTP2 * ATR .
Bearish Trades
Stop Loss (`bearishSL`): resistance + atrMultiplierSL * ATR .
Take Profit 1 (`bearishTP1`): resistance - rewardToRisk * atrMultiplierTP1 * ATR .
Take Profit 2 (`bearishTP2`): resistance - rewardToRisk * atrMultiplierTP2 * ATR .
---
Visualization for Key Levels
Bullish Scenario
Green lines represent `bullishTP1` and `bullishTP2` for profit targets.
A red line indicates the `bullishSL` .
Labels like "TP1," "TP2," and "SL" dynamically appear at respective levels to make the targets and risk visually clear.
Bearish Scenario
Red lines represent `bearishTP1` and `bearishTP2` .
A green line marks the `bearishSL` .
Similar dynamic labeling for `TP1` , `TP2` , and `SL` at corresponding bearish levels.
---
Dynamic Updates
Both the entry boxes and key level visualizations (lines and labels) adjust dynamically based on real-time price and volume data.
---
Purpose
Identify high-probability bullish and bearish trade setups.
Define clear entry zones (using boxes) and exit levels (TP1, TP2, SL).
Incorporate volatility (via ATR) and volume into decision-making.
---
Technical Summary
Dynamically visualize support/resistance levels.
Set risk-managed trades using ATR-based stop-loss and profit levels.
Automate visual trade zones for enhanced chart clarity.
---

All-Market Monitor 中文說明
全能市場監測者是一款多功能指標,為交易者提供全面的市場監控,包含價格趨勢、移動平均線、交易量及風險管理等數據。此指標支援多項參數設置,方便交易者根據需求調整配置,實現更靈活的交易策略。
參數說明:
SMA長度設定:可調整7條不同長度的SMA (簡單移動平均線),提供不同時間框架的趨勢信息。
交易量倍數:設置交易量的倍數,強調異常的交易量變化。當交易量倍數達到指定條件時,K線會改變顏色,以便快速辨識市場中的顯著變動。
最低低點期間:設定計算最低價格線的期間,用於判斷進場後的趨勢止盈位置。此支撐線能幫助交易者在趨勢中保護利潤。
ATR期數與倍數:ATR (平均真實範圍) 用於計算止損線,期數及倍數可調整,以便根據波動性設定更合適的止損範圍。
進場價位與USDT總量:用戶可以輸入預計的進場價位和總資金量,指標會根據風險控制自動計算建倉金額。風險控制是每筆交易僅損失5%的總資金,以更好地管理風險。
倍數 (槓桿):此參數允許用戶設置槓桿倍數,用於計算最終所需的資金。
表格功能
指標的表格功能在圖表上顯示進場價位、止損點和建倉金額。表格顏色清晰對比,提供了簡明的交易數據概覽,使交易者能夠快速查看並根據當前市場情況做出風險控制決策。
交易量支撐效果
此指標在異常交易量倍數達到特定條件時會標示不同顏色,表現出強烈的市場關注度。當交易量出現突增或高於SMA交易量的情況時,往往顯示出支撐或阻力的信號。特別在價格頂部或底部時,這些異常交易量常會產生支撐效果,暗示該區域可能形成穩固的價格支撐或阻力。
這款指標適合希望嚴謹管理風險的交易者,適用於日內和長期策略,並能提供穩定的市場監控信息。
English Description
All-Market Monitor is a versatile indicator providing traders with comprehensive market insights, including price trends, moving averages, volume analysis, and risk management. This indicator supports multiple adjustable parameters, allowing traders to configure the settings for more adaptable trading strategies.
Parameter Descriptions:
SMA Length Settings: Configurable lengths for seven different SMAs (Simple Moving Averages) to provide trend information across various time frames.
Volume Multiplier: Sets the multiplier for trading volume to highlight unusual volume spikes. When volume conditions meet specified criteria, the candles change colors for easy recognition of significant market moves.
Lowest Low Period: Defines the period for calculating the lowest price line, which serves as a trailing take-profit level after entry. This support line helps traders secure profits in a trending market.
ATR Period and Multiplier: The ATR (Average True Range) is used to calculate a dynamic stop-loss level. Adjustable period and multiplier provide flexibility in setting stop levels based on market volatility.
Entry Price and Total USDT: Allows input of the intended entry price and total capital in USDT. The indicator calculates the required position size based on a risk management rule, where each trade is limited to a maximum loss of 5% of total capital.
Leverage: Users can set the leverage multiplier, which adjusts the final required USDT for entry.
Table Feature
The table feature provides an on-chart display of entry price, stop-loss level, and required position size, with distinct colors for easy reference. This layout delivers a clear summary of key trading metrics, enabling traders to make risk-adjusted decisions in real time.
Volume Support Effect
When unusual volume spikes meet specific criteria, the indicator highlights candles with distinct colors, representing heightened market interest. These volume spikes often indicate support or resistance levels, especially at price peaks or troughs, where high volume can signal potential support effects, indicating that prices may hold within these regions due to strong buying or selling interest.
This indicator is ideal for traders focused on rigorous risk management, suitable for both intraday and long-term strategies, offering reliable market monitoring insights.

DMI MTF Color Table v5DMI Multi-Timeframe Color Table v5
A comprehensive DMI (Directional Movement Index) table that displays trend direction and strength across multiple timeframes simultaneously. This indicator helps traders quickly assess market conditions and identify confluence across different time horizons.
Features:
Multi-timeframe analysis (7 configurable timeframes)
Color-coded cells based on trend strength and direction
Real-time current market condition display
Customizable strength thresholds and color schemes
Multiple display modes (All, DI+ Only, DI- Only, ADX Only)
Text-based strength classifications (STRONG/MEDIUM/WEAK)
Directional bias indicators (BULL/BEAR)
How It Works:
The table shows DI+, DI-, and ADX values across your chosen timeframes with intelligent color coding:
Green shades indicate bullish momentum (DI+ > DI-)
Red shades indicate bearish momentum (DI- > DI+)
Color intensity reflects trend strength based on ADX values
Current market condition appears in top-right corner
Display Options:
Toggle numerical values, strength text, and timeframe labels
Adjustable table size and transparency
Customizable color schemes for all conditions
Optional current timeframe DMI plot overlay
Educational Use:
This tool is designed for educational purposes to help understand multi-timeframe analysis and DMI interpretation. All trading decisions should be based on your own analysis and risk management.
Credits:
Original concept and development by Profitgang. If you use or modify this script, please provide appropriate credit to the original author.
Note: This indicator is for analysis purposes only. Past performance does not guarantee future results. Always conduct your own research and consider your risk tolerance before making trading decisions.

Enhanced 4H Candle Countdown & High/Low IndicatorBy profitgang
This Pine Script indicator provides real-time tracking of 4-hour timeframe levels with an integrated countdown timer, designed to help traders monitor key support and resistance zones.
Key Features
📊 Visual Elements
4H High/Low Lines: Clear visualization of previous 4-hour candle high and low levels
Range Fill: Subtle background fill between high and low for better context
Mid-Level Line: Shows the middle point of the 4H range
Position Indicator: Visual cue showing current price position within the range
⏰ Countdown Timer
Real-time countdown to next 4H candle close
Customizable table position (9 different locations)
Adjustable text size (6 size options from Tiny to Huge)
Distance calculations showing percentage distance from key levels
🎯 Signal Generation
Long signals when price crosses above 4H low
Short signals when price crosses below 4H high
RSI confluence filter to reduce false signals
Background highlighting for active signals
TradingView alerts compatible
⚙️ Customization Options
Toggle all features on/off independently
Custom colors for all elements
Table positioning (top/middle/bottom + left/center/right)
Text size selection for optimal readability
Alert notifications for level breaks and updates
How It Works
The indicator fetches the previous 4-hour candle's high and low values and displays them as horizontal lines on your current timeframe chart. It continuously calculates the time remaining until the current 4H candle closes and presents this information in a clean, customizable table.
Use Cases
Swing Trading: Identify key 4H support and resistance levels
Intraday Trading: Monitor when new 4H levels will be established
Risk Management: Calculate distance from key levels for position sizing
Multi-timeframe Analysis: Combine with lower timeframe setups
Educational Purpose
This indicator is designed for educational and analytical purposes to help traders understand price action relative to higher timeframe levels. It provides clear visual feedback about market structure and timing.
Settings Groups
Display Settings: Toggle features, positioning, and sizing
Colors: Customize all visual elements
Signal Settings: Configure alert conditions and confluence filters
Compatibility
Works on all timeframes (recommended for 1m to 1H charts)
Compatible with all instruments
Includes proper alert functionality for automated notifications
Optimized for both light and dark themes
This indicator does not provide financial advice. Always conduct your own research and risk management before making trading decisions.

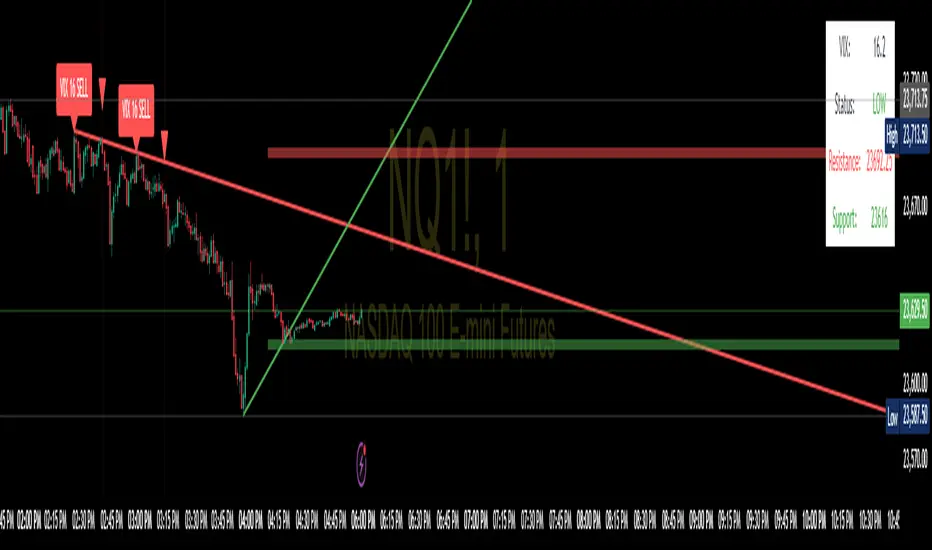
SPX Trendlines with VIX Levels By- Profit gang
This comprehensive technical analysis tool combines SPX trendline analysis with VIX volatility levels to help identify potential market turning points. The indicator is specifically designed with non-repainting logic to ensure reliability for both backtesting and live trading.
🔧 KEY FEATURES:
Non-Repainting Design: All signals and lines are drawn only on confirmed bars using barstate.isconfirmed
Dynamic Trendlines: Automatically draws support and resistance lines connecting recent pivot points
VIX Integration: Displays current VIX levels with customizable thresholds for market sentiment analysis
Multiple Visual Elements: Includes diagonal trendlines, horizontal level lines, and an information table
Comprehensive Alerts: Configurable alert system for both buy and sell signals
Clean Interface: Organized inputs and customizable colors for all elements
📊 TRADING CONCEPT:
The indicator utilizes the inverse relationship between VIX and SPX:
High VIX at pivot lows may indicate oversold conditions (potential buying opportunities)
Low VIX at pivot highs may signal complacency at market tops (potential caution zones)
🎛️ CUSTOMIZATION OPTIONS:
Toggle trendlines, VIX labels, and level lines independently
Adjust VIX thresholds (default: 25 high, 18 low)
Customize pivot length for sensitivity (default: 15)
Choose line styles (solid, dashed, dotted) and widths
Personalize all colors and alert preferences
📈 VISUAL COMPONENTS:
Red Lines: Resistance levels and trendlines
Green Lines: Support levels and trendlines
Information Table: Real-time VIX status and current levels
Signal Shapes: Triangle markers for confirmed buy/sell signals
Background Highlighting: Optional signal emphasis
⚠️ EDUCATIONAL PURPOSE:
This indicator is designed for educational and informational purposes. Past performance does not guarantee future results. Always conduct your own research and consider risk management before making trading decisions.
🔔 ALERT SYSTEM:
Separate alerts for buy and sell signals
All alerts trigger only on confirmed bars
Customizable alert messages with price and VIX data
Multiple alert condition options for flexible setup
Perfect for traders who want to combine technical analysis with volatility sentiment in a reliable, non-repainting format.
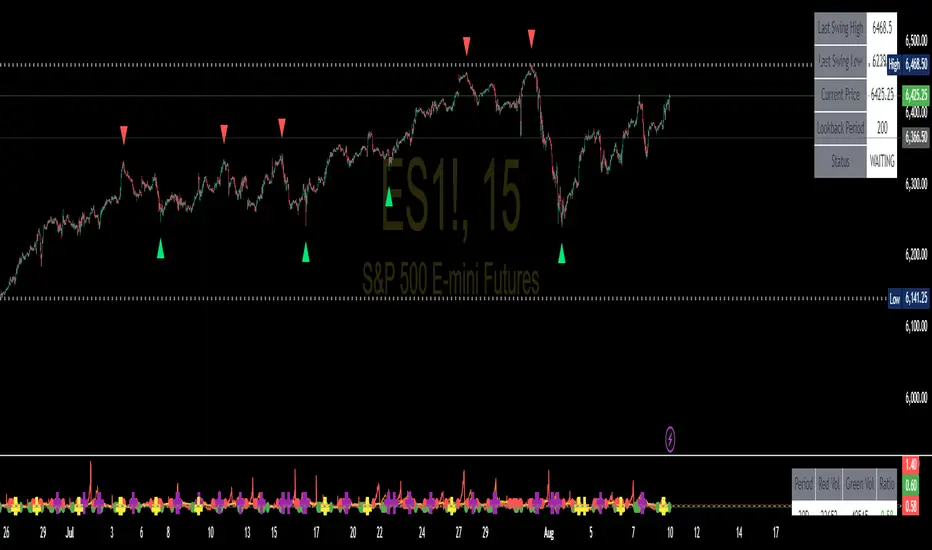
Swing High/Low SignalsSwing High/Low Signals – profit gang
Quickly spot recent market turning points with this clean swing high/low indicator.
Marks swing highs & lows with labels or triangles
Optional connecting lines & background highlights
Alerts when new swings form
Info table showing last swing levels & current price
Fully adjustable lookback period for any timeframe.
Disclaimer: For educational use only. Not financial advice.
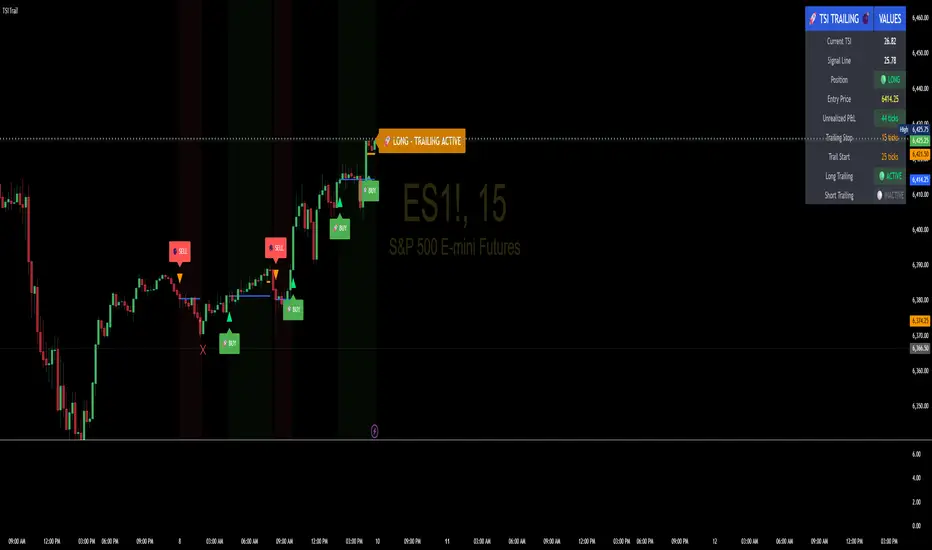
TSI Indicator with Trailing StopAuthor: ProfitGang
Type: Indicator (visual + alerts). No orders are executed.
What it does
This tool combines the True Strength Index (TSI) with a simple tick-based trailing stop visualizer.
It plots buy/sell markers from a TSI cross with momentum confirmation and, if enabled, draws a trailing stop line that “ratchets” in your favor. It also shows a compact info table (position state, entry price, trailing status, and unrealized ticks).
Signal logic (summary)
TSI is computed with double EMA smoothing (user lengths).
Signals:
Buy when TSI crosses above its signal line and momentum (TSI–Signal histogram) improves, with TSI above your Buy Threshold.
Sell when TSI crosses below its signal line and momentum weakens, with TSI below your Sell Threshold.
Confirmation: Optional “Confirm on bar close” setting evaluates signals on closed bars to reduce repaint risk.
Trailing stop (visual only)
Units are ticks (uses the symbol’s min tick).
Start Trailing After (ticks): activates the trail only once price has moved in your favor by the set amount.
Trailing Stop (ticks): distance from price once active.
For longs: stop = close - trail; it never moves down.
For shorts: stop = close + trail; it never moves up.
Exits shown on chart when the trailing line is touched or an opposite signal occurs.
Note: This is a simulation for visualization and does not place, manage, or guarantee broker orders.
Inputs you can tune
TSI Settings: Long Length, Short Length, Signal Length, Buy/Sell thresholds, Confirm on Close.
Trailing Stop: Start Trailing After (ticks), Trailing Stop (ticks), Show/Hide trailing lines.
Display: Toggle chart signals, info table, and (optionally) TSI plots on the price chart.
Alerts included
TSI Buy / TSI Sell
Long/Short Trailing Activated
Long/Short Trail Exit
Tips for use
Timeframes/markets: Works on any symbol/timeframe that reports a valid min tick. If your market has large ticks, adjust the tick inputs accordingly.
TSI view: By default, TSI lines are hidden to avoid rescaling the price chart. Enable “Show TSI plots on price chart” if you want to see the oscillator inline.
Non-repainting note: With Confirm on bar close enabled, signals are evaluated on closed bars. Intrabar previews can change until the bar closes—this is expected behavior in TradingView.
Limitations
This is an indicator for education/research. It does not execute trades, and visuals may differ from actual broker fills.
Performance varies by market conditions; thresholds and trail settings should be tested by the user.
Disclaimer
Nothing here is financial advice. Markets involve risk, including possible loss of capital. Always do your own research and test on a demo before using any tool in live trading.
— ProfitGang
NQ Volume Analysis - Predictive SignalsOverview
This professional-grade indicator analyzes red and green candle volume patterns across multiple timeframes (30, 60, 90 days) to identify potential market reversals and momentum shifts in NQ1! (Nasdaq 100 E-mini futures). Perfect for day traders and swing traders looking to gain an edge through volume analysis.
Key Features
📈 Multi-Timeframe Volume Analysis
30/60/90 Day Lookbacks: Compare short, medium, and long-term volume patterns
Red/Green Volume Ratios: Identify when selling or buying pressure is dominating
Dynamic Calculations: Real-time updates as new volume data comes in
🎯 Trading Signals
Long Signals: High volume green candles during bullish conditions
Short Signals: High volume red candles during bearish conditions
Climax Signals: Extreme volume events that often precede reversals
Fixed Signal Positioning: Signals remain stable regardless of chart scaling
📊 Visual Analytics
Volume Ratio Lines: Clear trend visualization with color-coded timeframes
Reference Thresholds: 0.8 (bullish), 1.0 (neutral), 1.2 (bearish) zones
Information Table: Real-time statistics display with color-coded ratios
Clean Oscillator Format: Dedicated panel below price chart
How to Use
Ratio Interpretation
Ratio > 1.2: Bears dominating - look for short opportunities
Ratio < 0.8: Bulls dominating - look for long opportunities
Rising Ratio: Increasing selling pressure (potential breakdown)
Falling Ratio: Increasing buying pressure (potential breakout)
Signal Types
🟢 Green Triangles: Bullish volume surge - potential long entry
🔴 Red Triangles: Bearish volume surge - potential short entry
🟣 Purple Diamonds: Selling climax - potential reversal up
🔵 Blue Diamonds: Buying climax - potential reversal down
Best Practices
Use on 5-minute charts for optimal NQ futures analysis
Combine with price action and support/resistance levels
Wait for volume confirmation before entering trades
Pay special attention to climax signals at key levels
Technical Specifications
Timeframes: Optimized for 1m to 1D charts
Lookback Periods: Configurable 30-250 day ranges
Volume Multipliers: Adjustable sensitivity settings
Alert System: Built-in notifications for all signal types
Educational Value
This indicator teaches traders to:
Understand volume's role in price movement
Identify institutional buying/selling patterns
Recognize market exhaustion points
Develop systematic trading approaches
Disclaimer
This indicator is for educational and informational purposes only. Past performance does not guarantee future results. Always conduct your own analysis and risk management. Trading futures involves substantial risk of loss.
💡 Developed by ProfitGang Trading Community
Empowering traders through advanced technical analysis and education
🔔 Enable alerts to never miss a signal!
⭐ If this indicator helps your trading, please leave a review!
Installation Notes
Add the main oscillator indicator to a separate panel below your chart
Optionally add the companion "NQ Climax Signals" overlay for price chart signals
Adjust volume multipliers based on your risk tolerance
Enable alerts for automatic signal notifications
Version History
v1.0: Initial release with multi-timeframe volume analysis
Features: Fixed signal positioning, customizable thresholds, comprehensive alerts
#NQFutures #VolumeAnalysis #TradingSignals #FuturesTrading #TechnicalAnalysis #ProfitGang

Quantum Breakout System**Quantum Breakout System (QBS) by @profitgang**
**Description:**
The Quantum Breakout System combines multi-dimensional fractal analysis with a novel “quantum energy” momentum indicator to identify high-probability support and resistance breakout zones. It plots colored boxes around the latest primary fractals—red/orange/yellow for resistance and lime/green/blue for support—each labeled “Strong”, “Medium” or “Weak” to convey relative breakout strength. Optional background fills highlight pre-breakout staging areas.
**Key Features:**
* **Multi-Timeframe Fractals:** Detects primary fractals on the current chart, with adjustable lookback lengths.
* **Quantum Energy Momentum:** Computes an energy score by blending short, medium, and long RSI-based momentum; scaled by ATR-normalized volatility.
* **Dynamic Breakout Zones:** Plots color-coded boxes around fractals, with embedded labels indicating “Resistance — Strong/Medium/Weak” and “Support — Strong/Medium/Weak.”
* **Pre-Breakout Staging:** Semi-transparent background fills show upcoming breakout windows to help you prepare.
* **Fully Customizable:** User inputs for fractal lengths, energy smoothing, prediction bars, confidence thresholds, and label sizing.
* **Non-Repainting Logic:** All signals are evaluated on bar close to ensure historical consistency.
**Inputs & Controls:**
• Primary/secondary/tertiary fractal lengths
• Quantum energy smoothing and time-weight ratios
• Prediction bars ahead & confidence threshold
• Toggle fractal boxes, staging zones, and labels
• Label text size and color transparency
Resistance boxes (res_col):
Red = Strong breakdown potential (quantum_energy > 0.7)
Orange = Medium potential (0.5 < quantum_energy ≤ 0.7)
Yellow = Weak potential (quantum_energy ≤ 0.5)
Support boxes (sup_col):
Lime = Strong breakout potential (quantum_energy > 0.7)
Green = Medium potential (0.5 < quantum_energy ≤ 0.7)
Blue = Weak potential (quantum_energy ≤ 0.5)
**Usage & Disclaimer:**
This indicator is designed to help spot potential breakout areas—it does **not** guarantee future performance. Always backtest and use proper risk management. By using QBS, you acknowledge that @profitgang and TradingView are not responsible for any trading outcomes.
Happy trading!

Quantum Tick Flow# Quantum Tick Flow (QTF) - Advanced Momentum Oscillator
**Author: profitgang**
## Overview
The Quantum Tick Flow indicator is a sophisticated momentum oscillator that analyzes tick-by-tick price movements using proprietary algorithms. Unlike traditional oscillators, QTF combines multiple innovative approaches to identify high-probability entry and exit points while filtering out market noise.
## Key Features
### 🔬 **Tick Velocity Analysis**
- Uses fractional power scaling (0.7 exponent) combined with volume weighting
- Creates non-linear response to price changes for enhanced sensitivity to meaningful moves
- Differentiates between genuine momentum and random price fluctuations
### ⚡ **Adaptive Threshold System**
- Dynamic thresholds that automatically adjust to current market volatility
- Uses ATR-based scaling to maintain consistent signal quality across different market conditions
- Prevents over-trading in low volatility and under-trading in high volatility environments
### 🌊 **Flow Pressure Index**
- Proprietary calculation measuring upward vs downward market pressure
- Analyzes cumulative tick velocity to gauge underlying market sentiment
- Provides early warning signals for potential trend reversals
### 🎯 **Anti-Noise Filtering**
- Multi-condition verification system reduces false signals
- Incorporates momentum convergence analysis
- Filters out choppy market conditions automatically
## How It Works
The indicator operates on several layers:
1. **Fast and Slow Flow Analysis**: Calculates exponential moving averages of tick velocity at different timeframes
2. **Flow Differential**: Measures the difference between fast and slow flows to identify momentum shifts
3. **Pressure Calculation**: Evaluates the ratio of bullish vs bearish pressure over specified periods
4. **Convergence Oscillator**: Uses mathematical approximation functions to create bounded, smooth signals
## Signal Generation
- **BUY Signals**: Generated when flow momentum is positive, pressure ratio exceeds 1.2, and oscillator is rising above adaptive thresholds
- **SELL Signals**: Triggered when flow momentum turns negative, pressure drops below 0.8, and oscillator falls below negative thresholds
## Visual Elements
- **Main Oscillator Line**: Primary signal line with color-coded momentum
- **Dynamic Threshold Lines**: Automatically adjusting support/resistance levels
- **Flow Zones**: Background coloring indicating bullish/bearish market conditions
- **Information Table**: Real-time statistics including current signal, flow value, momentum direction, and volatility metrics
## Settings
- **Fast Tick Period** (3-50): Controls sensitivity of short-term analysis
- **Slow Tick Period** (10-100): Sets baseline for longer-term trend detection
- **Momentum Convergence Period** (5-50): Defines momentum calculation timeframe
- **Flow Sensitivity** (0.5-5.0): Adjusts overall indicator responsiveness
- **Noise Filter** (0.1-1.0): Controls signal filtering strength
## Best Practices
1. Use in conjunction with trend analysis tools for confirmation
2. Higher timeframes generally produce more reliable signals
3. Adjust sensitivity based on asset volatility and trading style
4. Monitor the pressure index for early trend change warnings
5. Consider market context when interpreting signals
## Unique Advantages
- **No Repainting**: All calculations are based on confirmed price data
- **Multi-Dimensional Analysis**: Combines price, volume, and momentum in novel ways
- **Adaptive Nature**: Automatically adjusts to changing market conditions
- **Low Latency**: Responds quickly to genuine market moves while filtering noise
## Disclaimer
This indicator is for educational and informational purposes only. Past performance does not guarantee future results. Always conduct your own analysis and consider risk management before making trading decisions.
---
*Developed by profitgang - For questions and updates, follow on TradingView*
**License**: This script is open source under Mozilla Public License 2.0. Feel free to use and modify for personal trading, but please credit the original author.

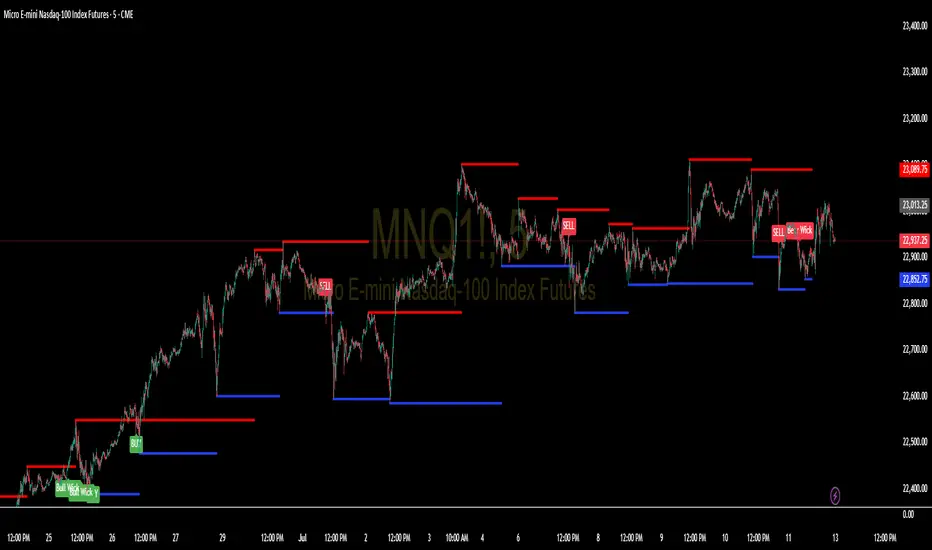
Support and Resistance Levels with BreaksThis indicator identifies dynamic support and resistance levels using pivot point analysis and provides clear trading signals when these levels are broken with volume confirmation. Enhanced version with improved signal clarity for better trading decisions.
## 🔧 Key Features
### Support & Resistance Detection
- Automatically identifies key pivot high and low levels
- Draws clear visual lines (red for resistance, blue for support)
- Configurable sensitivity with left/right bar settings
### Enhanced Trading Signals
- **BUY** signals when resistance is broken with volume confirmation
- **SELL** signals when support is broken with volume confirmation
- **Bull Wick** alerts for potential reversals at resistance
- **Bear Wick** alerts for potential reversals at support
### Volume Confirmation
- Built-in volume oscillator using 5 and 10-period EMAs
- Filters out low-volume false breakouts
- Adjustable volume threshold (default: 20%)
### Complete Alert System
- Support Broken alerts
- Resistance Broken alerts
- Bull Wick reversal alerts
- Bear Wick reversal alerts
## ⚙️ Settings
- **Show Breaks**: Toggle signal display
- **Left Bars**: Pivot detection lookback (default: 15)
- **Right Bars**: Pivot detection lookforward (default: 15)
- **Volume Threshold**: Minimum volume increase for valid signals (default: 20%)
## 📈 Best For
- Swing trading strategies
- Breakout confirmation
- Support/resistance trading
- Volume-based entry signals
## 🔍 How It Works
1. Identifies pivot highs/lows using configurable periods
2. Calculates volume oscillator for confirmation
3. Generates BUY signals on resistance breaks with volume
4. Generates SELL signals on support breaks with volume
5. Detects wick patterns for potential reversals
## 📋 Updates in This Version
- Enhanced BUY/SELL signal clarity (replaced generic "B" labels)
- Added Bull Wick and Bear Wick alert conditions
- Updated to Pine Script v6 compatibility
- Improved signal filtering and accuracy
## ⚠️ Disclaimer
This indicator is for educational and informational purposes only. Always conduct your own analysis and risk management before making trading decisions. Past performance does not guarantee future results.
---
**Original Script**: "Support and Resistance Levels with Breaks" by LuxAlgo
**License**: CC BY-NC-SA 4.0
**Enhanced by**: profitgang
**Version**: Pine Script v6
Futures Support & Resistance LevelsMulti-Timeframe Support & Resistance Levels for Futures Trading
Description:
This indicator automatically identifies and displays key support and resistance levels using multiple technical analysis methods. Designed specifically for futures traders (ES, NQ, etc.), it provides a clean, organized view of important price levels.
Key Features:
Multiple Detection Methods: Combines pivot points, daily ranges, and psychological levels
Smart Ranking System: Levels are numbered by strength (1 = strongest)
Clean Visualization: Extended lines across the chart with clear price labels
Confluence Detection: Highlights areas where multiple levels converge
Customizable Display: Adjust colors, line styles, and label sizes
Level Types Identified:
Daily High/Low (current session)
Previous Daily High/Low
Pivot-based Support/Resistance
Psychological Round Numbers
Confluence Zones (multiple levels clustering)
Technical Approach:
The indicator uses a strength-scoring algorithm to rank levels by importance. Daily levels receive the highest weighting (2.0), followed by previous daily levels (1.5), pivot points (1.0), and psychological levels (0.5). This helps traders focus on the most significant levels.
Visual Elements:
Solid lines = Strong levels
Dashed lines = Medium levels
Dotted lines = Weak levels
Optional technical condition markers for educational analysis
Best Used For:
Identifying key intraday levels for futures trading
Finding high-probability reversal zones
Setting logical stop-loss and take-profit levels
Recognizing confluence areas for stronger setups
Note:
This is a technical analysis tool for educational purposes. No indicator can predict future price movements. Always use proper risk management and combine with other forms of analysis.

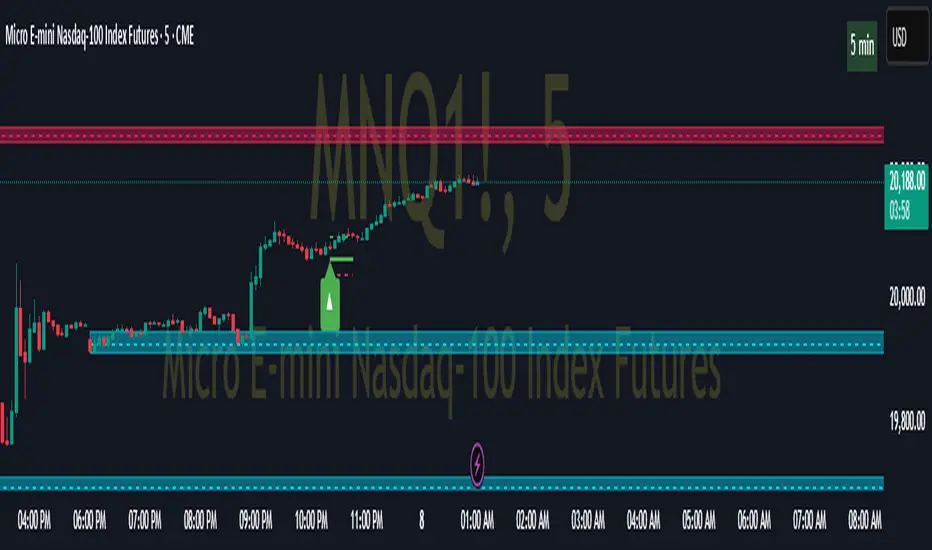
Pivot ATR Zones [v6]🟩 Pivot ATR Zones
Overview:
The Pivot ATR Zones indicator plots dynamic support and resistance zones based on pivot highs and lows, combined with ATR (Average True Range) volatility levels. It helps traders visually identify potential long and short trade areas, along with realistic target and stop loss zones based on market conditions.
Features:
Automatically detects pivot highs and lows
Draws ATR-based entry zones on the chart
Plots dynamic take-profit and stop-loss levels using ATR multipliers
Color-coded long (green) and short (red) zones
Entry arrow markers for clearer trade visualization
Real-time alerts when new zones form
Best For:
Scalpers, intraday traders, and swing traders who want a visual, volatility-aware way to mark potential trade areas based on key pivot structures.
How to Use:
Look for newly formed green zones for long opportunities and red zones for short setups.
Use the dashed lines as dynamic take-profit and stop levels, tuned to the current ATR value.
Combine with other confirmation tools or indicators for optimal results.
Profit Guard ProProfitGuard Pro
ProfitGuard Pro is a risk management and profit calculation tool that helps traders optimize their trades by handling position sizing, risk management, leverage, and take profit calculations. With support for both cumulative and non-cumulative take profit strategies, this versatile indicator provides the insights you need to maximize your trading strategy.
How to Use ProfitGuard Pro:
Load the Indicator: Add ProfitGuard Pro to your chart in TradingView.
Set Your Entry Position: Input your desired entry price.
Define Your Stop Loss: Enter the price at which your trade will exit to minimize losses.
Add Take Profit Levels: Input your TP1, TP2, TP3, and TP4 levels, as needed.
If you want fewer take profit levels, adjust the number of TPs in the settings menu. You can choose between 1 to 4 take profit levels based on your strategy.
Adjust Risk Settings: Specify your account size and risk percentage to calculate position size and leverage.
Choose Cumulative or Non-Cumulative Mode: Toggle cumulative profit mode to either recalculate position sizes as each take profit is hit or keep position sizes static for each TP.
Once set up, ProfitGuard Pro will automatically calculate your position size, leverage, and potential profits for each take profit level, providing a clear visual on your chart to guide your trading decisions.
Key Features:
Risk Management:
Calculate your risk percentage based on account size and stop loss.
Visualize risk in dollar terms and percentage of your account.
Position Size & Leverage:
Automatically calculate the ideal position size and leverage for your trade based on your entry, stop loss, and risk settings.
Ensure you are trading with the appropriate leverage for your account size.
Cumulative vs Non-Cumulative Profit Mode:
Cumulative Mode: Adjusts position size after each take profit is reached, recalculating for remaining contracts.
Non-Cumulative Mode: Treats each take profit as a separate calculation using the full position size.
Take Profit Levels:
Set up to 4 customizable take profit levels.
Adjust percentage values for each TP target, and visualize them on your chart with easy-to-read lines.
Profit Calculation:
Displays potential profits for each take profit level based on whether cumulative or non-cumulative mode is selected.
Calculate your risk-reward ratio dynamically at each TP.
Customizable Visuals:
Easily customize the table's size, position, and color scheme to fit your chart.
Visualize key trade details like leverage, contracts, margin, and profits directly on your chart.
Short and Long Position Support:
Automatically adjusts calculations based on whether you're trading long or short.

Profit-sync with Trexen StratThere are various scripts and indicators on Tradingview, but not many of them combine theories to improve the profitability of an indicator using settings from multiple time frames.
This script takes the Average True Range trailing exit idea to enter trades. Many other ideas have been tested to filter entry signals which may be weak or not profitable such as a second ATR with Higher TF, MFI/VFI, RSI , Momentum wavetrend, Weis Wave, MACD , Stochastic etc, but I felt the following works best:
- Over the ATR entries there is a directional filter very similar to Renko candles which can be set to a higher time frame, I use 4 hour with 15 min candles for example, this will only allow 15 min buy signals to execute if the 4 hour is also on the buy side.
- There is also a Trend directional filter which can be set to a higher/lower time frame, currently I am using this on allow setting to allow more trades
The higher both filter are, the more accurate the trades will be, but less frequent. The filters convert entry signals into exit signal which can be used as take profit point with alerts if there is a position open.
The overall theory is to follow trend and to exit with profit. I have tested different take profit alerts but think it’s better to either catch a whole price move or sell with a set trailing limit order at like 0.4/0.5%.
As I am trading BTC with a bot and not with TA I think it is good to get in on a trend reversal, follow the trend up and get out quick with profit. There is a lot of manipulation with crypto so things like Momentum indicators and money-flow may not represent what is actually happening in the market.

Profit-sync script for TrexenThere are various scripts and indicators on Tradingview, but not many of them combine theories to improve the profitability of an indicator using settings from multiple time frames.
This script takes the Average True Range trailing exit idea to enter trades. Many other ideas have been tested to filter entry signals which may be weak or not profitable such as a second ATR with Higher TF, MFI/VFI, RSI, Momentum wavetrend, Weis Wave, MACD, Stochastic etc, but I felt the following works best:
- Over the ATR entries there is a directional filter very similar to Renko candles which can be set to a higher time frame, I use 4 hour with 15 min candles for example, this will only allow 15 min buy signals to execute if the 4 hour is also on the buy side.
- There is also a Trend directional filter which can be set to a higher/lower time frame, currently I am using this on allow setting to allow more trades
The higher both filter are, the more accurate the trades will be, but less frequent. The filters convert entry signals into exit signal which can be used as take profit point with alerts if there is a position open.
The overall theory is to follow trend and to exit with profit. I have tested different take profit alerts but think it’s better to either catch a whole price move or sell with a set trailing limit order at like 0.4/0.5%.
As I am trading BTC with a bot and not with TA I think it is good to get in on a trend reversal, follow the trend up and get out quick with profit. There is a lot of manipulation with crypto so things like Momentum indicators and money-flow may not represent what is actually happening in the market.

Profit Trailing BBandsProfit Trailing Trend BBands v4.7.5 with Double Trailing SL
A TradingView Pine Script Strategy
Created by Kevin Bourn and refined with the help of Grok 3 (xAI)
Overview
Welcome to Profit Trailing Trend BBands v4.7.5, a dynamic trading strategy designed to ride trends and lock in profits with a unique double trailing stop-loss mechanism. Built for TradingView’s Pine Script v6, this strategy combines Bollinger Bands for trend detection with a smart trailing system that doubles down on profit protection. Whether you’re trading XRP or any other asset, this tool aims to maximize gains while keeping risk in check—all with a clean, visual interface.
What It Does
Identifies Trends: Uses Bollinger Bands to spot uptrends (price crossing above the upper band) and downtrends (price crossing below the lower band).
Enters Positions: Opens long or short trades based on trend signals, with customizable position sizing and leverage.
Trails Profits: Employs a two-stage trailing stop-loss:
Initial Trailing SL: Acts as a take-profit level, set as a percentage (%) or dollar ($) distance from the entry price.
Tightened Trailing SL: Once the initial profit target is hit, the stop-loss tightens to half the initial distance, locking in gains as the trend continues.
Manages Risk: Includes a margin call feature to exit losing positions before they blow up your account.
Visualizes Everything: Plots Bollinger Bands (blue upper, orange lower) and a red stepped trailing stop-loss line for easy tracking.
Why Built It?
Captures Trends: Bollinger Bands are a proven way to catch momentum, and we tuned them for responsiveness (short length, moderate multiplier).
Secures Profits: Traditional trailing stops often leave money on the table or exit too early. The double trailing SL first takes a chunk of profit, then tightens up to ride the rest of the move.
Stays Flexible: Traders can tweak price sources, stop-loss types (% or $), and position sizing to fit their style.
Looks Good: Clear visuals help you see the strategy in action without cluttering your chart.
Originally refined for XRP, it’s versatile enough for most markets — crypto, forex, stocks, you name it.
How It Works
Core Components
Bollinger Bands:
Calculated using a simple moving average (SMA) and standard deviation.
Default settings: 6-period length, 1.66 multiplier.
Upper Band (blue): SMA + (1.66 × StdDev).
Lower Band (orange): SMA - (1.66 × StdDev).
Trend signals: Price crossing above the upper band triggers a long, below the lower band triggers a short.
Double Trailing Stop-Loss:
Initial SL: Set via "Trailing Stop-Loss Value" (default 6% or $6). Trails the price at this distance and doubles as the first profit target.
Tightened SL: Once price hits the initial SL distance in profit (e.g., +6%), the SL tightens to half (e.g., 3%) and continues trailing, locking in gains.
Visualized as a red stepped line, only visible during active positions.
Position Sizing:
Choose "% of Equity" (default 30%) or "Amount in $" to set trade size.
Leverage (default 10x) amplifies positions, capped by available equity to avoid overexposure.
Margin Call:
Exits positions if drawdown exceeds the "Margin %" (default 10%) to protect your account.
Backtesting Filter:
Starts trading after a user-defined date (default: Jan 1, 2020) for focused historical analysis.
Trade Logic
Long Entry: Price crosses above the upper Bollinger Band → Closes any short position, opens a long.
Short Entry: Price crosses below the lower Bollinger Band → Closes any long position, opens a short.
Exit: Position closes when price hits the trailing stop-loss or triggers a margin call.
How to Use It
Setup
Add to TradingView:
Open TradingView, go to the Pine Editor, paste the script, and click "Add to Chart."
Ensure you’re using Pine Script v6 (the script includes @version=6).
Configure Inputs:
Start Date for Backtesting: Set the date to begin historical testing (default: Jan 1, 2020).
BB Length & Mult: Adjust Bollinger Band sensitivity (default: 6, 1.66).
BB Price Source: Choose the price for BBands (default: Close).
Trend Price Source: Choose the price for trend detection (default: Close).
Trailing Stop-Loss Type: Pick "%" or "$" (default: Trailing SL %).
Trailing Stop-Loss Value: Set the initial SL distance (default: 6).
Margin %: Define the max drawdown before exit (default: 10%).
Order Size Type & Value: Set position size as % of equity (default: 30%) or $ amount.
Leverage: Adjust leverage (default: 10x).
Run It:
Use the Strategy Tester tab to backtest on your chosen asset and timeframe.
Watch the chart for blue/orange Bollinger Bands and the red trailing SL line.
Tips for Traders
Timeframes: Works on any timeframe, but test 1H or 4H for XRP—great balance of signals and noise.
Assets: Optimized for XRP, but tweak slValue and mult for other markets (e.g., tighter SL for low-volatility pairs).
Risk Management: Keep marginPercent low (5-10%) for volatile assets; adjust leverage based on your risk tolerance.
Visuals: The red stepped SL line shows only during trades—zoom in to see its tightening in action.
Visuals on the Chart
Blue Line: Upper Bollinger Band (trend entry for longs).
Orange Line: Lower Bollinger Band (trend entry for shorts).
Red Stepped Line: Trailing Stop-Loss (shifts tighter after the first profit target).
Order Labels: Short tags like "OL" (Open Long), "CS" (Close Short), "LSL" (Long Stop-Loss), etc., mark trades.
Disclaimer
Trading involves risk. This strategy is for educational and experimental use—backtest thoroughly and use at your own risk. Past performance doesn’t guarantee future results. Not financial advice—just a tool from traders, for traders.

PROFIT ZONE PRO Profit Zone Pro:
ProfitZone Pro is a risk-reward indicator that helps traders identify trade setups, manage risk, and set profit targets. Designed for simplicity, this free tool generates entry, stop-loss, and take-profit levels based on support and resistance, Trailing Stoploss and built in automated alerts, with additional features to enhance trade planning, Along with a learning mode based on successful trades made
Features
Trade Setup Identification: Detects potential buy (long) or sell (short) entries using support and resistance levels, with an optional trend filter based on a 50-period SMA.
Risk-Reward Zones: Displays entry (yellow), stop-loss (red), and take-profit (green) levels, with shaded risk (red) and reward (green) zones.
Position Sizing: Calculates position size based on user-defined risk percentage and account balance.
Breakeven and Trailing Stop: Includes a breakeven feature to move the stop-loss to the entry price at a user-defined percentage of the take-profit distance, and an optional trailing stop to lock in profits.
Confidence Score: Provides a volatility-based confidence score (0-100%) to assess setup reliability.
Learning Adjustment: Adjusts stop-loss distances based on the number of successful trades entered by the user.
Info Label: Shows position size, risk, reward, direction, confidence score, ATR, trend direction (if enabled), and trailing stop status.
Alerts: Sends notifications for entry, stop-loss, take-profit, breakeven, trailing stop, and theme changes.
Customizable Display: Offers options for zone opacity, line styles (solid, circles, dotted), zone labels, and color themes (Light, Dark, Custom).
Long Mode Feature:
Short Mode Feature:
Trend Filter Feature:
Auto Trading Mode:
Usage Instructions
Add the indicator to your chart.
Adjust settings in the indicator’s properties:
Set Risk % of Account and Account Balance to define your risk and position size.
Choose Trade Direction (Auto, Long, or Short) to filter setups.
Enable Trend Filter to align trades with the market trend.
Turn on Trailing Stop and set Trailing Stop % of Reward to lock in profits.
Customize visuals (zone opacity, line style, colors) as needed.
Monitor the chart for entry (yellow), stop-loss (red), and take-profit (green) levels.
Use the info label to view position size, risk, reward, confidence score, and other details.
Set alerts for entry, stop-loss, take-profit, breakeven, and trailing stop events.
After a successful trade, increment Number of Successful Trades to adjust future stop-loss distances.
This Script is to help you have a better idea on those famous questions we ask ourselves:
Entry
Take Profit
Stoploss
The confidence score, R:R calculator, Trend Filter, Learning Mode further helps to zone in on accuracy
Happy Trading
- EZ ALGO
