BTI - TradingThis is an invite-only indicator that I use in my own daily trading.
The script is NOT a buy/sell signal.
It is designed to support decision-making, not replace it.
Purpose of the script:
market structure confirmation
volume & footprint context
support disciplined execution
❌ No automated entries
❌ No profit promises
❌ No holy grail
All trading decisions remain 100% the trader’s responsibility.
Access is manual (invite-only) and can be revoked at any time.
During the early BTI community phase, access may be granted free of charge.
⚠️ Disclaimer:
Trading involves risk.
This tool is for educational purposes only and is not financial advice.
Community & discussion:
👉 linktr.ee
Penunjuk dan strategi

Crypto Market Sessions (Indian Time)Crypto Market Sessions (Indian Time) is a simple and clean indicator
designed for crypto traders who want to track major global market
sessions based on Indian Standard Time (UTC+05:30).
This indicator highlights the start and end of the following sessions:
• Asia Session
• UK / Europe Session
• USA Session
Each session start and end is marked with a vertical line and label,
making it easy to identify session breaks, market transitions,
and potential volatility periods.
Key Features:
• Indian Standard Time (IST) based session calculation
• Works on all crypto pairs and timeframes
• Clearly marks session start and end points
• No repainting
• Lightweight and easy to use
• Suitable for intraday and swing traders
This indicator does not use any future data and works in real time,
making it safe for live trading and analysis.
If you want any updates, improvements, or custom changes, you can contact me through my TradingView profile .

Medium-term TrendThis indicator is based on Larry Williams' pivot point definitions from his book Long-Term Secrets to Short-Term Trading. A short-term low refers to a day’s low price that is lower than those of its preceding and following days. A mid-term low is a short-term low that sits lower than the short-term lows before and after it. Conversely, a short-term high is a day’s high price higher than its adjacent days’ highs, and a mid-term high is a short-term high that is higher than the short-term highs around it. Long-term pivot points are derived from mid-term ones following the same logic.
I will add alerts and strategy signals in future updates.
This tool is intended for educational purposes only and not for live trading decisions.


MSP Multi-Time Frame Dashboard A precision market-context overlay for traders who need fast multi-timeframe clarity.
This dashboard displays trend, momentum, bias and RSI across four user-selectable timeframes — giving you a full market read at a glance, without flipping charts or manually analysing each timeframe.
Key Features
4-TF visual dashboard (fully user-configurable)
Trend bias via EMA structure (21/55 default)
Momentum bias via RSI thresholds (Bull >60 / Bear <40)
Per-TF bias score (–2 to +2)
Combined Total Bias score (–8 to +8) with emoji + word label
Bias strength bar meter for instant context
Background-color market sentiment shading
Built-in alignment alert conditions (Bull/Bear total-bias triggers)
How the engine reads the market
Each timeframe is processed individually:
Metric Method Output
Trend Fast vs Slow EMA 🟢 / 🔴 / 🟡
Momentum RSI regime 📈 / 📉 / ➖
Bias Trend + Momentum −2 → +2 per TF
Total Bias Sum of all TF scores Market direction & strength
Bullish Alignment = multiple TFs trending + RSI holding strength
Bearish Alignment = EMAs stacked down + weak RSI environment
Mixed/Chop = conflict between momentum + structure
This keeps you away from low-quality reversals and favours trades in the direction of flow.
🏁 Best used for
✔ Scalpers confirming higher-TF direction
✔ Daytraders timing entries with momentum shifts
✔ Swing traders filtering chop vs trend continuation
✔ System traders needing rule-based directional context
❗ Not a standalone entry system — context tool only
🔔 Alerts Included
Bullish Alignment Trigger → TotalBias ≥ threshold
Bearish Alignment Trigger → TotalBias ≤ threshold
Set once — get notified when the market syncs into opportunity.

Options SL/TP Price Projection Sim + Day Trading/Scalping Toolwww.tradingview.com
📌 What this indicator does
This indicator projects what your option contract will be worth when the stock reaches your Stop Loss or Take Profit — before price gets there.
Instead of guessing:
“How much will this option be worth if price hits my stop?”
“Is this move actually worth the risk in option dollars?”
You get instant, realistic option price estimates at your exact stock levels.
⚙️ How it works (simple but powerful)
The script uses a local delta + gamma approximation to estimate option price changes:
Delta → linear price sensitivity
Gamma → curvature for fast moves
Optional execution friction → realistic fills
Automatic Call / Put detection via delta sign
Enforced $0.01 minimum option price (real market behavior)
This is not a slow academic options model — it’s a trader-grade approximation designed for speed and clarity.
🚀 Designed specifically for DAY TRADING
This tool is optimized for:
Options scalping
Momentum trades
Breakouts & flushes
0DTE / weekly options
Holding times ~3–15 minutes
Why it excels here:
Delta + gamma dominate option pricing on fast moves
IV and theta usually don’t have time to fully reprice
You get actionable numbers, not theoretical noise
This is exactly the environment most option day traders operate in.
🧠 Key Features
✅ Projects option price at BOTH SL and TP
✅ Works for calls & puts automatically
✅ Enter any two stock levels — script assigns SL/TP correctly
✅ Clean, black HUD table (no clutter, no moving drawings)
✅ Non-draggable, stable price levels
✅ Minimal inputs — no overengineering
✅ Built for speed under pressure
🎯 Why this is effective
Most traders manage risk in stock points , but trade options .
This indicator bridges that gap.
It lets you:
Judge true risk/reward in option dollars
Avoid “looks good on the chart, bad on the premium”
Compare setups objectively
Size trades more intelligently
Make faster, more confident decisions
It’s especially useful when spreads, gamma, and fast tape make intuition unreliable.
🧼 Philosophy: Clean > Complicated
This script intentionally avoids:
Full Black-Scholes modeling
IV forecasting
Overloaded settings
Visual clutter
Instead, it focuses on what matters for day traders:
“If price gets here quickly, what should my option be worth?”
⚠️ Important Notes
Best accuracy for fast, clean moves
Not intended for multi-hour holds or swing trading
Assumes relatively stable IV over short horizons
Execution friction is configurable to match real fills
Used correctly, this becomes a powerful decision-support tool, not a prediction engine.
✅ Who this indicator is for
Options day traders
Scalpers
Momentum traders
Anyone trading options off stock price levels
If you trade options intraday and manage risk using stock levels, this tool was built exactly for you.

Candlestick Pattern Strategy with Risk Management + AlertsThis strategy is built to detect volatility-driven squeeze expansion moves and automatically backtest both Breakout Longs and Breakdown Shorts with adjustable take-profit, stop-loss and volume confirmation filters.
It includes a built-in Auto-Optimizer, allowing the script to test multiple TP/SL/RSI/Volume profiles and automatically select the best configuration for the current market environment. Works across Stocks, Crypto and Forex — with each market automatically adjusting core system parameters.
🚀 Strategy Features
Feature Description
🔥 Long + Short Squeeze Detection Entries triggered by volatility expansion + BB break + strong momentum
⚙️ Auto-Optimizer Searches multiple TP/SL/RSI/Volume settings & selects best performer
📈 Full Backtest-Ready Strategy Includes stops, take profits + built-in performance table
🔔 Real-Time Alerts Get alerted instantly when a long or short squeeze event forms
🔄 Multi-Market Mode Tailored volatility & smoothing settings for Stocks / Crypto / Forex
🧠 Vol Spike Validation Filters signals using relative volume impulse
🏁 Trade Exit Logic Dynamic SL/TP calculated automatically based on optimized parameters
📊 How It Works
Detects breakouts above upper Bollinger band or breakdowns below lower band
Confirms strength using ATR expansion + Volume Surge
Confirms momentum using RSI selection (9/14/20 based on profile)
Enters Long/Short squeeze trade depending on breakout direction
Risk management automatically deploys TP + SL, optimized or manual
Displays performance statistics after backtest execution
🧬 Auto-Optimizer Logic
If Optimizer Mode = ON, the script tests:
Variable Range Tested
TP % 8 → 15%
SL % 4 → 8%
Volume Spike Filter 1.5 → 3.0x
RSI Window 9 / 14 / 20
The configuration that produces the highest score becomes active automatically for signals + backtest.
🛎 Alerts Included
🔥 Long Squeeze Alert
💀 Short Squeeze Alert
You can create TradingView alerts using → Add Alert → ANY alert() function call
Recommended Use
✔ Backtest system performance across assets
✔ Use Optimizer mode to find ideal TP/SL profiles
✔ Enable alerts for real-time squeeze entries
✔ Works best on 1h / 4h / 1D timeframes
🚫 Not financial advice — for research + strategy development only

GruxxFX EMA Rejection + SMC Bias Kit v7 w/TPs and SLGruxxFX EMA Rejection + SMC Bias Kit (v7)
is my private intraday indicator that helps me stop guessing and only take setups when the chart is actually lined up.
It does two jobs:
1) Finds the market “bias” with structure (SMC)
It marks BOS / CHoCH off swing highs/lows and uses that as permission. Structure isn’t the entry — it just tells me if I should be looking for buys or sells for the next X bars.
2) Triggers entries with EMA rejection
Once bias is active, entries only fire when price rejects the EMAs (and you can require candle confirmation). Sells are anchored to EMA 50 (no EMA 20 sells), so it doesn’t spam weak shorts.
It also includes a clean trade manager:
Tracks position state (so it knows if you’re in/out)
Draws SL + TP1 + TP2 levels using ATR risk
Optional “trade open” tag and alerts for entries + SL/TP hits
It’s meant to be simple on the chart, fast for scalps, and consistent — especially on 1m/5m/15m.
Not financial advice. Use risk management and don’t trade into major news.

S3Services MACD + RSI (with RSI value table)This is created by S3Services, works on multi time frame.

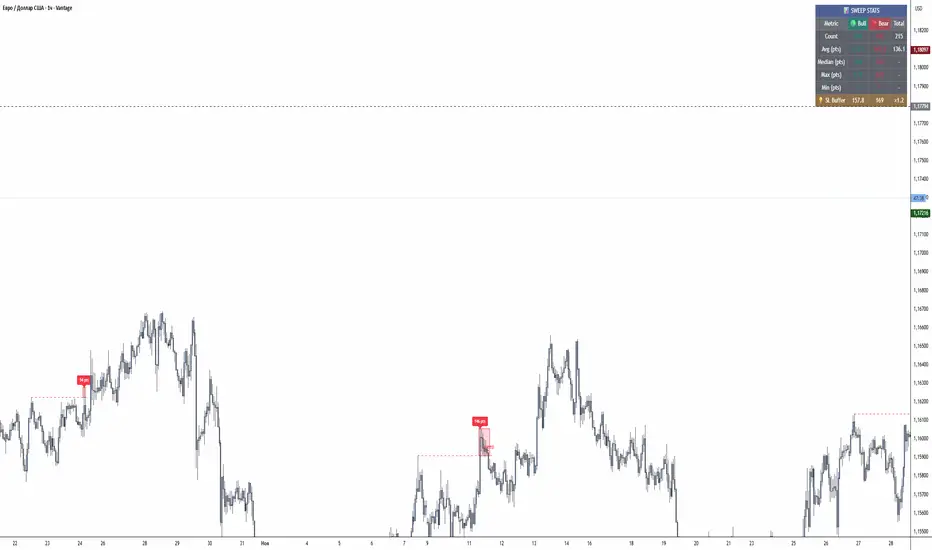
Sweep AnalyzerA comprehensive liquidity sweep detection indicator that identifies false breakouts (sweeps) of swing highs and lows, measures their depth, and provides statistical analysis to help optimize stop-loss placement.
🎯 Overview
This indicator is designed for traders who use Smart Money Concepts (SMC), ICT methodology, or price action strategies. It automatically detects when price “sweeps” (falsely breaks) key swing levels and returns back, which often indicates liquidity grabs by institutional traders.
The unique feature of this indicator is its ability to measure the depth of each sweep in points/pips and calculate statistics, helping you understand how far price typically goes beyond levels before reversing. This data is invaluable for setting optimal stop-loss distances.
⚙️ Features & Settings Explained
Settings Group
Cooldown Period (bars) — Minimum number of bars between sweep signals. Prevents multiple signals in the same area. Default: 10
Show Statistics Table — Toggle the statistics panel on/off
Table Position — Choose corner placement: Top Left, Top Right, Bottom Left, Bottom Right
Table Size — Small, Normal, or Large text size for the table
Pivot Settings
Pivot Left Bars — Number of bars to the left required to confirm a swing point. Higher values identify more significant levels. Default: 20
Pivot Right Bars — Number of bars to the right required to confirm a swing point. Default: 20
How it works: A swing high is confirmed when the high is higher than all bars within the left AND right lookback period. Same logic applies for swing lows (lowest of the range).
Sweep Detection
Sweep Lookback (bars ) — How far back to look for valid swing levels to sweep. Default: 100
Strict Mode (original logic) — When enabled, uses the original SFP (Swing Failure Pattern) detection which requires specific candle patterns. When disabled, uses enhanced detection that tracks multi-bar sweeps.
Enhanced Mode (Strict Mode OFF):
→ Detects sweeps that develop over multiple bars
→ Price can stay beyond the level for several candles
→ Tracks the deepest point reached during the sweep
→ More flexible and catches more setups
Strict Mode (ON):
→ Classic SFP detection
→ Requires price to sweep and close back in one move
→ More conservative, fewer but higher-quality signals
Sweep Filters
Max Bars in Sweep — Maximum bars price can stay beyond the level. If exceeded, it’s considered a breakout, not a sweep. Default: 10
Max Sweep Depth (ATR multiplier) — Maximum sweep depth as ATR multiple. Sweeps deeper than this are filtered out as breakouts. Default: 3.0
ATR Length — Period for ATR calculation used in filters. Default: 14
If price goes too deep beyond a level or stays there too long, it’s likely a real breakout, not a liquidity sweep. These filters prevent false signals during trending markets.
Sweep Confirmation
Confirmation Bars — How many consecutive bars price must close back beyond the level to confirm the sweep. Default: 2
Min Return Depth (ATR mult) — Minimum distance price must return beyond the level (as ATR multiple) to count as valid return. Default: 0.3
📊 Statistics Table
The table displays real-time statistics for all detected sweeps:
Count — Total number of sweeps detected (Bull/Bear/Total)
Avg (pts) — Average sweep depth in points. This is the key metric for SL placement
Median (pts) — Median sweep depth, useful when you have outliers
Max (pts) — Deepest sweep recorded
Min (pts) — Shallowest sweep recorded
SL Buffer — Suggested stop-loss distance (Average × 1.2)
⚠️ Important Notes
Point Calculation: The indicator automatically detects instrument type. For Forex with 5 decimals it displays in pipettes (multiply by 0.1 for pips). For Forex with 4 decimals it displays in pips. For other instruments it displays in points.
Historical Data: Statistics are calculated from all visible chart data. Scroll left to include more history for better averages.
Timeframe Matters: Sweep characteristics vary by timeframe. Run the indicator separately on each TF you trade.
Not Financial Advice: This indicator is a tool for analysis. Always combine with other confluence factors and proper risk management.
🔔 Alerts
Two alert conditions are available:
→ Bullish Sweep: Triggers when a bullish sweep is confirmed
→ Bearish Sweep: Triggers when a bearish sweep is confirmed
Set up alerts via TradingView’s alert menu for real-time notifications.
💡 Pro Tips
→ Start with defaults and adjust based on your instrument/timeframe
→ Increase Pivot bars (25-30) for higher timeframes to catch more significant levels
→ Decrease Max Bars in Sweep (5-7) for scalping to filter slow moves
→ Use Strict Mode if you want fewer but more reliable signals
→ Compare median vs average — if very different, you have outliers affecting your SL calculation
--------------------------------------------------------------------------------
Комплексный индикатор для определения свипов ликвидности (ложных пробоев) свинг-хаев и свинг-лоу. Измеряет глубину каждого свипа и предоставляет статистический анализ для оптимизации размещения стоп-лоссов.
🎯 Обзор
Индикатор разработан для трейдеров, использующих концепции Smart Money (SMC), методологию ICT или стратегии Price Action. Он автоматически определяет моменты, когда цена “свипает” (ложно пробивает) ключевые свинг-уровни и возвращается обратно, что часто указывает на сбор ликвидности институциональными игроками.
Уникальная особенность индикатора — измерение глубины каждого свипа в пунктах/пипсах и расчёт статистики. Это помогает понять, как далеко цена обычно заходит за уровень перед разворотом. Эти данные бесценны для установки оптимального расстояния стоп-лосса.
⚙️ Описание функций и настроек
Основные настройки (Settings)
Strict Mode — Включает строгий режим с оригинальной логикой SFP. При выключении используется расширенное определение многобаровых свипов.
Cooldown Period (bars) — Минимальное количество баров между сигналами свипа. Предотвращает множественные сигналы в одной области. По умолчанию: 10
Show Statistics Table — Включить/выключить панель статистики
Table Position — Выбор угла размещения: Top Left, Top Right, Bottom Left, Bottom Right
Table Size — Размер текста таблицы: Small, Normal, Large
Настройки пивотов (Pivot Settings)
Pivot Left Bars — Количество баров слева, необходимое для подтверждения свинг-точки. Большие значения определяют более значимые уровни. По умолчанию: 20
Pivot Right Bars — Количество баров справа, необходимое для подтверждения свинг-точки. По умолчанию: 20
Как работает: Свинг-хай подтверждается, когда максимум свечи выше всех баров в пределах левого И правого периода просмотра. Та же логика применяется для свинг-лоу (минимум диапазона).
Определение свипа (Sweep Detection)
Sweep Lookback (bars) — Как далеко назад искать валидные свинг-уровни для свипа. По умолчанию: 100
Расширенный режим (Strict Mode ВЫКЛ):
→ Определяет свипы, развивающиеся на нескольких барах
→ Цена может оставаться за уровнем несколько свечей
→ Отслеживает самую глубокую точку во время свипа
→ Более гибкий, ловит больше сетапов
Строгий режим (Strict Mode ВКЛ):
→ Классическое определение SFP
→ Требует свип и закрытие обратно за один бар
→ Более консервативный, меньше но более качественных сигналов
Фильтры свипа (Sweep Filters)
Max Bars in Sweep — Максимальное количество баров, которое цена может находиться за уровнем. При превышении считается пробоем, а не свипом. По умолчанию: 10
Max Sweep Depth (ATR multiplier) — Максимальная глубина свипа как множитель ATR. Свипы глубже этого значения фильтруются как пробои. По умолчанию: 3.0
ATR Length — Период для расчёта ATR, используемого в фильтрах. По умолчанию: 14
Если цена заходит слишком глубоко за уровень или остаётся там слишком долго, это скорее всего реальный пробой, а не свип ликвидности. Эти фильтры предотвращают ложные сигналы на трендовых рынках.
Подтверждение свипа (Sweep Confirmation)
Confirmation Bars — Сколько баров подряд цена должна закрываться обратно за уровнем для подтверждения свипа. По умолчанию: 2
Min Return Depth (ATR mult) — Минимальное расстояние, на которое цена должна вернуться за уровень (как множитель ATR), чтобы считаться валидным возвратом. По умолчанию: 0.3
📊 Таблица статистики
Таблица отображает статистику в реальном времени для всех обнаруженных свипов:
Count — Общее количество свипов (Bull/Bear/Total)
Avg (pts) — Средняя глубина свипа в пунктах. Ключевая метрика для размещения SL
Median (pts) — Медианная глубина свипа, полезна при наличии выбросов (аномальное значение, сильно отличающееся от остальных.)
Max (pts) — Самый глубокий свип
Min (pts) — Самый мелкий свип
SL Buffer — Рекомендуемое расстояние стоп-лосса (Среднее × 1.2)
⚠️ Важные замечания
Расчёт пунктов: Индикатор автоматически определяет тип инструмента. Для Forex с 5 знаками отображает в пипетках (умножьте на 0.1 для пипсов). Для Forex с 4 знаками отображает в пипсах. Для других инструментов отображает в пунктах.
Исторические данные : Статистика рассчитывается по всем видимым данным графика. Прокрутите влево, чтобы включить больше истории для лучших средних значений.
Таймфрейм важен: Характеристики свипов различаются на разных таймфреймах. Запускайте индикатор отдельно на каждом ТФ, который торгуете.
Не является финансовой рекомендацией: Этот индикатор — инструмент для анализа. Всегда комбинируйте с другими факторами подтверждения и правильным управлением рисками.
🔔 Алерты
Доступны два условия для алертов:
→ Bullish Sweep: Срабатывает при подтверждении бычьего свипа
→ Bearish Sweep: Срабатывает при подтверждении медвежьего свипа
💡 Советы
→ Начните с настроек по умолчанию и корректируйте под ваш инструмент/таймфрейм
→ Увеличьте Pivot bars (25-30) для старших таймфреймов, чтобы ловить более значимые уровни
→ Уменьшите Max Bars in Sweep (5-7) для скальпинга, чтобы фильтровать медленные движения
→ Используйте Strict Mode если хотите меньше, но более надёжных сигналов
→ Сравнивайте медиану и среднее — если сильно отличаются, у вас есть выбросы, влияющие на расчёт SL

Gold Levels MTF
// ────────────────────────────────────────────────────────────────────────────────
// GOLD LEVELS MTF - COMPLETE INDICATOR DESCRIPTION
// ────────────────────────────────────────────────────────────────────────────────
//
// DESCRIPTION:
// Gold Levels MTF is a professional technical indicator that analyzes asset price
// movement and displays support and resistance levels from all timeframes (Daily,
// Weekly, Monthly) using the Murray Math method based on Gann theory.
//
// MAIN FEATURES:
// 1. Multi-timeframe analysis - displays levels from Daily, Weekly, and Monthly timeframes
// 2. Automatic Murray Math level calculation (9 levels: 0/8 to 8/8)
// 3. Visual indication of level strength through colors and line styles
// 4. Level labels for easy identification
// 5. Automatic recalculation when volatility changes
//
// LEVEL TYPES:
//
// Extreme Overshoot (0/8 and 8/8) - Red color, solid line
// Final support/resistance. After price breaks through these levels, the indicator
// automatically recalculates and sets new levels.
//
// Overshoot (1/8 and 7/8) - Orange color, dotted line
// Weak level. If price has moved too far and stops near this level, it will reverse
// quickly. If it doesn't stop, it will continue moving.
//
// SUP/RES (2/8 and 6/8) - Blue color, solid line
// Strongest support and resistance levels. Provide the strongest resistance and
// support. Key levels for trading.
//
// Stop & Reverse (3/8 and 5/8) - Yellow color, dotted line
// Weak level. If price has moved too far and stops near this level, it will reverse
// quickly in the opposite direction.
//
// PIVOT (4/8) - Purple color, solid line
// Main support/resistance level. Provides the strongest resistance/support. This is
// the best level for new buy or sell entries.
//
// HOW TO USE:
//
// 1. SETTINGS:
// - Enable/disable desired timeframes (Daily, Weekly, Monthly)
// - Enable level labels for easy identification
// - Adjust line thickness to your preference
//
// 2. TRADING:
// - PIVOT (4/8) - main level for position entry
// - SUP/RES (2/8, 6/8) - strong levels for placing stop-losses and take-profits
// - Extreme Overshoot (0/8, 8/8) - levels for identifying trend reversal
// - Use combination of levels from different timeframes to confirm signals
//
// 3. INTERPRETATION:
// - Price above PIVOT - potentially bullish trend
// - Price below PIVOT - potentially bearish trend
// - Bounce from SUP/RES levels - strong signal for entry
// - Breakthrough of Extreme Overshoot - possible trend change
//
// ADVANTAGES:
// - High accuracy in determining support and resistance levels
// - Multi-timeframe analysis for better understanding of the overall picture
// - Automatic recalculation when market conditions change
// - Visual indication of level strength
// - Easy to use and interpret
//
// TECHNICAL DETAILS:
// - Calculation method based on Gann theory and Murray mathematics
// - Octave is calculated as a power of two from the price range
// - Levels are divided into 8 equal parts (0/8 to 8/8)
// - Previous period data is used for calculation stability
//

Hour-End SMAThis indicator calculates a Simple Moving Average using true RTH hour-end prices (10:00–16:00 ET), solving TradingView’s 1H RTH candle misalignment issue.
The SMA is derived from 30-minute bars to ensure sufficient historical depth, making it reliable even for large lengths such as SMA100 and SMA200.
Designed for traders who rely on hour-end moving averages while working in TradingView.
Example: Hour-End SMA matches TC2000 Simple Moving Average values

Momentum Flow Module 1 (Bar/Candlestick Classification)Every candlestick on the chart can be categorized as either a trend bar or a trading range bar. Trend bars are further classified as significant or insignificant, while trading range bars are divided into inside, outside, overlap, reversal, and implied reversal types. This indicator automatically identifies and labels each category to help traders make more informed decisions. For instance, a sequence of significant bearish trend bars within an ongoing bull trend indicates weakening bullish momentum. Similarly, if a bull trend lacks strong bull trend bars, it suggests diminishing buying pressure or the early signs of a potential reversal

Advanced ORB Strategy v6 (Time-Based Fix)/Once the window closes, the market has drawn its first meaningful line in the sand. A break above the opening range high signals that early sellers are trapped and buyers are pressing. A break below the opening range low signals the opposite. Trades are only considered after price leaves the range and shows acceptance, not on the first tick outside.
Risk is defined and limited by the range itself. Stops are placed back inside the opening range, which keeps losses small and predefined. Targets are based on objective market references such as overnight highs and lows, VWAP extensions, or prior session levels—not arbitrary profit goals.
This strategy is not predictive. It does not try to forecast direction or call tops and bottoms. It responds to real order flow and liquidity behavior as it unfolds. When the market is trending, the strategy captures momentum early. When conditions are choppy or volatility is compressed, trades are filtered out or avoided entirely.
The strength of this approach is its simplicity, repeatability, and risk control. One defined window. One defined range. Clear entry criteria. Clear exits. No overtrading.

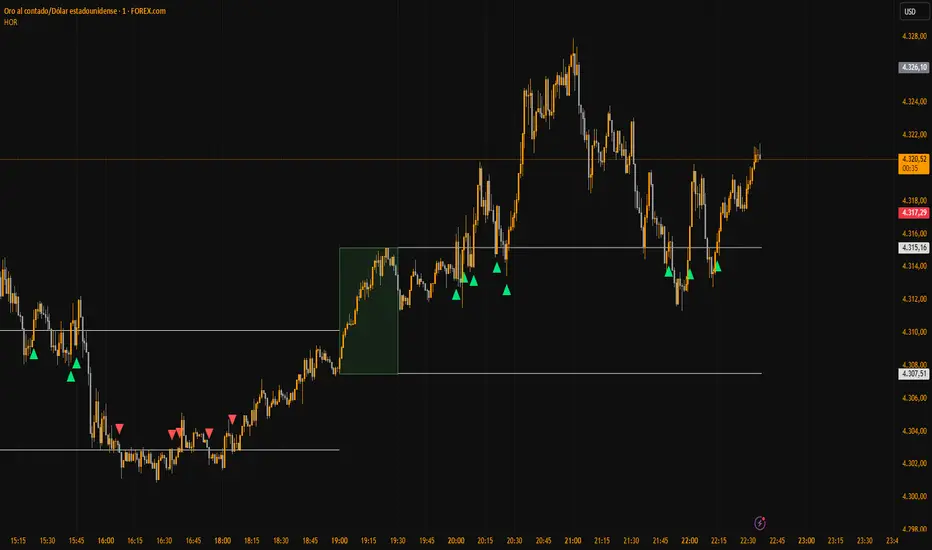
EgyptTraderFx - Horus Opening RangeHorus Opening Range – EgyptTraderFx
Horus Opening Range marks configurable session ranges and highlights potential breakout opportunities based on pure price action.
Designed for traders who focus on timing, session behavior, and market structure, this indicator helps identify key high-impact levels formed during important market openings such as London and New York.
🔹 Key Features
Custom session time & timezone
Automatic session high / low levels
Visual session range box
Clean breakout signals above or below the range
Alerts for session start, session end, and breakouts
Works across Forex, Indices, Metals, and Crypto
🔹 Best Use
Opening range strategies
Session-based trading (London / NY / Asia)
Scalping and intraday trading
High-liquidity market conditions
⚠️ Notes
This indicator is a technical tool, not a trading system.
Risk management and trade confirmation remain the trader’s responsibility.
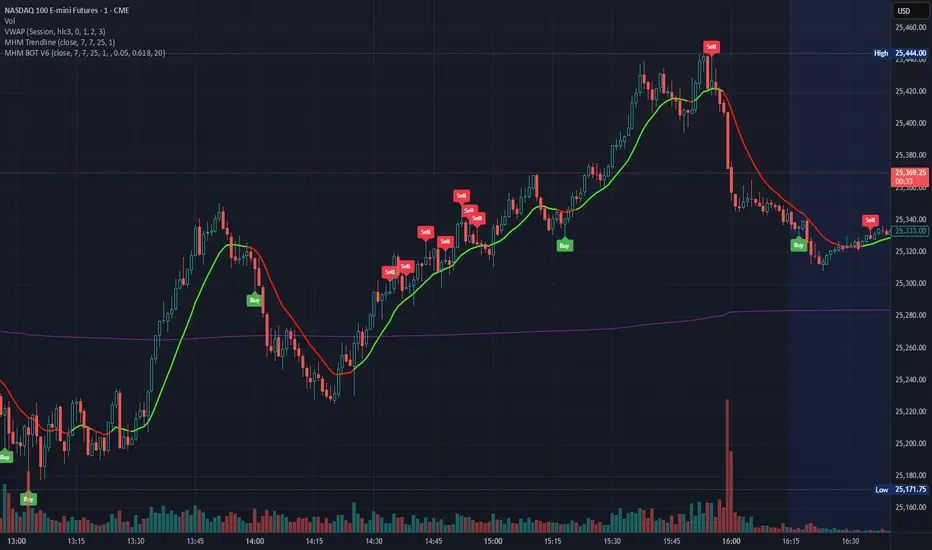
MHM BOT V6Proprietary algorithm based indicator providing clear buy / sell signals which do not repaint. Perfectly suited for scalping tickers with high liquidity and volatility. Perfectly suited for scaling NQ or ES.
BBMA Signal ProBBMA Signal Pro
BBMA Signal Pro is a professional BBMA (Bollinger Band + Moving Average) cycle indicator designed to identify structure, momentum, and continuation — not random signals.
This script strictly enforces the BBMA trading cycle and only allows continuation and re-entry signals when the market context is valid.
Core Components
Bollinger Bands (20 SMA, configurable)
WMA 5 & WMA 10 (High / Low)
EMA 50 for trend confirmation
BBMA Cycle Logic (Strict Flow)
All continuation setups require the full BBMA sequence to complete:
EXT (Extreme)
TPW (TP Wajib)
MHV (Market Hilang Volume)
Only after this sequence is completed will continuation setups be allowed.
This prevents early, unstructured, and low-quality signals.
Signals Included
EXT – MA pushes outside Bollinger Band
TPW – price reacts to opposite MA5 after EXT
MHV – price fails to break Bollinger Band
CSAK – continuation candle inside BB zone
CSM – strong momentum candle closing fully outside BB
Re-Entry – controlled pullback after CSAK or CSM
Each CSAK / CSM setup:
Appears only once
Waits for re-entry or invalidation
Is canceled immediately by an opposite CSAK or CSM
Re-Entry Conditions
Pullback to MA5 High (Sell) or MA5 Low (Buy)
Default Trend Confirmation (IMPORTANT)
By default, Re-Entry uses the CURRENT timeframe trend as confirmation:
Sell Re-Entry → Mid BB below EMA50
Buy Re-Entry → Mid BB above EMA50
This prevents:
Counter-trend re-entries
Late or forced continuation trades
Chasing exhausted moves
Optional entry confirmation:
-Touch MA5 only
-Touch MA5 + close inside MA5 band
Valid within 10 candles after the setup
Must match the last active setup (CSAK or CSM)
Dynamic Multi-Timeframe Trend Confirmation
Trend confirmation adapts automatically to the chart timeframe:
Chart TF | Trend Confirmation
5m | M15 + H1
15m | H1 + H4
1H | H4
4H | Daily
Daily | Current TF
Used for:
Filtering CSAK / CSM setups
Optional Re-Entry confirmation
Visual trend tables
Alerts
Trend Filter Modes
You control how strict the trend filtering is:
-No Filter
-Higher TF Only
-Current TF Only
-Higher TF + Current TF
A Skip Current TF Check option is available for advanced users who want earlier signals before full confirmation.
Invalidation Rules
Any opposite CSAK or CSM immediately cancels all pending setups and re-entries
Prevents holding bias when market structure flips
Visual & UX Features
Clean BB + MA layout (matches BBMA Signal Pro reference)
No duplicate labels
Clear setup → continuation → re-entry flow
Dynamic trend tables
-Higher timeframe trend table
-Current timeframe trend (Mid BB vs EMA50)
Alerts (Production-Ready)
Matches visual logic exactly
Supports webhook automation
Re-Entry alerts respect:
-Trend confirmation
-Re-Entry mode timing (touch vs close)
JSON payload includes:
Price
SL / TP reference
Trend context
Chart link
Who This Script Is For
✔ BBMA traders who follow structure
✔ Traders who respect trend alignment
✔ Traders who want re-entries done properly
✖ Not for scalping noise
✖ Not for counter-trend gambling
Final Note
This is not a signal spam indicator.
It is a decision-filtering system .
If you understand BBMA, this script enforces discipline.
If you don’t, it will expose impatience very quickly.
Trade the cycle. Follow the trend. Re-enter with confirmation.

EMA 20/50 + RSI Trend Strategy [Clean & Simple]### **Title: EMA 20/50 + RSI Trend Strategy **
**Description:**
This is a pure trend-following strategy designed for Crypto intraday trading. It combines **EMA Crossovers** (for trend direction) with **RSI** (for momentum confirmation) to filter out choppy markets and false signals.
**1. Core Logic**
The strategy only signals an entry when both the Trend and Momentum are aligned:
* **Trend Filter:** Uses EMA 20 and EMA 50.
* **Momentum Filter:** Uses RSI (Length 14) with a baseline of 50.
**2. Signal Conditions**
* **🟢 LONG Signal:**
* Price Trend: EMA 20 is **ABOVE** EMA 50.
* Momentum: RSI is **ABOVE** 50.
* **🔴 SHORT Signal:**
* Price Trend: EMA 20 is **BELOW** EMA 50.
* Momentum: RSI is **BELOW** 50.
**3. Visual Features**
* **Bar Coloring:**
* **Green Bars:** Strong Bullish Trend (Long conditions met).
* **Red Bars:** Strong Bearish Trend (Short conditions met).
* **Gray Bars:** Neutral/Choppy Market (Stay aside).
* **Labels:** "LONG" and "SHORT" labels appear on the chart when the market state changes.
**4. Recommended Usage**
* **Timeframe:** Works best on **15m** (Scalping) or **1H** (Day Trading).
* **Assets:** High volatility pairs like BTCUSDT, ETHUSDT, SOLUSDT.
* **Strategy Tip:** Do not enter blindly on every signal. Wait for a pullback to the EMA 20/50 lines while the bar color remains Green/Red for the highest win rate.
**5. Alerts**
* This script supports TradingView alerts. You can set up alerts for "LONG Signal" and "SHORT Signal" in the alert menu.

Jim Kombein PhD Mode mHFT Structure Invite OnlyThis is an original, invite-only market micro-structure and state visualization script
developed for private research and educational purposes.
The script is designed to help experienced users observe short-term price structure,
volatility-adjusted turning behavior, and local market state transitions on ETH-based charts.
It does not replicate or repackage any built-in TradingView indicators and is based on
proprietary logic developed independently.
Due to its experimental and research-oriented nature, access to this script is intentionally
restricted to a limited group of invited users only, in order to prevent misuse or
misinterpretation.
This script does not provide financial advice, automated trading, trade execution,
or guaranteed performance. All visual outputs are provided for informational and
educational reference purposes only. Final trading decisions remain entirely the
responsibility of the user.

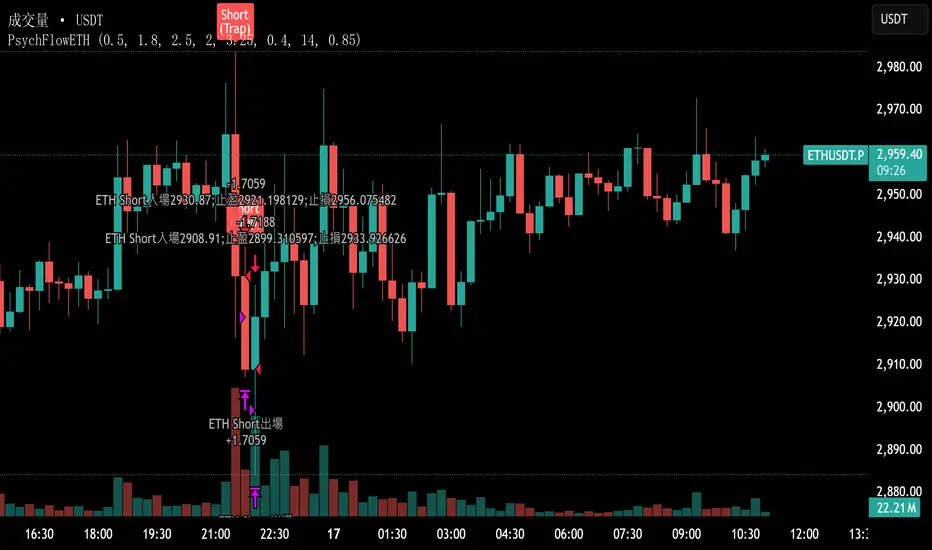
PsychFlowETHJudging trading behavior purely from a psychological perspective, without relying on technical indicators.
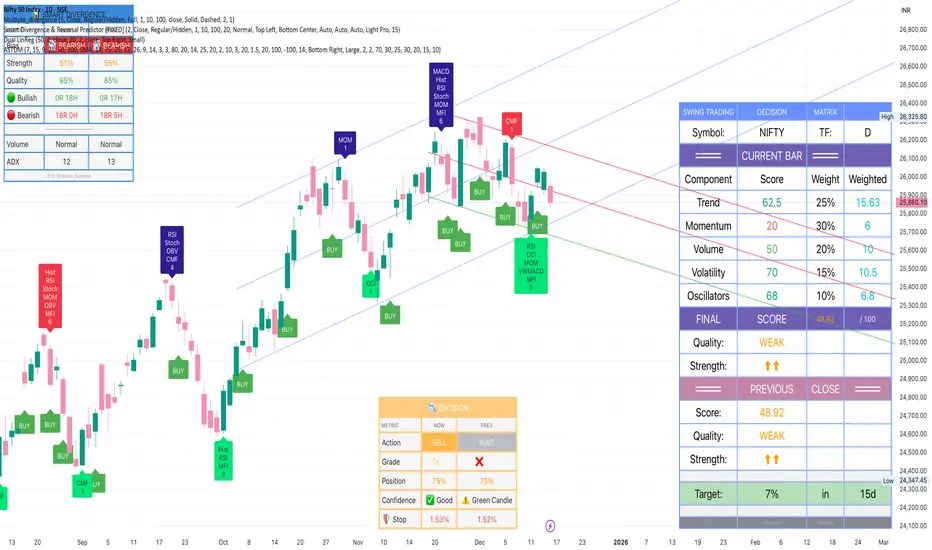
Advanced Swing Trading Decision Matrix With Custom DashboardIt's the same as previous Indicator with the DASHBOARD fully customisable as per user. For educational purposes only
MHM BOT V7Proprietary algorithm based indicator providing clear buy / sell signals which do not repaint. Perfectly suited for scalping tickers with high liquidity and volatility. Perfectly suited for scaling NQ or ES.
