Smart Money Concepts [Kodexius]Smart Money Concepts is a comprehensive price action framework designed to visually organize many of the core ideas behind “smart money” and price action trading concepts. It brings together market structure, order blocks, imbalances, liquidity, premium/discount zones, swing failures and higher timeframe context into a single, coherent overlay on your chart. Instead of jumping between multiple tools, the script aims to give you a structured map of where price has been interacting with liquidity and value, and how that structure is evolving in real time.
All major components are modular and highly configurable, so you can keep only what you care about: from a minimal market structure view to a fully loaded institutional style dashboard. The focus of the script is visual clarity and context highlighting reaction zones, swept levels and structural transitions while letting you decide how to interpret and use that information in your own workflow.
🔹 Features
🔸 Market Structure Engine (CHoCH & BoS)
Change of Character (CHoCH) and Break of Structure (BoS) are complementary smart money market structure concepts that describe two different phases in how a trend evolves.
CHoCH refers to the first meaningful shift in structure that suggests the prevailing trend may be weakening and a new directional bias could be emerging (for example, a market that has been making higher highs and higher lows starts to form lower highs and lower lows).
BoS , on the other hand, is typically used as a confirmation of trend continuation: price extends beyond a key swing high in an uptrend or a key swing low in a downtrend, reinforcing that the existing directional structure remains intact.
Put simply, CHoCH is associated with a potential reversal in market character, while BoS underscores the continuation and extension of the current trend.
Script automatically detects and labels market structure shifts using swing based logic (Change of Character / CHoCH and Break of Structure / BoS).
Bullish Change of Character :
Bearish Change of Character :
Bullish Break of Structure :
Bearish Break of Structure :
Differentiates between first structural flips and continuation breaks, helping you see when the dominant direction is potentially shifting or being reinforced.
Draws structure reference lines at key swing levels so you can visually anchor where those events occurred on the chart.
🔸 Order Blocks with Volumetric Insight
Identifies bullish and bearish order blocks from the most relevant impulsive moves after structure breaks.
Bullish Order Block :
Bearish Order Block :
Each order block is drawn as a zone, with an internal split between “bullish” and “bearish” pressure, based on recent price/volume behavior inside that move.
Displays relative volume and simple volume percentages for the most recent blocks, giving an at a glance sense of which zones carried more activity.
Fully configurable display depth so you can limit the chart to only the last few highest priority blocks.
🔸 Breaker Blocks & Mitigation Tracking
Tracks when previously identified order blocks fail and converts them into breaker blocks, visually marking a change in how price is interacting with that zone.
Bullish Breaker Block :
Bearish Breaker Block :
Separate handling of bullish and bearish breakers with clear color differentiation.
Includes optional “mitigation” logic using either wick or close to determine when a block is considered broken or mitigated.
Breaker blocks are updated and removed dynamically as price trades through them, keeping the chart focused on current, active zones.
🔸 Fair Value Gaps (FVGs), Volume Imbalances & Opening Gaps
Detects imbalances in multiple modes: classic Fair Value Gaps (FVG), volume style imbalances (VI), and opening gaps (OG), with separate options for bullish and bearish sides.
Each imbalance is drawn as a zone, with a mid line reference to quickly locate the “mean” of the gap.
Optional sentiment overlay inside the gap, visually splitting the zone into bullish and bearish “gauge” segments based on recent bar behavior on a chosen timeframe.
Configurable mitigation method (wick or close) and maximum number of visible gaps, so the chart remains readable even on very active instruments.
For both order blocks and FVGs, internal sentiment boxes indicate how bullish or bearish the underlying move or gap has been, using proportional visual splits rather than raw numbers.
This gives an immediate visual cue as to whether a zone was driven more by upward or downward pressure.
🔸 Liquidity Sweeps, EQH/EQL and Volume Filter
Automatically detects areas where liquidity may be resting via swing based pivot highs and lows.
Sellside Liquidity Sweep :
Buyside Liquidity Sweep :
Highlights equal highs (EQH) and equal lows (EQL) when sweeps occur, marking where price probed above/below prior liquidity and then rejected.
Optional volume filter to ignore low volume swings and focus on more meaningful liquidity zones.
Maintains compact arrays of recent liquidity points, clearing them as price decisively trades through or sweeps them.
🔸 Premium / Discount Zones & Equilibrium
Projects premium and discount bands based on a dynamically measured range, offering a simple view of where price is trading relative to that range.
Draws separate Premium and Discount boxes with optional price labels for quick orientation.
Optional mid line (equilibrium) to visualize the “50%” of the current range, often used as a reference for balanced versus extended price.
Zones auto update as the underlying range evolves, with logic to prevent stale levels from cluttering the chart.
In addition script can also project previous session key levels such as open, high, low and equilibrium for a selected timeframe, with optional daily, weekly and monthly references. These levels are extended forward and automatically refreshed as new periods unfold, so you always have clear structural anchors from recent sessions without manually redrawing prior session lines.
🔸 Trend Line/Channel Framework
Detects swing based trendline pivots (uptrends and downtrends) with configurable sensitivity and choice of high/low or close as the source.
Draws trendline “channels” around the detected pivots, shading the area between upper and lower bounds to visualize directional bias zones.
Dynamically updates and deletes prior lines to keep the most recent structure visible, rather than leaving outdated lines on the chart.
Includes basic trendline break detection to highlight when price closes beyond a key diagonal boundary.
🔸 Swing Failure Pattern (SFP) Detector
Scans a chosen timeframe for Swing Failure Patterns (SFPs) using a defined lookback window and minimum separation between events.
Differentiates bullish and bearish SFPs, drawing labels and horizontal reference lines at the swept high or low.
Includes a “lock” period option to pause new SFP detection for a set number of bars after an event, helping to avoid clustering multiple signals in the same area.
🔸 HTF Candle Projection Panel
Projects higher timeframe candles to the right of current price as a compact visual panel, giving you context of higher timeframe structure without switching charts.
Supports both classic candles and Heikin Ashi style, with configurable size, spacing and number of projected candles.
Optionally uses higher timeframe OHLC or blends current timeframe behavior into the projection, depending on how strictly you want to reference HTF data.
Can display projected HTF open/high/low lines and price labels, helping you see where current price is trading within or relative to the larger candle.
🔸 Alert Framework
Built-in alerts for key structural events:
- Market structure changes (BoS, CHoCH) in both directions.
- New order blocks and breaker blocks forming, breaking or being approached.
- New FVGs forming and price moving into or near the latest imbalance zones.
- Liquidity sweeps (highs/lows), EQH/EQL touches and simple liquidity events.
- Price entering premium or discount bands.
- Trendline detection and basic trendline break events.
- Swing Failure Patterns and movements toward previous key levels.
Designed so that you can selectively enable only the conditions you care about and convert them into alerts that match your personal workflow.
Smart Money Concepts is built to function as a unified “map” of structure, liquidity and imbalance on the chart. Each module can be toggled and tuned, allowing you to build anything from a minimal structure only overlay to a fully featured institutional style view of how price interacts with key zones over time.
🔸 Originality & Usefulness
This script is built around a shared price action state, so market structure, order blocks, imbalances and liquidity are not drawn as independent overlays but as parts of the same engine.
At the core is a custom market structure module for CHoCH and BoS. Instead of only comparing the last swing high/low, it maintains an internal directional state and swing history so it can:
treat the first structural flip after an established leg as a Change of Character (CHoCH), and
treat subsequent breaks in the same direction as continuation Breaks of Structure (BoS).
Each event is anchored on the actual swing that defined it, and each swing can only trigger once, reducing repeated labels on minor fluctuations and making structural transitions easier to follow.
Order blocks are implemented with a volumetric profile, not just static rectangles. After a relevant structure event, the script identifies the impulsive move and:
draws the order block as a zone, internally split into “bullish” and “bearish” segments based on how price and volume behaved inside that move,
assigns each block its own traded volume and a relative percentage weight compared to other recent blocks.
The result is an at a glance view of which blocks carried more participation and whether the internal push was dominated by buying or selling, while older or lower priority blocks are automatically pruned to keep the chart clean.
Imbalance handling supports multiple gap types (Fair Value Gaps, volume style imbalances and opening gaps). Each gap is drawn as a zone with a midline, and can optionally be filled with a sentiment gauge: the gap is divided into bullish and bearish portions using recent bar behavior on a chosen timeframe, then updated as new data comes in. This makes it easy to see whether a gap remains one sided or is gradually being balanced out.
Liquidity and Swing Failure Patterns are treated as filtered events. Liquidity pools are detected from swing highs/lows and can pass through a dedicated volume filter: candidate levels are compared to a dynamic volume baseline, and low participation spikes are discarded. Only swings that traded with meaningful activity are tracked as potential liquidity, which are then monitored for sweeps, EQH/EQL tags and subsequent rejection. Once a level is decisively traded through or swept, its internal state is updated so the display does not accumulate stale points.
The SFP module operates on a user defined higher timeframe with a configurable lookback and lock period, so each Swing Failure Pattern is separated in time from the previous one. Combined with the liquidity volume filter, this produces a smaller set of structurally significant SFPs instead of dense clusters around the same area.
Higher timeframe context is further supported by the HTF candle projection panel, which projects compact candles to the right of price. These synthetic candles can reference strict HTF OHLC or blend current lower timeframe behavior into their bodies and wicks, so you can see where current action sits inside the larger structure without switching charts.
All major modules feed into a structured alert layer: market structure events (CHoCH/BoS), new and broken order blocks and breaker blocks, new and approached FVGs, liquidity sweeps, SFPs, moves into premium/discount, trendline events and movements toward key levels. Each alert corresponds to a well defined structural or liquidity update on the chart, rather than a black box trade call.
🔹 How to Use
You can adapt the script to very different workflows, but a common way to use it is:
1. Start from higher timeframe bias
Use the Market Structure Engine (CHoCH & BoS) and the HTF Candle Projection Panel to understand the dominant direction on your reference timeframe (e.g. H4 / Daily).
Combine this with the Premium/Discount Zones and previous session levels (daily/weekly/monthly open, high, low, equilibrium) to see whether price is trading in a relatively extended (premium) or discounted area of the current range.
2. Map your key reaction zones
Turn on Order Blocks with Volumetric Insight and Breaker Blocks to highlight the most relevant impulsive origin zones after structure breaks.
Focus primarily on the most recent blocks (configurable depth) and note their internal volume/sentiment split to prioritize which zones are likely to matter most.
Optionally add Fair Value Gaps / Volume Imbalances / Opening Gaps and, if desired, activate the internal sentiment gauge to see whether the imbalance was driven more by bullish or bearish pressure.
3. Watch how liquidity interacts with those zones
Enable Liquidity Sweeps & EQH/EQL to see where price has run resting liquidity above highs or below lows.
Combine this with the Swing Failure Pattern (SFP) detector to isolate moments where liquidity is taken and immediately rejected back into structure.
You can use the volume filter to ignore small, low volume swings and focus on more meaningful liquidity events.
4. Refine timing with local structure & trendlines
On your execution timeframe, use CHoCH/BoS labels, Trend Line/Channel Framework and SFPs inside or around your chosen OB/FVG zones.
Trendline channels give you diagonal context (where price is riding or breaking a local structure), while CHoCH/BoS marks when that micro structure starts to flip.
5. Use alerts as a monitoring layer, not as standalone signals
Set alerts for the events that matter to you:
– new or broken order blocks / breaker blocks,
– price approaching the latest OB/FVG or breaker zone,
– liquidity sweeps and SFPs,
– fresh CHoCH/BoS events in your key direction,
– entries into premium/discount bands or HTF projection levels.
Treat these alerts as prompts to look at the chart, not as automatic entry/exit rules. The script is designed as a decision support and mapping tool; trade execution, risk management and confirmation remain up to your own plan and discretion.
This tool is intended as a mapping and decision support aid, not as an automated trading system, and should be combined with your own analysis and risk management.
Penunjuk dan strategi

NOVA Breakout Signals v2.5I’m excited to share that version 2.5 includes meaningful upgrades and has backtested well on XAU/USD. The indicator plots LONG/SHORT labels only (no orders, SL/TP) and can shade the background by trend. Signals are de-duplicated with a cooldown and are raised on confirmed bars.
You can also use TradingView Alerts to get early notifications the moment price touches a breakout, without waiting for a candle close—addressing a key limitation of earlier versions.
Notes
• Indicator only (no automated trading).
• Use Alerts to route signals to your preferred workflow.
• For research/education; past performance ≠ future results.
Made by Kenny Nguyen (Vietnam).

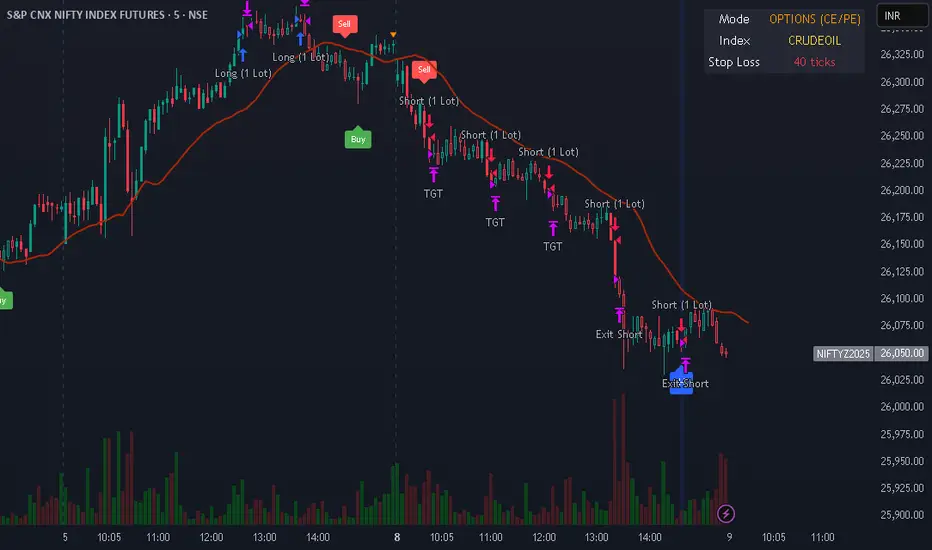
Intraday Options/Futures Naked By TradeEarnIntraday Momentum Strategy (Futures & Options)
Description: This strategy is designed for intraday momentum trading on Indian Indices (Nifty, BankNifty, FinNifty, Sensex) and Crude Oil. It combines Price Action (Impulse Candles) with strictly defined Momentum (RSI) and Trend Strength (ADX) indicators to filter out choppy markets and capture high-probability moves.
Key Features:
Instrument Flexibility: Supports both Futures (Long/Short) and Options Buying (Long CE/PE) modes.
Auto-Lot Sizing: Automatically calculates the correct Lot Size based on the selected Index (e.g., Nifty = 25, BankNifty = 15).
Rupee-Based Risk Management: Define Target, Stop Loss, and Trailing Stop directly in INR (Rupees) rather than points or percentages.
Choppiness Filter: Uses ADX > 20 to avoid trading in sideways markets.
Cooldown Mechanism: Incorporates a "Cooldown" period after every trade exit to prevent over-trading and whipsaws.
⚠️ Disclaimer (As per SEBI & RBI Guidelines)
Educational Purpose Only: This strategy/script is for educational and backtesting purposes only. It does not constitute financial advice, investment recommendations, or a tip to buy or sell any securities.
Risk Disclosure:
Market Risk: Trading in the stock market, especially in Derivatives (Futures & Options), involves a high degree of risk and the potential for significant financial loss. You may lose your entire capital.
No Guarantees: Past performance of this strategy (Backtest results) is not indicative of future results. Market conditions change, and algorithms may fail during live execution.
SEBI Registration: The creator of this script is not a SEBI Registered Investment Advisor (RIA) or Research Analyst (RA).
User Responsibility: By using this script, you acknowledge that you are solely responsible for your own trading decisions. Please consult a SEBI-registered financial advisor before deploying real capital. This script is not compliant with high-frequency trading regulations and is intended for manual or semi-automated analysis only.
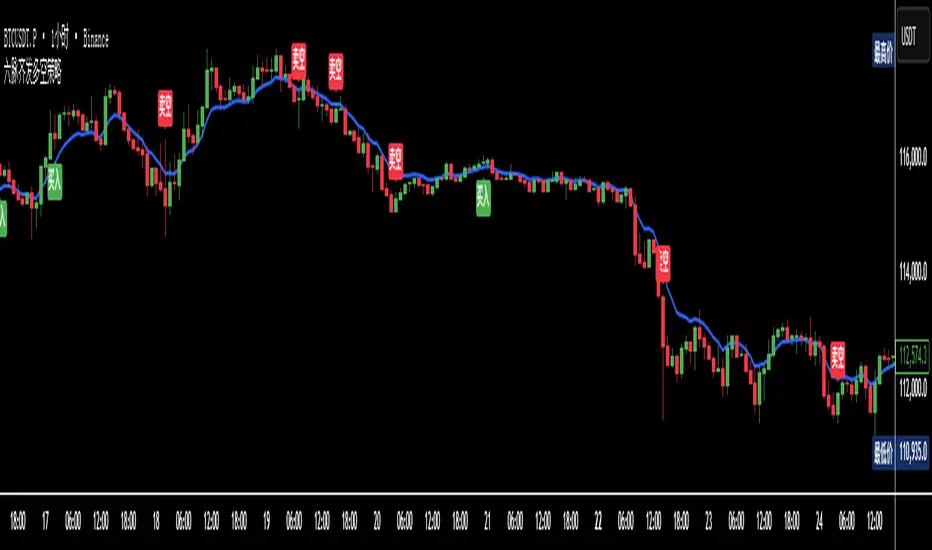
六脉齐发多空策略六脉齐发多空策略
# Six Meridians Unified Long/Short Strategy
## Overview
The "Six Meridians Unified Long/Short Strategy" is a comprehensive quantitative trading strategy built on TradingView Pine Script v6, designed for cross-asset long/short trading (stocks, cryptocurrencies, futures, forex, etc.). It leverages the resonance of **6 classic technical indicators** to filter high-confidence trading signals, reducing false signals caused by single-indicator bias and improving the reliability of entry/exit decisions.
## Core Indicators (6 "Meridians")
The strategy evaluates bullish/bearish trends by calculating 6 key technical indicators, with a "bullish count" system to quantify trend strength:
| Indicator | Calculation Parameters | Bullish Condition | Bearish Condition |
|-------------------------|------------------------------|--------------------------------------------|--------------------------------------------|
| MACD | Fast=12, Slow=26, Signal=9 | MACD line crosses above Signal line | MACD line crosses below Signal line |
| KDJ (Stochastic Oscillator) | Length=14, SmoothK=3, SmoothD=3 | K line > D line | K line < D line |
| RSI (Relative Strength Index) | Short=6, Long=12 | Short-period RSI (6) > Long-period RSI (12) | Short-period RSI (6) < Long-period RSI (12) |
| LWR (Modified Williams %R) | Length=14, Smooth=6 | LWR1 (WMA-smooth) > LWR2 (6-period WMA) | LWR1 < LWR2 |
| BBI (Bollinger Band Index) | EMA(3)+EMA(6)+EMA(12)+EMA(24) /4 | Close price > BBI line | Close price < BBI line |
| MTM (Momentum) | Period=12, MMS=6, MMM=14 | Short momentum line (MMS) > Long momentum line (MMM) | Short momentum line (MMS) < Long momentum line (MMM) |
## Trading Logic
The strategy uses a "count-based" trigger mechanism to execute position management (no pyramiding allowed):
### Long Position Rules
1. **Entry**: Open long position only when all 6 indicators show bullish signals (`bullCount = 6`).
2. **Partial Exit**: Reduce 50% of long position when 4 indicators remain bullish (`bullCount = 4`).
3. **Full Exit**: Close all long positions when ≤3 indicators are bullish (`bullCount ≤ 3`).
### Short Position Rules
1. **Entry**: Open short position only when all 6 indicators show bearish signals (`bearCount = 6`).
2. **Partial Exit**: Cover 50% of short position when 4 indicators remain bearish (`bearCount = 4`).
3. **Full Exit**: Close all short positions when ≤3 indicators are bearish (`bearCount ≤ 3`).
## Strategy Parameters (Risk & Capital Management)
| Parameter | Value | Description |
|--------------------------|----------------|----------------------------------------------|
| Initial Capital | $100,000 | Starting equity for backtesting |
| Default Order Size | $10,000 (cash) | Fixed cash amount per trade (instead of lots) |
| Commission | 0.1% per trade | Realistic transaction cost (percent-based) |
| Margin Requirement | 100% | No leverage (1:1 trading) |
| Pyramiding | 0 | No additional positions on existing trades |
## Key Features
1. **Multi-Indicator Resonance**: Eliminates noise from single-indicator false signals by requiring consensus across 6 diverse technical metrics.
2. **Gradual Position Management**: Partial exit (50%) before full closure to lock in profits and reduce downside risk.
3. **Full Automation**: Automatically executes entry/exit/position adjustment without manual intervention.
4. **Visualization Tools**: Plots BBI line, long/short signal labels, and bullish indicator count for easy strategy monitoring.
5. **Versatility**: Adaptable to multiple timeframes (15min, 1H, 4H, daily) and asset classes.
## Notes
- The strategy is optimized for trend-following markets and may underperform in choppy/range-bound conditions.
- Backtest results should be validated across different market cycles (bull, bear, sideways) before live trading.
- Parameters (e.g., indicator periods, order size) can be adjusted based on specific asset volatility and trading style.
美股宽广度指标NH-NLThe NH–NL breadth indicator is used to measure the underlying strength or weakness of the market (Market Breadth).
It tracks how many stocks are making 52-week new highs (New Highs) and 52-week new lows (New Lows), and calculates the difference between them.
This is one of the most widely followed institutional indicators of market health, helping traders observe:
• Whether an uptrend has real breadth support (i.e., whether most stocks are participating in the advance)
• Whether weakness is spreading during pullbacks (e.g., new lows expanding rapidly)
• Whether the medium-term structure is shifting (NH–NL often reveals trend changes earlier than price)
The core purpose of this breadth indicator is to help traders assess whether the market environment is suitable for increasing risk exposure, or whether they should reduce exposure and stay cautious.
NH–NL宽广度指标用于衡量市场内部的强弱结构(Market Breadth)。
它统计市场中有多少股票创 52 周新高(New Highs) 与 52 周新低(New Lows),并计算两者的差值
这是机构最常参考的市场健康度指标之一,用于观察:
• 上涨行情是否具备广度支持(是否多数股票都参与上涨)
• 回调过程中是否有恶化迹象(新低是否快速扩散)
• 中期结构是否变化(NH–NL 案例中最常见的是趋势转折提前出现)
这个宽广度指标核心价值是让交易者判断市场是否适合提高风险敞口或是否需要降低风险并观察。

Time-based levelsScript to plot time-based levels such as yearly/quarterly/monthly/Monday open, Monday range, previous month/week/day range.
This script does NOT handle sessions, therefore it's better suited for crypto which is 24/7.
There are various display options.
- Monday open is displayed immediately, but Monday High / Low / Mid 50% are displayed from Tuesday (i.e. when Monday closes and H/L are set for good)
This behaviour can be overridden using the appropriate option within the indicator's inputs parameters
- Levels are time-frame dependant (for instance, a daily level such as "Monday open" only shows on D1 TF and lower TF)
- To avoid redundancies:
* Yearly open is not displayed on January (redundant with monthly open)
* Quarterly open is not displayed on January, April, July and October (redundant with monthly open), neither on Feb. and March (redundant with yearly open)
* Previous day High / Low / Mid 50% are not displayed on Tuesday (redundant with Monday open / High / Low / Mid 50%)
* Daily open is not displayed on Monday (redundant with Monday open)
- Alerts can be created when prices crosses levels such as yearly/quarterly/monthly/Monday open, Monday range, previous month/week/day range
Known issue (TradingView ticket opened as issue is on their side):
On the W1 TF, if the current week spans over 2 months, the monthly open will be incorrect and still use the previous month open instead.
Once the week closes, the monthly open will be displayed correctly. This issue is not present on other TF.
Example: on Feb. 2nd 2023, when W1 TF is selected, monthly open shows January open instead of February open.


UDL Matrix: MTF Divergence System [WangBlack]【使用說明 / How to Use】
多頭訊號 (Long Signal):出現綠色「多」標籤。
條件:UDL 進入超賣區 + K線出現反轉型態 + 趨勢過濾通過。
空頭訊號 (Short Signal):出現紅色「空」標籤。
條件:UDL 進入超買區 + K線出現反轉型態 + 趨勢過濾通過。
背離線 (Divergence Lines):
綠色實線:底背離(看漲)。
紅色實線:頂背離(看跌)。
背景色 (Background):
綠色背景:HTF(大級別)處於低位,適合做多。
紅色背景:HTF(大級別)處於高位,適合做空。
【適用市場】 加密貨幣、外匯(黃金 XAUUSD)、指數期貨。適合 1分/5分/15分/1小時 級別操作。
Here is the English translation for the "How to Use" section, optimized for TradingView descriptions:
【How to Use】
Long Signal:
Indicator: A Green label with the text "多" (Long) appears.
Conditions: UDL enters the Oversold zone + Candlestick Reversal Pattern detected + Trend Filter validation passed.
Short Signal:
Indicator: A Red label with the text "空" (Short) appears.
Conditions: UDL enters the Overbought zone + Candlestick Reversal Pattern detected + Trend Filter validation passed.
Divergence Lines:
Green Solid Line: Regular Bullish Divergence (Signal to Buy).
Red Solid Line: Regular Bearish Divergence (Signal to Sell).
Background Color (HTF Context):
Green Background: HTF (Higher Timeframe) is in a low zone; favorable for Long positions.
Red Background: HTF (Higher Timeframe) is in a high zone; favorable for Short positions.
【Applicable Markets】 Cryptocurrencies, Forex (specifically Gold/XAUUSD), and Index Futures. Recommended Timeframes: 1-minute, 5-minute, 15-minute, and 1-hour charts.

Setup Keltner BandS MMS + RSI SIGNALS
📊 Keltner Bands with RSI Confirmation – TradingView Script
Introduction
This script combines Keltner Channel logic with Relative Strength Index (RSI) confirmation to provide traders with visual signals and alerts for potential reversals. It is designed for scalping and short-term trading strategies, where precision and quick decision-making are essential.
🔧 How It Works
• Keltner Bands (ATR-based):
• Two sets of bands are plotted around a moving average:
• Band 3 (ATR × 3) – more sensitive, suitable for aggressive entries.
• Band 5 (ATR × 5) – wider, used as a filter or confirmation zone.
• Signals are generated when the price crosses back inside the bands from outside.
• RSI Confirmation:
• RSI is calculated with a customizable period (default: 14).
• Overbought and oversold levels (default: 70/30) are used to filter signals.
• A bearish reversal is confirmed only if RSI is above the overbought level.
• A bullish reversal is confirmed only if RSI is below the oversold level.
📌 Functions and Features
• Visual Signals:
• Triangles plotted above/below candles for Keltner-only signals.
• Additional colored triangles for Keltner + RSI confirmed signals.
• Alerts:
• Configurable alerts for both Keltner-only and RSI-confirmed conditions.
• Messages include the type of reversal and the band level.
• Customizable Parameters:
• Moving average length.
• ATR multipliers (3 and 5).
• RSI length and thresholds.
• Colors for band fills and signals.
🎯 Usage
1. Apply the script to your chart in TradingView.
2. Adjust parameters to fit your trading style (scalping, intraday, swing).
3. Watch for signals:
• Red/green/orange/teal triangles → Keltner-only reversals.
• Maroon/lime/purple/blue triangles → RSI-confirmed reversals.
4. Set alerts to receive notifications when conditions are met.
5. Use RSI confirmation to filter out false signals and increase accuracy.
✅ Benefits
• Clear visualization of reversal zones.
• Dual-layer confirmation (Keltner + RSI).
• Flexible for different timeframes and trading styles.
• Ready-to-use alerts for automation or manual trading.

Borna's ZonesBorna's Zones marks two important time-based zones on the chart: the 08:00 zone and the 09:00 zone.
The 08:00 zone identifies initial liquidity. This zone sets the range where early market participants create significant activity.
The 09:00 zone serves as a reference for confirmation. After 09:00, the indicator helps you identify whether the 08:00 zone should be considered cleared.
Both zones are automatically extended until 11:00, providing clear visual references for potential market reactions.
No trading is recommended after 11:00, as the early morning zones lose relevance.
This indicator is useful for traders who focus on pre-market and early session liquidity, helping to visualize key levels where price may react.

AJ Price Action Trading SetupThe AJ Price action trading setup Involves :
1. Buy / Sell Signals Based On Previous Price Action
2. BOS/ COCH Showing Trend Reversals
3. Market Momentum Based On Price Action
Disclaimer :
Never Take trades based on Indicator only, make your own analysis and trade accordingly.
Price Action is not every body cup of cake, we are trading against smart and educated institutions its not easy to steal money from them.There is nothing in this world which helps in guaranteed returns,no indicator have done yet neither this one do.Try to Control your emotions and do not over trade.This is my updated version of my previous indicator Previous Candle Breakout Startegy.Follow and Comment for any clarifications.

RSI++ Smoothed + Divergence Lines by Indicatorhouse🚀 Introducing RSI++ Smoothed + Divergence Lines: Your Advanced Momentum Edge! 🚀
Hey,
I'm thrilled to share an indicator we've poured a lot of effort into, designed to give you a significant edge in understanding market momentum and anticipating reversals: RSI++ Smoothed + Divergence Lines.
This isn't just another RSI; it's a comprehensive momentum powerhouse built to provide cleaner signals, dynamic context, and crucial foresight that standard indicators often miss. If you're looking to reduce noise, spot high-probability reversals, and align with the broader market trend, this indicator is for you.
Why RSI++ is Different & What You Get:
Crystal-Clear Momentum with Advanced Smoothing Forget the jittery, noisy lines of a basic RSI. My indicator features a double-layered smoothing engine (EMA/SMA options + an additional EMA) to deliver a super-clean momentum line. This means you can spot actual shifts in market strength, not just minor wiggles.
Benefit: Reduces false signals, giving you more reliable entry and exit points.
Dynamic Overbought/Oversold Bands Static 70/30 levels are good, but dynamic levels are better! RSI++ integrates Bollinger Bands directly onto the RSI line itself. This means the overbought and oversold thresholds adapt to the current volatility of the momentum, giving you a more intelligent read on extreme conditions.
Benefit: Context-aware signals that truly reflect when momentum is stretched, regardless of market conditions.
Precision 'B'uy & 'S'ell Reversal Signals When the smoothed RSI changes direction from an extreme (overbought or oversold) zone, the indicator plots clear 'B' (Buy) or 'S' (Sell) labels. These are filtered signals designed to highlight high-probability reversals from significant momentum exhaustion.
Benefit: Pinpoint powerful turning points with easy-to-read visual cues directly on the indicator panel.
Automated Divergence Detection (Regular & Hidden!) One of the most powerful leading indicators is now automated for you! RSI++ automatically identifies and plots both Regular (trend reversal) and Hidden (trend continuation) Bullish and Bearish divergences between price and the smoothed RSI.
Benefit: No more squinting to find divergences. Clear lines and labels appear, giving you an early warning of potential shifts or continuations.
Multi-Timeframe (MTF) Confluence Dashboard Never trade against the higher timeframe trend again! A customizable dashboard discreetly shows you the momentum direction (RSI slope) across five different timeframes. It even calculates a confluence score!
Benefit: Gain instant perspective on the market's overall bias, helping you confirm trades and avoid low-probability setups.
Built-In Professional Alerts
Stay on top of the market without being glued to your screen. RSI++ comes with a comprehensive suite of alerts:
RSI Color Change (Slope): Get notified when momentum direction shifts.
Sell/Buy Signal (Extreme Reversal): Alerts for those high-conviction 'B' and 'S' signals.
Multi-Timeframe Confluence: Be alerted when 3 or more timeframes align, or when your first 3 timeframes are fully aligned.
Ready to Elevate Your Trading?
The RSI++ Smoothed + Divergence Lines indicator is available for purchase now! Experience a cleaner, smarter way to trade momentum.
🔑 Request Access: RSI++ (7-Day Trial)
We offer a 7-day free trial of the RSI++ Smoothed + Divergence Lines indicator!
To get access:
Follow My Profile.
Send a Private Message with your TradingView Username (ID).
We will grant access promptly!
Feel free to drop any questions below. Happy trading!
#RSI #MomentumTrading #Divergence #TradingView #CustomIndicator #TechnicalAnalysis #PineScript #PremiumIndicator

Fed Rate ProbabilityFed Rate Probability – Simple & Clean v2.0
Real-time composite score (0–100) for the next Fed move: Rate Cut, Hike or Hold
Overview
A clean, all-in-one indicator that combines the most reliable market signals into two easy-to-read lines:
• Red line → Probability of RATE CUT
• Blue line → Probability of RATE HIKE
• Hold score = 100 – max(cut, hike)
The dominant signal (CUT / HOLD / HIKE) is highlighted in the information table.
Key Features
Automatic daily data from FRED (DFF, 3M/1M/2Y/10Y yields)
Smart fallback to TradingView native symbols (US01MY, US03MY, US02Y, US10Y) when FRED is unavailable
Manual CME FedWatch probability override (perfect for weekends/holidays)
Historical Fed rate cut/hike markers with background shading and labels
Colored probability zones + customizable threshold lines
Threshold-crossing labels and full alert suite
Special alert on 2Y-10Y yield curve un-inversion (strong historical precursor to rate cuts)
Detailed summary table with current spreads, scores and dominant signal
Fully customizable: enable/disable each component, adjust weights indirectly via toggles, change smoothing, thresholds, colors, etc.
Score Composition (0–100 points)
T-bills vs Fed Funds spread – max 50 pts (with persistence & 1M confirmation bonus)
2-Year Treasury vs Fed Funds spread – max 30 pts (or direct CME probability input)
2Y-10Y yield curve behavior – max 20 pts (inversion depth + large bonus on steepening after un-inversion)
Interpretation
0–40 → Low probability
40–60 → Moderate
60–75 → High
75–100 → Very High / Almost certain
Why this indicator?
Instead of checking FRED, CME FedWatch, yield curves and T-bill spreads separately, get everything in one pane with a clear, smoothed composite score and instant alerts when the market starts pricing a Fed move aggressively.
Disclaimer
This is a decision-support tool based on historical relationships and current market pricing. It is not financial advice and past performance is no guarantee of future results.
Enjoy and trade safe! 🚀

Luxy VWAP Magic - MTF Projection EngineThis indicator transforms the classic VWAP into a comprehensive trading system. Instead of switching between multiple indicators, you get everything in one place: multi-timeframe analysis, statistical bands, momentum detection, volume profiling, session tracking, and divergence signals.
What Makes This Different
Traditional VWAP indicators show a single line. This tool treats VWAP as a foundation for complete market analysis. The indicator automatically detects your asset type (stocks, crypto, forex, futures) and adjusts its behavior accordingly. Crypto traders get 24/7 session tracking. Stock traders get proper market hours handling. Everyone gets institutional-grade analytics.
Anchor Period Options
The anchor period determines when VWAP resets and recalculates. You have three categories of options:
Time-Based Anchors:
Session - Resets at market open. Best for intraday stock trading where you want fresh VWAP each day.
Day - Resets at midnight UTC. Standard option for most traders.
Week / Month / Quarter / Year - Longer reset periods for swing traders and position traders who want broader context.
Rolling Window Anchors:
Rolling 5D - A sliding 5-day window that never resets. Solves the Monday problem where weekly VWAP equals daily VWAP on first day of week.
Rolling 21D - Approximately one month of trading data in continuous calculation. Excellent for crypto and forex markets that trade 24/7 without clear session breaks.
Event-Based Anchors:
Dividends - Resets on ex-dividend dates. Track institutional cost basis from dividend events.
Splits - Resets on stock split dates. Useful for analyzing post-split trading behavior.
Earnings - Resets on earnings report dates. See where volume-weighted trading occurred since last quarterly report.
Standard Deviation Bands
Three sets of bands surround the main VWAP line:
Band 1 (Aqua) - Plus and minus one standard deviation. Approximately 68% of price action occurs within this range under normal distribution. Touches suggest minor extension.
Band 2 (Fuchsia) - Plus and minus two standard deviations. Only 5% of trading should occur outside this range statistically. Touches here indicate significant overextension and high probability of mean reversion.
Band 3 (Purple) - Plus and minus three standard deviations. Touches are rare (0.3% probability) and represent extreme conditions. Often marks climax moves or panic selling/buying.
Each band can be toggled independently. Most traders show Band 1 by default and add Band 2 and 3 for specific setups or volatile instruments.
Multi-Timeframe VWAP System
The MTF section plots previous period VWAPs as horizontal support and resistance levels:
Daily VWAP - Previous day's final VWAP value. Key intraday reference level.
Weekly VWAP - Previous week's final VWAP. Important for swing traders.
Monthly VWAP - Previous month's final VWAP. Institutional benchmark level.
Quarterly VWAP - Previous quarter's final VWAP. Major support/resistance for position traders.
Previous Day VWAP - Yesterday's closing VWAP specifically, separate from current daily calculation.
The Confluence Zone percentage setting determines how close multiple VWAPs must be to trigger a confluence alert. When two or more timeframe VWAPs converge within this threshold, you get a high-probability support/resistance zone.
Session VWAPs for Global Markets
For forex, crypto, and futures traders who operate in 24/7 markets, the indicator tracks three major global sessions:
Asia Session - UTC 21:00 to 08:00. Gold colored line. Typically lower volatility, range-bound action that sets overnight levels.
London Session - UTC 08:00 to 17:00. Orange colored line. Often determines daily direction with high volume European participation.
New York Session - UTC 13:00 to 22:00. Blue colored line. Highest volume session globally. Sharp directional moves common.
Previous session VWAP values display as horizontal lines when each session closes, acting as intraday support and resistance. The table shows which sessions are currently active with checkmarks.
On-Chart Labels and Signals
The indicator plots several types of labels directly on price action when significant events occur:
Volume Spike Labels
Fire when current bar volume exceeds configurable thresholds relative to both the previous bar and the 20-bar average. Default settings require 300% of previous bar AND 200% of average volume. Green labels indicate bullish candles. Red labels indicate bearish candles. These spikes often mark institutional entry points.
Momentum Shift Labels
Appear when VWAP acceleration changes direction. The Slowing label warns when an active trend loses steam, often preceding reversal. The Accelerating label confirms trend continuation or potential bottom during downtrends. Filters available to show only reversal signals in existing trends.
VWAP Squeeze Labels
Detect when standard deviation bands contract relative to ATR (Average True Range). Low volatility compression often precedes explosive breakout moves. When the squeeze fires (releases), a label appears with directional prediction based on VWAP slope.
Divergence Labels
Mark price/volume divergences using CVD (Cumulative Volume Delta) analysis:
Bullish divergence: Price makes lower low, but CVD makes higher low. Hidden accumulation despite price weakness.
Bearish divergence: Price makes higher high, but CVD makes lower high. Hidden distribution despite price strength.
Dynamic VWAP Coloring
The main VWAP line changes color based on its slope direction:
Green - VWAP is rising. Institutional buying pressure. Volume-weighted price increasing.
Red - VWAP is falling. Institutional selling pressure. Volume-weighted price decreasing.
Gray - VWAP is flat. Consolidation or balance between buyers and sellers.
This coloring can be disabled for a static blue line if you prefer cleaner visuals. The VWAP label next to the line shows the current trend direction and delta percentage.
Calculated Projection Cone
One of the most powerful features is the Calculated Projection Cone. Unlike traditional extrapolation methods that simply extend a trend line forward, this system analyzes what actually happened in similar market conditions throughout the chart's history.
How It Works:
The system classifies each bar into one of 27 unique market states:
Z-Score Level - LOW (oversold), MID (fair value), or HIGH (overbought) based on configurable thresholds
Trend Direction - DOWN, FLAT, or UP based on VWAP slope
Volume Profile - LOW (below 80%), NORMAL (80-150%), or HIGH (above 150%) relative volume
When you look at the current bar, the indicator:
1. Identifies the current market state (e.g., LOW Z-Score + UP Trend + HIGH Volume)
2. Searches through all historical bars on the chart that had the same state
3. Calculates what happened in those bars X bars later (where X is your projection horizon)
4. Shows you the probability of up/down and the average move size
Visual Elements:
Probability Cone - Colored green (bullish probability above 55%), red (bearish below 45%), or gold (neutral). The cone width represents the historical range of outcomes (roughly the 20th to 80th percentile).
Center Line - Shows the average expected price based on historical outcomes in similar conditions.
Probability Label - Displays direction probability and average move. Example: "67% UP (+0.8%)" means 67% of similar past cases moved up, averaging 0.8% gain.
Fallback System:
When the exact 27-state match has insufficient historical data:
First fallback: Uses Z-Score plus Trend only (9 broader states, ignoring volume)
Second fallback: Uses Z-Score only (3 states)
When fallback is active, confidence automatically adjusts
Settings:
Projection Horizon - How many bars forward to analyze outcomes (5, 10, 15, or 20 bars, default 10)
Lookback Period - Historical data window in days (30-252, default 60)
Minimum Samples - Cases needed before using fallback (5-30, default 10)
Z-Score Threshold - Bucket boundary for LOW/MID/HIGH classification (1.0, 1.5, or 2.0 sigma)
Cloud Transparency - Adjust visibility (50-95%)
Colors - Customize bullish, bearish, and neutral cone colors
Confidence Levels:
HIGH - 30 or more similar historical cases found
MEDIUM - 15-29 similar cases
LOW - Fewer than 15 cases (more uncertainty)
IMPORTANT DISCLAIMER:
The Calculated Projection is based on past patterns only. It is NOT a price prediction or financial advice. Similar market states in the past do not guarantee similar outcomes in the future. The probability shown is historical frequency, not a guarantee. Always combine with other analysis and never rely solely on projections for trading decisions.
Alert Conditions
The indicator includes over 20 pre-built alert conditions:
Price vs VWAP:
Price crosses above VWAP
Price crosses below VWAP
Band Touches:
Price touches plus or minus one sigma band
Price touches plus or minus two sigma band (extreme)
Price touches plus or minus three sigma band (very extreme)
Z-Score Extremes:
Z-Score crosses above plus two (overbought extreme)
Z-Score crosses below minus two (oversold extreme)
Momentum and Trend:
Momentum slowing
Momentum accelerating
Trend turns bullish/bearish/neutral
Volume:
Volume spike detected
CVD Direction:
Buyers take control
Sellers take control
High Probability Signals:
Bullish reversal signal (oversold plus accelerating momentum)
Bearish reversal signal (overbought plus slowing momentum)
MTF and Special:
MTF confluence zone entry
VWAP squeeze fired
Bullish/Bearish divergence detected
Any significant signal (catch-all)
All signals use confirmed bar data to prevent false alerts from incomplete candles.
Settings Overview
Settings are organized into logical groups:
VWAP Settings
Anchor Period selection
Show/Hide VWAP line
Dynamic coloring toggle
VWAP label visibility
Bands Visibility
Toggle each of three bands independently
Info Table
Show/Hide table
Table position (9 options)
Text size
Volume spike label settings with adjustable thresholds
Momentum label settings with filters
Signal labels limited to 5 most recent (auto-managed)
Probability engine lookback period
Multi-Timeframe VWAP
Enable/Disable MTF system
Show MTF in table
Show MTF lines on chart
Individual timeframe toggles
Confluence zone threshold
Squeeze detection toggle
Session VWAPs
Enable/Disable session tracking
Apply to all assets option
Show session labels
Divergence Detection
Enable/Disable divergence
Pivot lookback period
Show divergence labels
Calculated Projection
Enable/Disable projection cone
Projection horizon (5, 10, 15, or 20 bars)
Lookback period in days (30-252)
Minimum samples threshold
Z-Score classification threshold (1.0, 1.5, or 2.0 sigma)
Cloud transparency adjustment
Bullish, bearish, and neutral colors
The Info Table - Your Trading Dashboard
The right side of your chart displays a compact table with up to twelve metrics.
Row-by-Row Breakdown:
Asset and Period - Shows what the indicator detected (US Stock, Crypto, Forex, etc.) and your selected anchor period. The detection happens automatically based on exchange data, so VWAP resets and calculations match your actual trading instrument.
Delta Percentage - How far current price sits from VWAP, expressed as a percentage. Positive means price trades above fair value. Negative means below. Large delta values (beyond 1-2%) often precede mean reversion moves. Day traders watch this for overextension.
Z-Score - Statistical deviation from VWAP measured in standard deviations. Unlike raw delta, Z-Score accounts for volatility. A 2% move in a volatile biotech stock differs from 2% in a stable utility. Z-Score normalizes this. Values beyond plus or minus two sigma occur only 5% of the time statistically.
Trend Direction - Whether VWAP itself is rising, falling, or flat. Rising VWAP means the volume-weighted average price is increasing, which indicates institutional accumulation. Falling VWAP suggests distribution. This differs from price trend since it weights by volume.
Momentum State - Is the trend accelerating or slowing down? This measures the rate of change in VWAP slope. When an uptrend shows slowing momentum, it often precedes reversal. Accelerating momentum in a downtrend can signal capitulation and potential bottom.
Relative Volume - Current bar volume compared to the 20-bar average, shown as percentage. Values above 150% indicate above-average activity. Spikes above 200-300% often mark institutional involvement. Low volume (below 80%) warns of potential fake moves.
MTF Bias - Four checkmarks or X marks showing whether price sits above or below Daily, Weekly, Monthly, and Quarterly VWAP. Four checkmarks means strong bullish alignment across all timeframes. Four X marks indicates bearish alignment. Mixed readings suggest consolidation or transition.
Band Probabilities - Historical statistics showing how often price touched each standard deviation band over your lookback period. This helps you understand if mean reversion or trend following works better for your specific instrument.
Session Status - Which global trading sessions are currently active (Asia, London, New York). Shows checkmarks for active sessions. Important for forex and crypto traders who need to know when major liquidity windows open and close.
Divergence State - Whether the indicator detects bullish or bearish divergence between price and cumulative volume delta. Bullish divergence occurs when price makes lower lows but buying pressure (CVD) makes higher lows, suggesting hidden accumulation.
Confidence Score - A weighted composite of all factors displayed as a progress bar and percentage. Combines MTF alignment, Z-Score, trend direction, volume delta, momentum, and relative volume into a single 0-100 score. Higher scores indicate stronger conviction setups.
Calculated Projection - When the Projection Cone is enabled, shows the historical probability of price direction and expected move. For example: "▲ 67% (+0.8%)" means in similar market states historically, price moved up 67% of the time with an average gain of 0.8%. The system analyzes 27 unique market states based on Z-Score, Trend, and Volume conditions.
Recommended Use Cases
Day Trading Stocks:
Use Session anchor with Band 1 visible. Watch for price returning to VWAP after morning move. Volume spikes near VWAP often mark institutional accumulation zones.
Swing Trading:
Use Weekly or Rolling 21D anchor. Enable MTF lines for Daily and Weekly levels. Trade pullbacks to these levels in direction of MTF bias.
Crypto and Forex:
Enable Session VWAPs. Use Rolling anchors to avoid artificial resets. Monitor session transitions for breakout opportunities.
Mean Reversion:
Focus on Z-Score reaching plus or minus two. Add Band 2 visibility. Combine with slowing momentum for highest probability reversals.
Trend Following:
Watch MTF bias alignment. Four checkmarks plus accelerating momentum plus high volume confirms trend continuation setups.
Projection Planning:
Enable the Calculated Projection to see what happened historically in similar market conditions. Use 5-10 bars for intraday setups, 15-20 bars for swing trade planning. Focus on high probability readings (above 60%) with HIGH confidence (30 or more samples). The cone shows the probable range of outcomes based on actual historical data. Combine with other factors like MTF alignment and volume for higher conviction setups.
Important Notes
The indicator does not repaint. MTF values use previous period's confirmed data.
Rolling VWAP works best on 15-minute timeframes and above due to bar lookback requirements.
Session VWAPs apply to global markets by default (forex, crypto, futures). Enable the all-assets option for stocks if desired.
Volume data for forex represents tick volume, not actual traded volume.
All alert conditions fire only on confirmed (closed) bars to prevent false signals.
The Calculated Projection updates each bar as market state changes. This is expected behavior. The projection shows probabilities based on similar past conditions, not a fixed prediction.
Q AND A
Q: Does this indicator repaint?
A: No. The main VWAP calculation uses standard TradingView VWAP methodology. Multi-timeframe values use previous period's confirmed data with appropriate lookahead settings. All alert signals require bar confirmation.
Q: Why does my Rolling VWAP look different on 1-minute versus 15-minute charts?
A: Rolling VWAP calculates across a fixed number of trading days. On very short timeframes, the bar lookback may hit TradingView limits. For best Rolling VWAP accuracy, use 15-minute or higher timeframes.
Q: Can I use this on any instrument?
A: Yes. The indicator automatically detects asset type and adjusts behavior. Stocks use standard market hours. Crypto uses 24/7 calculations. Forex uses tick volume. Everything adapts automatically.
Q: What does the Confidence Score actually measure?
A: The score combines six weighted factors: MTF alignment (25%), Z-Score position (20%), Trend direction (20%), CVD pressure (15%), Momentum state (10%), and Relative volume (10%). Higher scores indicate more factors aligned in one direction.
Q: Why are Session VWAPs not showing on my stock chart?
A: Session VWAPs apply to 24-hour markets by default (forex, crypto, futures). For stocks, enable the Use for All Assets option in Session VWAP settings.
Q: The Divergence labels appear delayed. Is this a bug?
A: Divergence detection requires pivot confirmation, which needs bars on both sides of the pivot point. The label appears at the actual pivot location (several bars back) once confirmed. This is intentional and prevents false signals.
Q: Can I change the band colors?
A: Yes. Each of the three bands has its own color input setting. You can customize Band 1, Band 2, and Band 3 colors to match your preferences. The defaults are Aqua, Fuchsia, and Purple. The main VWAP line color adapts dynamically based on slope direction or can be set to static blue.
Q: How do I set up alerts?
A: Right-click on the chart, select Add Alert, choose this indicator, and select your desired condition from the dropdown. All conditions include descriptive alert messages with relevant data.
Q: What is the Probability Engine lookback period?
A: This setting determines how many trading days the indicator analyzes to calculate band touch rates and mean reversion statistics. Default is 60 days (approximately 3 months). Longer periods provide more stable statistics but may miss recent behavior changes.
Q: Why do I see fewer labels than expected?
A: Signal labels (Volume, Momentum, Squeeze, Divergence) are limited to 5 most recent labels on the chart to keep it clean. When a new label appears, the oldest one is automatically removed. Additionally, momentum labels have several filters: check the slope multiplier setting (higher values require stronger trends) and the Only Reversal Signals option (when enabled, labels only appear for potential reversals, not trend confirmations).
Q: What is the Calculated Projection and how accurate is it?
A: The Calculated Projection analyzes what happened in past market conditions similar to the current state. It classifies each bar by Z-Score level, Trend direction, and Volume profile (27 unique states), then shows the historical probability of up vs down and the average move size. It is NOT a price prediction or guarantee. The probability shown is how often similar conditions led to up/down moves historically, not a future guarantee. Always use it as one input among many.
Q: Why does the Projection probability change?
A: The projection updates on each bar as market state changes. If Z-Score moves from LOW to MID, or trend shifts from UP to FLAT, the system looks up a different historical category. This is expected behavior. The projection shows what happened in similar past conditions to the current bar's state.
Q: The Projection shows LOW confidence. What does that mean?
A: Confidence levels indicate sample size: HIGH means 30 or more historical cases found, MEDIUM means 15-29 cases, LOW means fewer than 15 cases. When sample size is low, the system uses a fallback: first aggregating by Z-Score plus Trend only (ignoring volume), then by Z-Score only. LOW confidence means less statistical reliability, so weight other factors more heavily in your decision.
Q: Why does the cone sometimes show 50/50 probability?
A: A 50/50 reading means that in similar past market states, price moved up roughly half the time and down half the time. This indicates a neutral or balanced condition where historical patterns provide no directional edge. Consider waiting for a higher probability setup or using other analysis methods.
CREDITS AND ACKNOWLEDGMENTS
Methodology Foundation:
VWAP (Volume Weighted Average Price) - Standard institutional benchmark calculation, widely used since the 1980s for algorithmic execution and fair value assessment
Standard Deviation Bands - Statistical volatility measurement applying normal distribution principles to price deviation from mean
Z-Score Analysis - Classic statistical normalization technique for comparing values across different volatility regimes
Cumulative Volume Delta (CVD) - Order flow analysis concept measuring aggressive buying versus selling pressure
Concept Integration:
Mean reversion probability engine - Custom historical statistics tracking for band touch rates
Momentum acceleration detection - Second derivative analysis of VWAP slope changes
VWAP Squeeze - Volatility compression concept adapted from TTM Squeeze methodology applied to VWAP bands versus ATR
Confidence scoring system - Weighted composite scoring combining multiple technical factors
Calculated Projection Cone - Probability-based projection using 27-state market classification (Z-Score, Trend, Volume) with historical outcome analysis and weighted fallback system
All calculations use standard public domain formulas and TradingView built-in functions. No proprietary third-party code was used.
For questions, feedback, or feature requests, please comment below or send a private message.
Happy Trading!

Market Analysis Pro [Trademy]OVERVIEW
Trademy Market Analysis Pro is a professional-grade trading system that combines advanced momentum analysis with institutional-level Supply/Demand zone mapping. This indicator is designed to provide crystal-clear market analysis with precise risk management tools, creating a complete trading framework within a single, streamlined interface.
Unlike complex indicators that overwhelm traders with information, Trademy focuses on what matters: high-probability setups with clear entry points, defined risk levels, and multiple profit targets. The system is built to eliminate guesswork and provide actionable signals that work across multiple timeframes and asset classes eg: ( INDEX:BTCUSD , NASDAQ:NVDA and more )
CORE CONCEPTS
Advanced Momentum Engine: The foundation of Trademy Market Analysis Pro is a proprietary momentum detection system that identifies true directional shifts in the market. The algorithm analyzes price behavior relative to volatility-adjusted dynamic levels, generating signals only when genuine momentum reversals occur. The "Signal Sensitivity" control allows you to adapt the system from conservative (fewer, higher-quality signals) to aggressive (more frequent opportunities) based on your trading style and market conditions.
Institutional Supply/Demand Zones: The system automatically identifies and plots key institutional levels where significant buying (Demand) or selling (Supply) pressure has occurred. These zones are calculated using advanced price structure analysis, filtered through intelligent overlap detection to ensure only the most relevant zones appear on your chart. When price approaches these levels, they often act as strong support or resistance, providing logical areas for entries and exits.
Intelligent Signal Classification: Not all signals are created equal. Trademy categorizes every signal as either "Normal" or "Strong" based on its alignment with the broader market structure and trend context. Strong signals represent higher-conviction setups where momentum and trend align perfectly, while normal signals indicate counter-trend or early reversal opportunities.
Non-Repainting Architecture: Every signal is locked in at bar close (when enabled), and all TP/SL levels are calculated using volatility measurements captured at the moment of signal generation.
KEY FEATURES
Precision Signal System
Dual Signal Modes: Choose between Normal signals (standard momentum reversals) or Strong signals (high-conviction trend-aligned setups), or view both simultaneously
Wait for Bar Close: Optional no-repaint mode ensures signals only appear after candle confirmation
Visual Signal Hierarchy: Normal signals shown with standard arrows (▲/▼), Strong signals marked with distinctive colors for instant recognition
Adjustable Arrow Sizes: Customize signal display from tiny to large based on your chart preferences
Professional Risk Management
Automated TP/SL Calculation: Three take-profit levels (TP1, TP2, TP3) and one stop-loss level automatically calculated using advanced volatility measurement
Fixed Risk Levels: TP/SL lines are locked at signal generation and never move—providing consistent, reliable risk parameters
Visual Risk Zones: Optional colored zones highlight your risk and reward areas for instant position assessment
Adjustable Risk Multiplier: Scale your targets up or down with a single parameter while maintaining proper risk-reward ratios
Clear On-Chart Labels: Every level displays exact price values in an easy-to-read format
Supply/Demand Zone Mapping
Automatic Zone Detection: System identifies high-probability supply and demand zones using advanced price structure analysis
Anti-Overlap Algorithm: Intelligent filtering prevents zone clutter by removing overlapping levels
Extended Zone Projection: Zones extend into the future, showing you key levels before price reaches them
Break-of-Structure Tracking: Monitors when zones are broken and removes invalidated levels
Fully Customizable: Adjust zone colors, swing length, history depth, and box width to match your analysis style
Visual Customization
Flexible Color Schemes: Customize colors for bull/bear signals, TP/SL levels, and supply/demand zones
Trend Background: Optional background coloring to instantly visualize the current market bias
Support/Resistance Lines: Toggle automatic S/R level plotting from key price pivots
Multiple Arrow Sizes: Choose from tiny, small, normal, or large signal arrows
WHAT MAKES TRADEMY MARKET ANALYSIS PRO DIFFERENT
✅ Simplicity Meets Power
✅ TP/SL Levels
✅ Institutional Zone Integration
✅ Universal Indicator for all markets
✅ Multi-Timeframe Flexibility
BEST PRACTICES
📌 Always Use Stop-Loss: Enable the TP/SL system and respect your stop-loss levels,risk management is key to long-term success
📌 Backtest First: Before live trading, replay historical charts to understand signal behavior on your specific asset and timeframe
📌 Combine Timeframes: Use higher timeframe signals as your bias, enter on lower timeframe signals in the same direction
📌 Watch the Zones: Highest probability setups occur when signals align with supply/demand zones (buy near demand, sell near supply)
📌 Don't Chase: If you miss a signal, wait for the next one,forcing trades leads to losses
📌 Partial Profits: Consider taking partial profits at TP1, moving stop to breakeven, and letting the rest run to TP2/TP3
📩 ACCESS & SUPPORT
This is an invite-only indicator. For access inquiries, please contact via TradingView private message.
Important Disclaimers:
This indicator is a tool for technical analysis and does not constitute financial advice
Past performance does not guarantee future results
Always practice proper risk management and never risk more than you can afford to lose
Trading carries substantial risk of loss and is not suitable for all investors


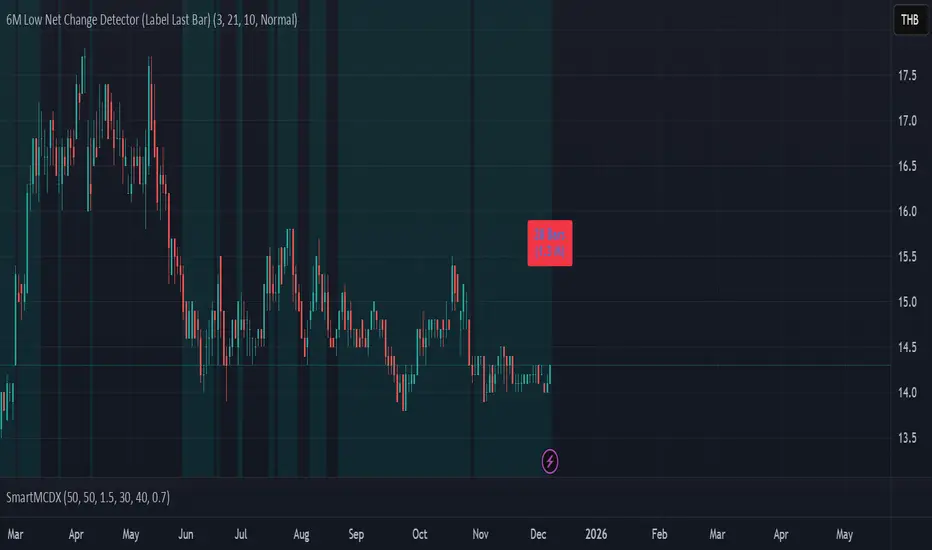
6M Low Net Change Detector (Label Last Bar) PB6M Low Net Change Detector (Label Last Bar) PB for POC script
Market Solver Pro [Eˣ]Market Solver Pro is a multi-layer trend-and-structure based strategy designed to help traders study how price behaves around higher-timeframe support, resistance, and momentum shifts. It combines three core concepts into a single framework:
1. Multi-Timeframe Structure Zones (Support/Resistance Gradient)
The script identifies swing-based higher-timeframe pivot highs (PH) and pivot lows (PL).
These levels form dynamic zones where price frequently reacts. A gradient is displayed between the PH and PL to help traders visually understand where price sits within the broader structure.
This zone system is built using:
A structure timeframe (W/D/60 depending on chart TF)
Multi-step pivot validation
Real-time plot adjustments for consistency
The purpose of this component is to highlight context—whether the market is pressing into resistance, approaching support, or moving through the middle of the structure range.
2. Adaptive Ichimoku-Based Trend Model (Three-Layer Confirmation)
The strategy uses an expanded Ichimoku-style calculation applied across three timeframe multipliers.
Each layer evaluates:
Tenkan-sen slope
Kijun-sen slope
Cloud alignment
Momentum confirmation relative to recent highs/lows
Based on the user’s Risk Appetite (Low/Moderate/High), the strategy selects which layer to prioritize:
Low → Long-term trend consistency
Moderate → Mid-term sensitivity
High → Short-term responsiveness
The result is a trend-state signal (Up or Down) derived from structural and directional agreement across multiple layers.
3. Market Structure Filter (Directional Bias Control)
A price-action-based structure engine classifies swing highs/lows into:
HH (Higher High)
LH (Lower High)
HL (Higher Low)
LL (Lower Low)
The Market Structure Filter uses this information to determine whether higher-timeframe price action supports trend continuation or is compressing into a squeeze condition.
Filters include:
None
Standard
Strict
This prevents trades from triggering during conflicting structural environments unless intentionally allowed.
4. Entry Logic (Long / Short Conditions)
A signal appears only when all active components agree:
Valid chart timeframe
Date-range filter permitting backtest inclusion
HTF structure filter aligned
Trend-state confirmation
Price breaking beyond the current structure zone
Exclusion of opposite pin-bar signatures
When these conditions align, the strategy issues a long or short entry.
5. Stop-Loss Engine (S1/R1 Dynamic Management)
Stop-loss placement is derived from the pivot-timeframe’s S1/R1 levels and the bar of entry.
Two modes are available:
Standard trail: Stop updates with improving S1/R1 levels
2R → Break-Even: Moves stop to break-even on a 2R move, then trails using the stricter of BE or S1/R1
This helps users study how momentum-based trailing behaviour affects risk exposure under different market conditions.
6. Performance Table (Optional Display)
The script can display a performance summary including:
Win/Loss count
Profit factor
Average win/loss
Compounded result
Largest win/loss
Current risk percentage
These statistics reflect the parameters chosen inside the script and can assist in evaluating how different configurations behave when backtesting historical data.
They are not predictive and do not imply future results.
7. Auto vs Manual Settings
Auto Mode: Automatically selects trend multipliers, structure timeframe, and risk mode according to the chart’s timeframe.
Manual Mode: Gives users full control over all parameters and is used by alert conditions.
This allows flexible experimentation across intraday and swing environments.
8. Intended Use
This strategy is designed for educational and analytical purposes—specifically to help traders explore how multi-timeframe trend alignment, market structure, and dynamic support/resistance interact.
It does not guarantee performance and should be used alongside independent analysis, risk management, and market awareness.

Supports & Resistances with Trend Lines EMA + VWAP + RangeSupports & Resistances with Trend Lines + EMA + VWAP + Opening Range
Key Features:
• Automatic Support & Resistance Levels
→ Pivot-based strong S/R detect karta hai
→ Visual boxes + labels ke saath clean display
• Smart Trend Lines (Uptrend & Downtrend)
→ Valid trend lines automatically draw karta hai
→ Fake breakout wali lines filter ho jati hain
→ Green = Uptrend, Red = Downtrend
• 13 EMA (Color Changing)
→ Bullish = Bright Green | Bearish = Red
→ Trend direction ek second mein samajh aata hai
• Session VWAP (Daily Reset)
→ Accurate intraday VWAP with purple line
→ Institutional level ka important reference
• Multiple Opening Ranges
→ 5-minute Opening Range
→ 15-minute Opening Range
→ First 1-Hour Range
→ Full Day High/Low Range
→ Fill + labels + clean lines
• Fully Customizable
→ Har feature ko on/off kar sakte ho
→ Colors, alerts, labels sab change kar sakte ho
Best for: Intraday, Scalping, Swing Trading, BTC/ETH, NIFTY, BANKNIFTY, Stocks, Forex
Alerts Available:
- New Support/Resistance detected
- Support/Resistance breakout
Made with by KingKuldeep, for traders

