RVOL + Volume Z-Score (Textbook)This indicator is a relative-volume and “volume anomaly” dashboard designed to help you quickly spot when a ticker is actually in-play versus simply drifting on normal activity. It plots standard volume bars (colored by up/down candles) and overlays multiple optional smoothers of volume (SMA, LSMA/linear-regression MA, HMA, ALMA) so you can see whether participation is expanding or fading across different smoothing styles. It also calculates RVOL (current bar volume divided by the average volume over a user-defined lookback) and displays RVOL (and Z) in a small table for quick reference.
The core feature is a textbook volume z-score: Z=(V−SMA(V,N))/StDev(V,N)
This measures how far the current bar’s volume is from its recent average in standard-deviation units, making it easy to filter for genuinely unusual volume. The script plots mean + 1σ and mean + 2σ threshold bands and can highlight “anomaly” volume bars when Z exceeds your chosen σ thresholds (default 1σ for broader detection, with alerts available for 1σ/2σ). Use it as a participation filter: combine high RVOL / high Z with your price structure (key levels, VWAP, trend) to validate breakouts or identify high-conviction reversal/flush events.
Penunjuk dan strategi

Trend Tracer [AlgoAlpha]🟠 OVERVIEW
This tool builds a two-stage trend model that reacts to structure shifts while also showing how strong or weak the move is. It uses a mid-price band (from the highest high and lowest low over a lookback) and applies two Supertrend passes on top of it. The first pass smoothens the basis. The second pass refines that direction and produces the final trail used for signals. A gradient fill between the two trails uses RSI of price-to-trail distance to show when price is stretched or cooling off. The aim is to give traders a simple way to read trend alignment, pressure, and early turns without guessing.
🟠 CONCEPTS
The script starts with a mid-range basis. This is the average of the rolling highest high and lowest low. It acts as a stable structure reference instead of raw close or typical price. From there, two Supertrend layers are applied:
• The first Supertrend uses a shorter ATR period and lower factor. It reacts faster and sets the main regime.
• The second Supertrend uses a slightly longer ATR and higher factor. It filters noise, waits for confirmed continuation, and generates the signal line.
The interaction between these trails matters. The outer Supertrend provides context by defining the broader regime. The inner Supertrend provides timing by flipping earlier and marking possible shifts. The gradient fill uses RSI of (close − supertrend value) to display when price stretches away from the trail. This shows strength, exhaustion, or compression within the trend.
🟠 FEATURES
Bullish and bearish flip markers placed at recent highs/lows
Rejection signals off the trend tracer line
Alerts for bullish and bearish trend changes
🟠 USAGE
Setup : Add the script to your chart. Timeframe is flexible; lower timeframes show more flips while higher ones give cleaner swings. Adjust Length to change how wide the basis range is. Use the two ATR settings and factors to match the volatility of the market you trade.
Read the chart : When the refined trail (stv_) sits above price the regime is bearish; when below, it is bullish. The wide trail (stv) confirms the larger move. Watch the gradient fill: darker colors appear when price is stretched from the trail and lighter colors appear when the move is weakening. Flip markers ▲ or ▼ highlight the first clean shift of the refined trail.
Settings that matter : Increasing the Main Factor slows main-trend flips and filters chop. Increasing the Signal Factor delays the timing trail but reduces noise. Shortening Length makes the basis more reactive. ATR periods change how sensitive each Supertrend pass is to volatility.

Volume Profiles on Weekly TWAP and Zscore ColoringThis indicator takes (DeadCats) volume profile and starts a new profile when price reaches a new Weekly TWAP line or deviation line.
The candles are also colored by Z score based on the 5 deviations from the Daily TWAP, which is anchored from previous days settlement time, 14:59:30CT. The max number of deviations can be changed in the settings to change the sensitivity of the z score coloring.

HMA 34 Dual-Fractal Projections - VdubusVdubus MacD Divergence Trend Break Signal Generator :Here:-
HMA 18 Dual-Fractal Projections
Overview
The HMA 18 Dual-Fractal Projections is a technical analysis tool designed to identify market structure and potential breakout patterns by analyzing the pivots of a Hull Moving Average (HMA).
Unlike standard trendline indicators that struggle to balance "big picture" trends with immediate price action, this indicator utilizes a Dual-Fractal approach. It simultaneously calculates two separate timelines—Macro and Micro—to visualize both the dominant channel and the developing chart patterns (such as wedges or triangles) in real-time.
Visual Guide
The indicator plots three key elements on the main chart:
The HMA Line (Blue): A smooth, fast-acting moving average (default length 34) that serves as the baseline for all calculations.
Macro Structure (Solid, Thick Lines):
Red (Solid): Major Resistance.
Green (Solid): Major Support.
Purpose: Identifies the long-term trend channel. These lines react slowly and filter out noise.
Micro Structure (Dashed, Thin Lines):
Red (Dashed): Immediate Resistance.
Green (Dashed): Immediate Support.
Purpose: Identifies the short-term market structure. These lines react quickly to show forming wedges, triangles, or flags.
How It Works
The indicator applies a "Pivot High/Low" algorithm directly to the HMA data rather than raw price data. This filters out candle wicks and volatility, ensuring lines are drawn based on established momentum shifts.
Layer 1 (Macro): Uses a large "Lookback" period (default 44 bars) to find significant peaks and valleys. It connects the most recent major pivot to the previous one, projecting a line forward to show where the major trend channel lies.
Layer 2 (Micro): Uses a small "Lookback" period (default 10 bars) to find local peaks and valleys. This allows you to see how price is behaving within the larger channel.
Settings & Configuration
HMA Settings
HMA Length: The length of the Hull Moving Average.
Default: 34 (Matches the "visually pleasing" setting from recent testing).
Note: Set to 18 for a faster, more reactive baseline (scalping).
Layer 1: Macro (Big Channel)
Macro Lookback: Determines how many bars must pass before a peak is confirmed.
Default: 44. High values find broad, established channels.
Max Macro Lines: How many historical lines to keep on the chart.
Default: 1 (Keeps the chart clean, showing only the current structure).
Extend Macro Lines: Projects the lines infinitely to the right to predict future support/resistance zones.
Layer 2: Micro (Current Pattern)
Micro Lookback: A lower sensitivity setting to catch immediate structure.
Default: 10. Low values will pinpoint the exact boundaries of small wedges or flags forming right now.
Trading Strategy & Interpretation
1. The "Squeeze" (Wedge Identification) This is the primary use case.
Look for scenarios where the Macro Lines (Solid) are wide/parallel, but the Micro Lines (Dashed) are rapidly converging (pointing towards each other).
This indicates that while the main trend is intact, momentum is compressing. A breakout is imminent where the dashed lines intersect.
2. Trend Channels
When both Solid and Dashed lines are roughly parallel and sloping in the same direction, the trend is healthy and strong. Price is respecting both the short-term and long-term momentum.
3. Divergence / Early Reversal Warning
If the Macro Line is sloping UP, but the Micro Line starts sloping DOWN (crossing inside), it indicates a loss of momentum and a potential reversal before the price actually breaks the major trendline.
===========================================================================
2. Micro/Macro Cross Alert
A new input, Enable Micro/Macro Cross Alert, has been added under the "Alerts & Features" section.
This alert condition is triggered when the momentum of the Micro Structure exceeds the momentum of the Macro Structure, which is a high-probability signal for a breakout:
Bullish Alert: The Micro High (dashed red line) crosses above the Macro High (solid red line).
Bearish Alert: The Micro Low (dashed green line) crosses below the Macro Low (solid green line).
To set up the actual alert on your chart:
Right-click on the chart.
Select "Add alert on HMA 34 Dual-Fractal Projections".
In the Condition dropdown, select the indicator's name.
For the main alert criteria, choose "Any alert()".
Select your preferred alert actions (e.g., notification, email).

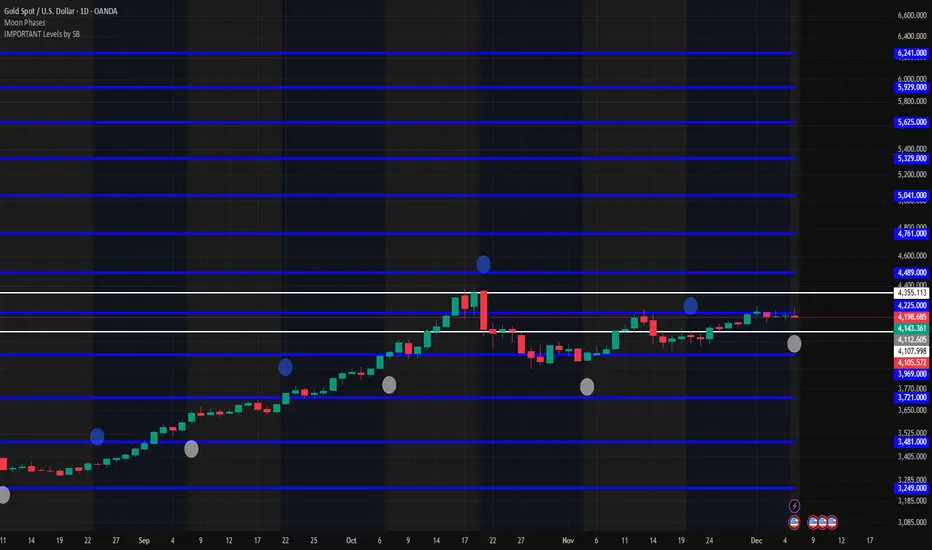
IMPORTANT Levels by SBImportant levels by SB based on gann levels.One can plot these levels once on the chart and can work on these levels .When ever market market come at any of these levels .User can wait for the price action and accordingly user can get inside the trade
Dynamic 15-Ticker Multi-Symbol Table 2025 EditionTitle:
Dynamic 15-Ticker Multi-Symbol Table 2025 Edition
Description:
This script provides a multi-ticker table for TradingView charts. It is fully open-source and free to use. The table displays up to 15 tickers, including SPY as the baseline symbol. The script updates in real-time on any timeframe.
Features:
SPY baseline: The first row always shows SPY for reference.
Custom tickers: Add up to 14 additional tickers via the input settings. Rows without tickers remain hidden.
Price and direction: Each ticker row displays the current price and an indicator of direction based on recent price movement.
RSI (14) indicator: Shows the current relative strength index value with a simple directional marker.
Volume formatting: Displays volume values in thousands, millions, or billions automatically. Volume change is indicated with directional markers.
Stable layout: The table uses alternating row colors for readability and maintains consistent row count without collapsing or disappearing rows.
Real-time updates: All displayed values refresh automatically on any chart timeframe.
How to use:
Add the script to your chart.
Enter your chosen tickers in the input settings. SPY will remain as the first ticker automatically.
Tickers not entered will remain hidden. When a ticker is removed, the row will be removed-dynamically.
Observe live prices, RSI values, and volume changes directly on your chart without switching symbols.
Additional notes:
The script is fully open-source; users are encouraged to modify or improve it.
No external links or references are required to understand its function.
This script does not repaint and does not require additional requests to update values.

Indian Scalper 2025 – PSAR + SMA50 + RSI≤50 + High Volume (75%)Best 1-min / 2-min scalping strategy for NIFTY, BANKNIFTY, FINNIFTY & liquid stocks in 2025
✓ PSAR flip + SMA-50 trend filter
✓ RSI ≤50 (avoids chasing)
✓ Only high-volume candles (bright colour)
✓ Loud mobile alerts with price & SL
✓ 1:2+ RR with PSAR trailing
Works like magic 9:15–11:30 AM and 2–3:20 PM
Made with love for the Indian trading community ♥

Volume Profile on Grid with Zscore ColoringThis indicator takes (DeadCatCode) volume profile and starts a new profile when price reaches a new Grid Interval, chosen in the settings.
The candles are also colored by Z score (colors pulled from ChartPrime) based on the 5 deviations from the Daily TWAP, which is anchored from previous days settlement time, 14:59:30CT. The max number of deviations can be changed in the settings to change the sensitivity of the z score coloring.

VIX/VXV Ratio (TitsNany)This script plots the VXV/VIX ratio, which compares medium-term volatility (90-day fear) to short-term volatility (30-day fear). When the ratio rises above key levels like 1.16 or 1.24, it signals that traders expect future stress, often preceding market pullbacks. When the ratio falls toward or below 1.0, short-term fear is spiking, which typically occurs during active selloffs or volatility events. In short, elevated readings warn of potential market drops ahead, while sharp declines in the ratio reflect panic already hitting the market.

BLACK SWAN SWEEP (DANIELPEREZ)Crt de velas especificas después del sweep buscar la confirmación del order block para tomar una operacio .
Check specific candlesticks after the sweep to find order block confirmation before taking a trade.

Top 20 Adaptive Momentum [Trend Aligned]his script is an automated End-of-Day Momentum Dashboard designed to predict the next trading day's directional bias for the top 20 most volatile stocks. It analyzes institutional price action during the final 10 minutes of the trading session and filters signals based on the long-term trend.
How It Works
Trend Identification: The script calculates a 50-Day Moving Average proxy (using 5-minute data) to determine if a stock is in a Long-Term Uptrend or Downtrend.
Adaptive Signal Logic: Instead of a simple reversal strategy, the script adapts its prediction based on the trend context:
Trend Following: If a stock closes strong (Green) in an Uptrend, it signals Bullish Momentum (continuation).
Mean Reversion: If a stock closes strong (Green) in a Downtrend, it signals Bearish Reversion (fade the bounce).
Dip Buying: If a stock closes weak (Red) in an Uptrend, it signals Bullish Reversion (buy the dip).
Live Backtesting: The dashboard features a "Win Rate (3M)" column. This metric backtests the strategy over the past 3 months for each specific ticker, calculating the percentage of time the predicted bias resulted in a winning trade the following day.
Dashboard Columns
Ticker: The stock symbol.
Prev Day: The overall close vs. open of the previous session.
Trend (50d): The long-term trend direction (UP or DOWN).
BIAS TODAY: The actionable signal for the current session (📈 BULLISH or 📉 BEARISH).
Win Rate: The historical probability of success for this strategy on this specific stock.
Usage: Use this tool pre-market to identify high-probability setups where the previous day's closing momentum aligns with the long-term trend.
To effectively use the Top 20 Adaptive Momentum script, you need to treat it as a Pre-Market Screener. It performs the heavy lifting of analyzing trend, momentum, and historical probability instantly, giving you a "Cheat Sheet" for the trading day.
Here is a step-by-step guide on how to integrate it into your routine:
1. The Setup
Timeframe: Set your chart to 5 Minutes. The logic specifically hunts for the 15:50 (3:50 PM) and 15:55 (3:55 PM) candles, so the calculation works best on this timeframe.
Timing: Check this dashboard before the market opens (e.g., 9:00 AM EST) or shortly after the close (4:05 PM EST) to plan for the next session.
2. Reading the Dashboard Columns
Column What to Look For Actionable Insight
Trend (50d) UP (Green) or DOWN (Red) This tells you the "Big Picture." Only trade in this direction. If Trend is UP, you only want to see Bullish signals. If Trend is DOWN, you only want Bearish signals.
BIAS TODAY 📈 BULLISH Plan: Look for Long/Buy setups at the open. The algorithm predicts price will close higher today.
📉 BEARISH Plan: Look for Short/Sell setups at the open. The algorithm predicts price will close lower.
Win Rate (3M) Percentage (e.g., 65%) Confidence Filter. Only take trades on stocks with a Win Rate above 55-60%. This proves the stock historically respects this specific strategy.
3. The Strategy Scenarios (How to Trade)
Scenario A: The "Trend Continuation" (High Probability)
Dashboard: Trend is UP + Bias is BULLISH.
Context: The stock is strong long-term, and it closed strong yesterday (Momentum).
Execution: Watch for an opening gap up or an early breakout above the pre-market high. Go Long.
Scenario B: The "Dip Buy" (High Probability)
Dashboard: Trend is UP + Bias is BULLISH.
Context: The stock is strong long-term, but it pulled back yesterday (Weak Close). The script identifies this as a discount, not a reversal.
Execution: Watch for the stock to find support early. Use the "Master Sniper" (from your other script) to find a Discount Entry FVG.
Scenario C: The "Trap" (Avoid)
Dashboard: Win Rate is < 50%.
Context: The stock is choppy or news-driven. It does not follow technical momentum rules reliably.
Execution: Skip this stock. Move to the next one on the list.
4. Execution Workflow
Scan: Glance at the dashboard. Identify the 2-3 stocks with Green Bias + Green Trend (for Buys) or Red Bias + Red Trend (for Shorts).
Filter: Ensure their "Win Rate" is decent (over 55%).
Trade: Open the charts for those specific stocks. Use your execution indicators (like the Master Sniper) to time the entry on the 1-minute or 5-minute chart.
By using this dashboard, you stop guessing which stock to trade and focus entirely on executing the best setups.

Greater Moving AverageThe purpose for this indicator is to function as a comprehensive market-state detector, with the primary goal of avoiding a market crash.
Mendoza Lines (V-pattern detection) identify early crash conditions and warn when market structure becomes unstable.
RSI/volume-shaded candles + Supertrend confirm momentum and trend, creating a unified system to avoid major drawdowns.
Enhanced Wyckoff ranges with ATR.
Mendoza lines identify abrupt V-shaped reversals which often precede high-risk crash structures. By tracking both the formation and resolution of these patterns across multiple timeframes, the indicator provides early warning signals when the market is entering unstable territory, allowing traders to step aside before liquidity collapses or structural breakdowns begin.
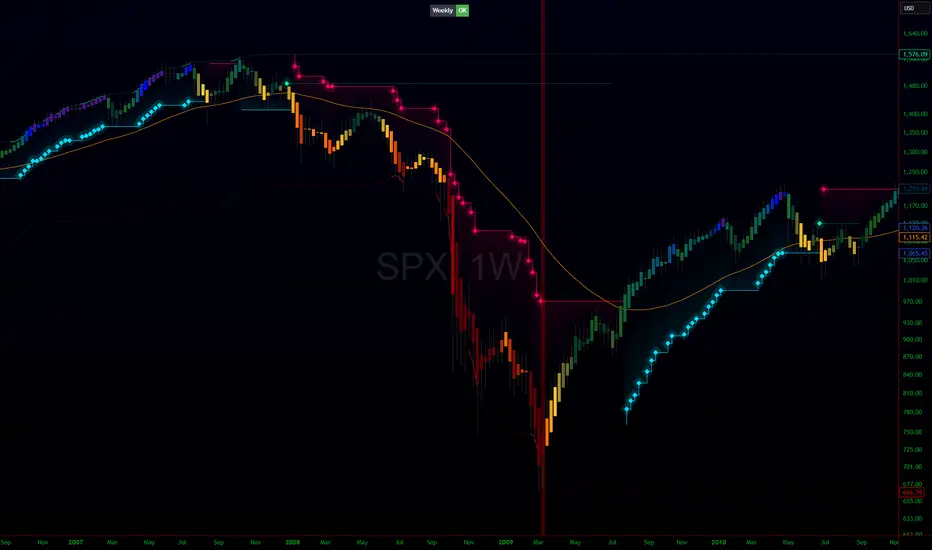
Ideal configurations use Heikin Ashi to smooth out candle structure. Observe SPX on a Weekly Chart, which correctly identifies exits and entries during the 2001 and 2009 crashes. On a 6 hour chart, the Tariff low is correctly identified. The improved VWAP uses a cumulative metric rather than the built in ta.vwap calculation, and functions as a macro low beacon when crossed with the 200 EMA. Historically, these crosses have aligned closely with macro cycle lows.
To round out the system, the indicator overlays RSI-based and volume-weighted candle shading to reflect internal momentum and real buying/selling pressure directly on the chart, making shifts in strength immediately visible. A Supertrend confirmation layer acts as the final filter, smoothing noise and verifying trend direction before decisions are made.
MeanReversion_tradeALERTOverview The Apex Reversal Predictor v2.5 is a specialized mean reversion strategy designed for scalping high-volatility assets like NQ (Nasdaq), ES (S&P 500), and Crypto. While most indicators chase breakouts, this system hunts for "Liquidity Sweeps"—moments where the market briefly breaks a key level to trap retail traders before snapping back to the true value (VWAP).
This is not just a signal indicator; it is a full Trade Manager that calculates your Entry, Stop Loss, and Take Profit levels automatically based on volatility (ATR).
The Logic: Why This Works Markets act like a rubber band. They can only stretch so far from their average price before snapping back. This script combines three layers of logic to identify these snap-back points:
The Stretch (Sigma Score): Measures how far price is from the VWAP relative to ATR. If the score > 2.0, the "rubber band" is overextended.
The Trap (Liquidity Sweep): Identifies Pivot Highs/Lows. It waits for price to break a pivot (luring in breakout traders) and then immediately reverse (trapping them).
The Exhaustion (RSI): Confirms that momentum is Overbought/Oversold to prevent trading against a strong trend.
Key Features
Dynamic Lines: Automatically draws Blue (Entry), Red (SL), and Green (TP) lines on the chart for active trades.
Smart Targets: Two modes for taking profit:
Mean Reversion: Targets the VWAP line (High Win Rate).
Fixed Ratio: Targets a specific Risk:Reward (e.g., 1:2).
Live Dashboard: Tracks Win Rate, Net Points, and the live "Stretch Score" in the bottom right corner.
Alert Ready: Formatted JSON alerts for easy integration with Discord or trading bots.
How & When to Use (User Guide)
1. Best Timeframes
5-Minute (5m): Best for NQ and volatile stocks (TSLA, NVDA). Filters out 1-minute noise but catches the intraday reversals.
15-Minute (15m): Best for Forex or slower-moving indices (ES).
2. The Setup Checklist Before taking a trade, look at the Dashboard in the bottom right:
Step 1: Check the "Stretch (Sigma)". Is it Orange or Red? This means price is extended and ripe for a reversal. If it's Green, the market is calm—be careful.
Step 2: Wait for the Signal.
"Apex BUY" (Green Label): Price swept a low and closed green.
"Apex SELL" (Red Label): Price swept a high and closed red.
Step 3: Execute. Enter at the close of the signal candle. Set your stop loss at the Red Line provided by the script.
3. Warning / When NOT to Use
Strong Trending Days: If the market is trending heavily (e.g., creating higher highs all day without looking back), do not fight the trend.
News Events: Avoid using this during CPI, FOMC, or NFP releases. The "rubber band" logic breaks during news because volatility expands indefinitely.

AlphaNatt | FINAL REVELATION [Visual God]AlphaNatt | The Final Revelation
"Where Information Theory meets Market Geometery."
The AlphaNatt is a comprehensive market structure and volumetric analysis suite designed for the institutional-grade trader. It merges advanced quantitative concepts—specifically Shannon Entropy and Neural Pattern Filtering—with a "Holographic" visual interface that prioritizes clarity over clutter.
This is not just an indicator; it is a complete decision-support system that answers three critical questions:
Is the market chaotic or ordered? (Entropy Engine)
Where is the liquidity? (Volumetric Heatmap)
What is the true structure? (Fractal Geometry)
🌌 The Gen 100 Math Engine
At the core of this script lies a unique implementation of Information Theory.
1. Shannon Entropy (The Chaos Filter)
Most indicators fail because they try to predict "Noise". This script calculates the Entropy (in Bits) of the recent price action.
High Entropy: The market is in a "Random Walk" state. Visuals fade out, transparency increases, and signals are suppressed.
Low Entropy: The market is "Ordered" and approaching a singularity/decision point. Visuals glow brightly to indicate a high-probability environment.
2. Neural Pattern Recognition
The diamond signals (Cyan/Magenta) are not simple simple crossovers. They are driven by a composite logic simulating a neural filter:
Inputs: Normalised RSI + Momentum Divergence + Volatility State.
Logic: Signals only trigger when the market is statistically overextended AND showing signs of momentum decay.
💎 Holographic Features
🔥 Volumetric Heatmap
The script scans historical price action to build a Volume Profile Heatmap on the right side of the chart.
Purple/Blue Zones: These represent High Volume Nodes (HVNs). These act as "Gravity Wells" for price—often stopping trends or acting as launchpads for reversals.
POC (Point of Control): The bright green line indicates the price level with the absolute highest volume in the lookback period.
🌀 Fractal Structure Lines
Price action is often noisy. The script uses a Fractal Pivot Algorithm (Length 5) to identify the "True Highs" and "True Lows".
It connects these points with dashed "Neural Lines" to show the naked market skeleton.
This instantly reveals if you are in a trend of Higher Highs or a breakdown of Lower Lows.
🖥️ The Heads-Up Display (HUD)
A minimalist dashboard keeps you informed of the math underneath:
ENTROPY: The raw bit-score of market chaos.
REGIME: Tells you instantly if you are in "ORDER" (Tradeable) or "CHAOS" (Sit out).
STRUCT: Real-time status of the fractal structure (Breakout/Breakdown/Ranging).
⚙️ Settings & Configuration
Theme: Choose between "Cyber" (Neon), "Aeon" (Deep Blue), or "Gold" (Luxury).
Max Entropy: Adjust the sensitivity of the Chaos Filter. Lower values = stricter filtering (fewer trades).
Heatmap Depth: Control how far back the volume profile scans.
⚠️ Disclaimer
This tool is designed for educational market analysis. "Entropy" and "Neural" refer to the mathematical algorithms used to process price data and do not guarantee future performance. Always manage risk responsible.

Options Scalper v2 - SPY/QQQHere's a comprehensive description of the Options Scalper v2 strategy:
---
## Options Scalper v2 - SPY/QQQ
### Overview
A multi-indicator confluence-based scalping strategy designed for trading SPY and QQQ options on short timeframes (1-5 minute charts). The strategy uses a scoring system to generate high-probability CALL and PUT signals by requiring alignment across multiple technical indicators before triggering entries.
---
### Core Logic
The strategy operates on a **scoring system (0-9 points)** where both bullish (CALL) and bearish (PUT) conditions are evaluated independently. A signal only fires when:
1. A recent EMA crossover occurred (within the last 3 bars)
2. The direction's score meets the minimum threshold (default: 4 points)
3. The signal's score is higher than the opposite direction
4. Enough bars have passed since the last signal (cooldown period)
5. Price action occurs during valid trading sessions
---
### Indicators Used
| Indicator | Purpose | CALL Condition | PUT Condition |
|-----------|---------|----------------|---------------|
| **9/21 EMA Cross** | Primary trigger | Fast EMA crosses above slow | Fast EMA crosses below slow |
| **200 EMA** | Trend filter | Price above 200 EMA | Price below 200 EMA |
| **RSI (14)** | Momentum filter | RSI between 45-65 | RSI between 35-55 |
| **VWAP** | Institutional level | Price above VWAP | Price below VWAP |
| **MACD (12,26,9)** | Momentum confirmation | MACD line > Signal line | MACD line < Signal line |
| **Stochastic (14,3)** | Overbought/Oversold | Oversold or K > D | Overbought or K < D |
| **Volume** | Participation confirmation | Spike on green candle | Spike on red candle |
| **Price Structure** | Breakout detection | Higher high formed | Lower low formed |
---
### Scoring Breakdown
**CALL Score (Max 9 points):**
- Recent EMA cross up: +2 pts
- EMA alignment (fast > slow): +1 pt
- RSI in bullish range: +1 pt
- Above VWAP: +1 pt
- MACD bullish: +1 pt
- Volume spike on green candle: +1 pt
- Stochastic setup: +1 pt
- Above 200 EMA: +1 pt
- Breaking higher high: +1 pt
**PUT Score (Max 9 points):**
- Recent EMA cross down: +2 pts
- EMA alignment (fast < slow): +1 pt
- RSI in bearish range: +1 pt
- Below VWAP: +1 pt
- MACD bearish: +1 pt
- Volume spike on red candle: +1 pt
- Stochastic setup: +1 pt
- Below 200 EMA: +1 pt
- Breaking lower low: +1 pt
---
### Risk Management
The strategy uses **ATR-based dynamic stops and targets**:
| Parameter | Default | Description |
|-----------|---------|-------------|
| Stop Loss | 1.5x ATR | Distance below entry for longs, above for shorts |
| Take Profit | 2.0x ATR | Creates a 1:1.33 risk-reward ratio |
Positions are also closed on:
- Opposite direction signal (flip trade)
- Take profit or stop loss hit
---
### Session Filtering
Trades are restricted to high-liquidity periods by default:
- **Morning Session:** 9:30 AM - 11:00 AM EST
- **Afternoon Session:** 2:30 PM - 3:55 PM EST
This avoids choppy midday price action and captures the highest volume periods.
---
### Input Parameters
| Parameter | Default | Description |
|-----------|---------|-------------|
| Fast EMA | 9 | Fast moving average period |
| Slow EMA | 21 | Slow moving average period |
| Trend EMA | 200 | Long-term trend filter |
| RSI Length | 14 | RSI calculation period |
| RSI Overbought | 65 | Upper RSI threshold |
| RSI Oversold | 35 | Lower RSI threshold |
| Volume Multiplier | 1.2x | Volume spike detection threshold |
| Min Signal Strength | 4 | Minimum score required to trigger |
| Crossover Lookback | 3 | Bars to consider crossover "recent" |
| Min Bars Between Signals | 5 | Cooldown period between signals |
---
### Visual Elements
**Chart Plots:**
- Green line: 9 EMA (fast)
- Red line: 21 EMA (slow)
- Gray line: 200 EMA (trend)
- Purple dots: VWAP
**Signal Markers:**
- Green triangle up + "CALL" label: Buy call signal
- Red triangle down + "PUT" label: Buy put signal
- Small circles: EMA crossover reference points
**Info Table (Top Right):**
- Real-time CALL and PUT scores
- RSI, MACD, Stochastic values
- VWAP and 200 EMA position
- Recent crossover status
- Current signal state
---
### Alerts
| Alert Name | Trigger |
|------------|---------|
| CALL Entry | Standard call signal fires |
| PUT Entry | Standard put signal fires |
| Strong CALL | Call signal with score ≥ 6 |
| Strong PUT | Put signal with score ≥ 6 |
---
### Recommended Usage
| Setting | 0DTE Scalping | Intraday Swings |
|---------|---------------|-----------------|
| Timeframe | 1-2 min | 5 min |
| Min Signal Strength | 5-6 | 4 |
| ATR Stop Mult | 1.0 | 1.5 |
| ATR TP Mult | 1.5 | 2.0 |
| Option Delta | 0.40-0.50 | 0.30-0.40 |
---
### Key Improvements Over v1
1. **Requires actual crossover** - Eliminates false signals from simple trend continuation
2. **Balanced scoring** - Both directions evaluated equally, highest score wins
3. **Signal cooldown** - Prevents overtrading with minimum bar spacing
4. **Multi-indicator confluence** - 8 factors must align for signal generation
5. **Volume-candle alignment** - Volume spikes only count when matching candle direction
---
### Disclaimer
This strategy is for educational purposes. Backtest thoroughly before live trading. Options trading involves significant risk of loss. Past performance does not guarantee future results.

CRR - GANAEMAs on the chart (visual trend)
EMA 15 (white), 30 (yellow), 200 (red).
2️⃣ DASH Engine 1m–5m–15m (+ 1H and 1D)
For each TF (1m, 5m, 15m) it calculates a bull/bear score using:
EMA structure (15, 30, 50, 100, 200).
MACD.
RSI.
Relationship with EMA 30 and VWAP.
FVG in favor.
ATR change (volatility **increasing**).
From this it derives:
t1 (1m), t2 (5m), t3 (15m),
t4 (1H) and t5 (1D) (only for EMA200).
It detects:
ALL BULL → “BULLISH - BUYS ONLY”.
ALL BEAR → “BEARISH - SELLS ONLY”.
Otherwise → “NEUTRAL / MIXED”.
In addition:
Calculates BULL TF vs BEAR TF (%) between 1m–5m–15m.
Displays a visual bar 🐂🟩 vs 🐻🟥.
3️⃣ GOLD News (manual)
Special bar that says:
Neutral
BUY (positive)
SELL (negative)
Paints the HUD with color according to the news you select.
4️⃣ NO RETRACEMENT Alerts (beast mode 💣)
Very strict conditions using the 5 TFs:
BUY NO RETRACEMENT if:
4 or more TFs in bull mode (bullTF_all >= 4),
1m ultra bull (EMA bull, RSI>60, MACD bull, high volume, price above EMA15 and VWAP, FVG ≥ 0).
SELL NO RETRACEMENT is the same but bearish.
Creates alerts:
CRR BUY NO RETRACEMENT
CRR SELL NO RETRACEMENT
5️⃣ PRO LITE Patterns: Double Top / Double Bottom
Detects double tops and double bottoms with:
Minimum bar distance.
Tolerance in %. Optional filters:
MACD, RSI, ATR (volatility), volume, FVG.
If everything aligns:
Plots SELL at double top.
Plots BUY at double bottom.
6️⃣ TOP Indicators Block (SMI + WaveTrend + Supertrend)
SMI (momentum), WaveTrend, and Supertrend:
Counts which are in bull mode and which are in bear mode.
Displays:
TOP IND: BULLS XX% | BEARS YY%.
7️⃣ Integrated Internal SMC Module
Structure HH, LH, HL, LL.
BMS (break of structure) and ChoCH (change of character).
Filter with ATR + volume + MACD + gaps.
Internal Fibonacci of the last range (38.2, 50, 61.8).
Dotted yellow lines of the current range (swing high/low).
🧠 In short:
It's your command center for XAUUSD:
Global mode (buy only / sell only / mixed),
% of timeframes favoring bulls/bears,
gold news,
no-lag alerts,
filtered double top/bottom,
TOP indicators,
and complete SMC (structure + BMS/ChoCH + Fibonacci + range)...
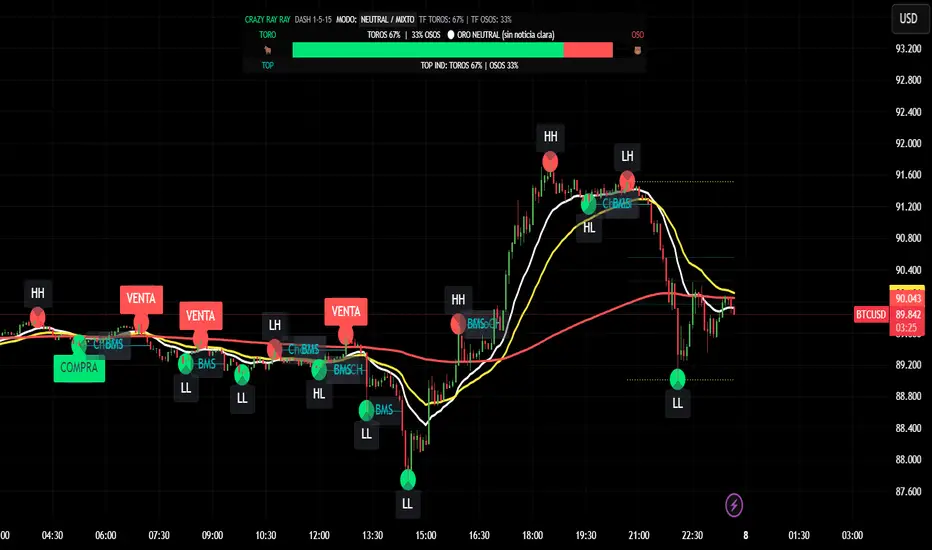
all integrated into a single CRAZY RAY RAY HUD
ICT Quant-Core: Liquidity Intelligence [Dual-Engine]🔥 THE ULTIMATE LIQUIDITY FILTERING ENGINE
Most SMC traders lose money because they "catch falling knives" on every local wick. This algorithm solves this problem by using DUAL-CORE logic and a signal quality scoring system.
This is no ordinary pivot indicator.
⚙️ HOW DOES IT WORK? (DUAL-CORE LOGIC)
The algorithm analyzes the market on two levels simultaneously:
1️⃣ MACRO CORE (Lookback 50 - "WHALE 🐋")
Tracks key levels from recent weeks/months.
This is where institutions build their positions.
Signals from this core have the highest priority (Score 10/10).
2️⃣ LOCAL CORE (Lookback 20 - "ROACH 🐟")
Tracks internal market structure and noise.
Signals are filtered by the Main Trend. If the trend is down, Local Longs are marked as "TRAP."
🧠 SMART FILTERS (QUANT LAYERS)
Instead of entering on every line touch, the script requires confirmation:
✅ RECLAIM LOGIC: Price must close back above/below the liquidity level (Swing Failure Pattern).
✅ RVOL FILTER: Requires relative volume > 1.2x the average (institutional track).
✅ SCORING SYSTEM (0-10): Each signal receives a score.
- 10/10: Macro Grab in line with the trend + high volume.
- 3/10: Local Grab against the trend (risky).
📊 ANALYTICAL DASHBOARD
In the lower right corner, you'll find the "Command Center":
- Trend Status (Distribution/Accumulation)
- Whale's Last Move (Price and Direction)
- Current Tactics (e.g., "Ignore Longs, Search for Shorts")
- Filter Status (RSI, Volume, Reclaim)
🚀 HOW TO USE IT?
1. Set the H4 timeframe.
2. Wait for a signal with a rating > 7/10.
3. Ignore "Fish/Local" signals (small icons) if they contradict the Dashboard color.
4. Entry occurs only after the candle closes (Reclaim).

3-Bar Inversion Pattern (Entry & Invalidation Levels)Very simple 3-bar inversion pattern looking for a bar that extends in the previous bar's direction, bar 2 having a body no bigger than 50% of bar 1's. and Bar 3 having a body close beyond the open of bar 1. Invalidation is set to the highest point of the 3 par pattern.

5% Move Counter (Up vs Down)5% Move Counter (Up vs Down)
This indicator tracks how many times a stock has made a 5% or larger move in a single session, and shows the count separately for up days and down days. It’s meant for traders who want quick context on whether a stock has a history of making large moves, instead of manually scrolling through years of price action.
Most tools only tell you what’s happening right now. This one helps you understand what the stock is capable of.
What it shows
Number of 5%+ up days
Number of 5%+ down days
Optional display modes:
All
Up Only
Down Only
Why it’s useful
Different stocks behave differently. Some give clean, powerful bursts when they break out, while others rarely move big even when the setup looks perfect. This tool helps you gauge a stock’s historical “explosiveness” so you can decide whether your strategy fits its behavior.
If your setups depend on volatility or momentum, it helps to know whether the stock has produced big moves before. This gives you that information instantly.
Customization
You can place the stats box anywhere on the chart using a simple 1–9 selector.
You can hide the rows you don’t need through a dropdown.
When a row is hidden, its background becomes fully transparent so the chart stays clean.
Who it’s for
Short-term traders, breakout traders, swing traders, and anyone who wants a quick read on whether a stock moves enough to justify certain types of trades.

Support & Resistance Auto-Detector by Rakesh Sharma📊 SUPPORT & RESISTANCE AUTO-DETECTOR
Automatically identifies and displays key price levels where traders make decisions. No more manual drawing - let the algorithm do the work!
✨ KEY FEATURES:
- Auto-detects Swing High/Low levels with strength rating
- Previous Day High/Low (PDH/PDL) - Most important intraday levels
- Previous Week High/Low (PWH/PWL) - Strong swing levels
- Previous Month High/Low (PMH/PML) - Major turning points
- Round Number levels (Psychological barriers)
- S/R Zones (Better than exact lines)
- Breakout/Breakdown alerts
- Live Dashboard with trade bias
🎯 PERFECT FOR:
Nifty, Bank Nifty, Stocks, Forex, Crypto - All markets, all timeframes
⚡ SMART FEATURES:
- Strength Rating: Very Strong/Strong/Medium/Weak
- Distance Calculator: Shows points to next S/R
- Trade Bias: "Buy Dips" / "Sell Rallies" / "Breakout"
- Break Alerts: Get notified on PDH/PDL breaks
- Clean Chart: Shows only most important levels
💡 TRADING EDGE:
Trade bounces at support, rejections at resistance, or breakouts through key levels. Combines perfectly with price action and other indicators.
Created by: Rakesh Sharma


SYXX - HTF Candle Overlay
This script, titled "HTF Candle Overlay by SYXX," is designed to visualize the full range and structure of a higher-timeframe (HTF) candle directly onto a lower-timeframe chart. It helps traders maintain context by showing where the current price action sits relative to a much larger candle's boundaries. Combined with LuxAlgo Volume Node Profile.
1. 🔍 Primary Feature: Higher Timeframe Candle Projection
Configurable Timeframe: The user sets the desired HTF using the Interval input, which defaults to 'D' (Daily). The indicator then tracks the High, Low, Open, and Close of that HTF bar.
Live and Historical Drawing: The script uses box.new to draw boxes representing the candle's full range (High to Low).
Historical Boxes (if changeHTF): When a new HTF candle closes, the completed box for the previous period is drawn.
Live Box (if barstate.islast): The indicator draws a live, dynamic box for the current, incomplete HTF candle, which expands with every new High or Low on the lower chart.
2. 🎨 Visualization & Customization
Color-Coded Bias: The boxes are colored based on the HTF candle's direction:
Bullish/Long (BgLong): Green color is used if the HTF candle closed higher than it opened (close > htfOpen).
Bearish/Short (BgShort): Red color is used if the HTF candle closed lower than it opened.
Box Styling: Users can customize the box's appearance, including border color and style, border thickness, and background opacity (BoxOpacity).
Midline: An optional MidLine is calculated as the average of the HTF High and Low, acting as a potential support/resistance reference point.
Range Display: The indicator can display the range of the box in pips (BoxRangePips) or the percentage of movement relative to the full range (BoxRangePercentage).
Time Labels: It plots time labels that show the start and end time of the completed HTF period (e.g., "07:00 - 11:00").
3. 🚨 Alert System (Placeholders)
The script includes placeholder inputs for standard trading alerts, though the internal logic for checking these conditions is currently commented out or set to false:
Alert: Break Above/Below Box: To signal a breakout of the HTF High or Low.
Alert: Price Re-Enters Box: To signal a pullback back into the range.

Developing Midpoint TrackerDeveloping Midpoint Tracker (DMT)
Original Concept: This indicator tracks key midpoint levels from either session opens or custom timeframe periods, providing precise reference levels for intraday trading decisions.
Dual Tracking Modes:
Session Mode: Tracks midpoints from a specific session start time (e.g., 1800 ET electronic trading open) with full timezone support
Timeframe Mode: Tracks midpoints from any custom timeframe (15m, 1H, 4H, etc.) using higher timeframe OHLC data via request.security()
Core Calculations:
The indicator calculates three distinct midpoint levels:
Open-to-High Midpoint: (Session/Timeframe Open + Highest High) / 2
Open-to-Low Midpoint: (Session/Timeframe Open + Lowest Low) / 2
High-to-Low Midpoint: (Highest High + Lowest Low) / 2
Visual Features:
Horizontal lines extending from the reference period start with customizable colors, styles, and extension length
Smart collision detection prevents duplicate lines at identical price levels
Price labels with transparent backgrounds showing exact values
Optional reference open price line
Real-time info table displaying current mode and all calculated levels
Technical Implementation:
Uses Pine Script's native time() function for accurate session detection across multiple timezones
Employs request.security() for reliable higher timeframe data access
Implements proper line and label management to prevent memory issues
Supports 13 major global timezones including US markets, Europe, and Asia
Use Cases:
Identifying potential support/resistance levels from key price relationships
Setting profit targets and stop levels based on mathematical price midpoints
Analyzing price behavior around session or timeframe-specific reference levels
Multi-timeframe analysis when using custom timeframe mode on lower timeframe charts
This indicator is particularly useful for traders who utilize midpoint reversion strategies or need precise reference levels derived from session or timeframe opens.
