Bayesian Order Flow Predictor📌 Bayesian Order Flow Predictor — Advanced Probability Engine for Nasdaq and Futures
This indicator is a next-generation probabilistic forecasting system designed for Nasdaq traders who rely on Order Flow, Auction Market Theory, Value Area dynamics, market structure, DOM imbalance, and Bayesian probability models.
It combines 7 professional-grade factors (DOM, CVD, RSI, EMA trend, ATR volatility, Market Structure, Value Area positioning) into a unified Bayesian probability panel that outputs a clean bullish/bearish probability curve with high-confidence reversal and trend-continuation signals.
Engineered for scalpers, day traders, futures traders, and ICT-style order flow technicians, it delivers real-time directional probability, session-aware signals, and optional news-filter exclusion.
⭐ Features
Bayesian Probability Model (0–100%)
DOM imbalance scoring across dynamic depth levels
Cumulative Volume Delta (CVD) scoring
Market structure detection (HH/LL micro-trend shifts)
RSI momentum and overbought/oversold scoring
EMA directional bias + ATR-normalized deviation
Value Area positioning (VAH / VAL / POC) with optional previous-session mode
Session filtering (only signals during active hours)
Automated news filter (exclude signals around scheduled macro events)
Bull/Bear probability zones with background coloring
Anti-repetition system (no double signals in same direction)
Designed for future scalping, futures order flow, and high-precision timing
🧠 Bayesian Probability Engine — How It Works
The model evaluates 7 independent market factors simultaneously:
DOM imbalance
CVD pressure
Market structure
RSI deviation
EMA trend
Value Area position
ATR volatility shift
Each factor is transformed into a normalized score, multiplied by its weighting parameter, and aggregated into a global score.
This score is then passed through a Bayesian logistic function to convert uncertainty into a smooth probability curve, giving traders a clean, mathematically stable, and noise-resistant forecast.
📈 Buy & Sell Signal Logic
Signals trigger when:
Bullish Probability crosses above the user threshold
Bearish Probability crosses below the opposite threshold
Session is active
No protected news event is occurring
This avoids noise, prevents over-signaling, and focuses only on high-confidence inflection points.
🎯Fully compatible with the indicator: ➡️ AI Probabilistic Orderflow scalper
Both indicators synchronize perfectly when used together:
Bayesian panel → trend probability
Scalper v1 → timing + TP/SL engine
Together they create a complete probability-driven revenue management system for scalping Future.
📘 How to Use
Add the indicator to your chart
Set your trading session (e.g., 09:30–16:00 EST)
Adjust weights depending on your style (Order Flow / Momentum / Value Area)
Watch the probability curve:
Above threshold → bullish bias
Below threshold → bearish bias
Take signals when the curve crosses thresholds, not when flat
Combine with "AI Probabilistic Orderflow scalper" indicator for execution timing
Avoid high-impact news using the News Filter
💎 Advantages
Professional-grade Bayesian model
Works in all volatility regimes
Noise-resistant and smoother than traditional oscillators
Integrates Order Flow + Auction Theory + Momentum + Volatility
Perfect for NQ scalpers seeking an AI-style probability dashboard
Reduces emotional decision-making
Compatible with any execution strategy
Optimized for high winrate scalping and sniper entries
Penunjuk dan strategi

QuantBot StrategyAutomated opening range breakout strategy for futures and intraday trading. Identifies the initial trading range and executes trades on breakouts with multiple confluence filters.
Key Features:
Opening Range Detection: Automatically identifies and tracks the opening range
Multi-Filter Entry System: Optional confluence filters to improve entry quality
Flexible Profit Targets: Dynamic targets based on recent volatility, or fixed tick/dollar targets
Advanced Position Management: Add to positions at key levels; partial profit-taking with trailing runners
Risk Controls: Multiple stop loss methods, maximum trade limits, and distance filters
Time-Based Filters: Configurable trading hours and days, with optional holiday blackouts
Visual Indicators: Displays trend lines, bands, and range levels on your chart
Designed for disciplined, systematic trading with customizable risk management and position sizing.

Intraday for Options By TradeEarnIntraday for Options By TradeEarn
**High-Probability Scalping Strategy with Leading Indicators & Automation Support**
This strategy is designed for **Intraday Nifty & BankNifty Futures** trading. Unlike traditional strategies that rely on lagging indicators (like Supertrend or Moving Averages), this script uses **Leading Indicators** and **Price Action** to detect momentum bursts *before* they happen.
It is fully optimized for **Options Buying** automation via the **Stoxxo/Algobaba Bridge**.
### 🚀 Key Features
**1. Leading Signal Logic (No Lag)**
* **RSI Momentum:** Filters for strong bullish (>55) or bearish (<45) momentum shifts.
* **Impulse Price Action:** Detects "Smart Money" entries by analyzing candle body size relative to the recent average.
* **ADX Filter:** Built-in "Chop Filter". The strategy will **refuse to trade** in sideways markets (when ADX < 20), protecting your capital from fakeouts.
**2. Smart Risk Management (Rupee-Based)**
* **Auto-Calculation:** You input your Target and Stop Loss in **Rupees (₹)** (e.g., ₹1000 Profit, ₹500 Loss). The script automatically calculates the required Index Points and Ticks based on your Lot Size.
* **Trailing Stop Loss:** Features an intelligent trailing mechanism. (Default: For every ₹25 gain, the SL trails by ₹10) to lock in profits during big trends.
**3. Anti-Overtrading Mechanism (Cooldown)**
* To prevent "revenge trading" or getting caught in volatility, the strategy includes a **Cooldown Period**. After any trade exit, it waits for **5 Candles** (adjustable) before scanning for new signals.
**4. Automation Ready**
* Pre-configured with `MULTILEG` alert strings for **Stoxxo/Algobaba**.
* Sends "LongCall" and "LongPut" tags, allowing your bridge to automatically select the Best Strike (ATM/ITM).
---
### ⚙️ How to Use
1. **Chart:** Use **NIFTY FUTURES** (e.g., `NIFTY1!`) or **BANKNIFTY FUTURES**. (Do not use Spot charts as they lack volume data).
2. **Timeframe:** Optimized for **3 Minutes** or **5 Minutes**.
3. **Inputs:**
* **Target (₹):** Desired profit per lot.
* **Stop Loss (₹):** Max risk per lot.
* **Cooldown:** Number of candles to wait after a trade (Default: 5).
* **Volume Filter:** Uncheck if your data provider does not show Volume on the chart.
**Disclaimer:** This strategy is for educational purposes. Please backtest with your own risk parameters before real trading.

Weekly & Monthly Thresholds + VIX-Based Dynamic TargetsWeekly & Monthly Thresholds + VIX-Based Dynamic Targets
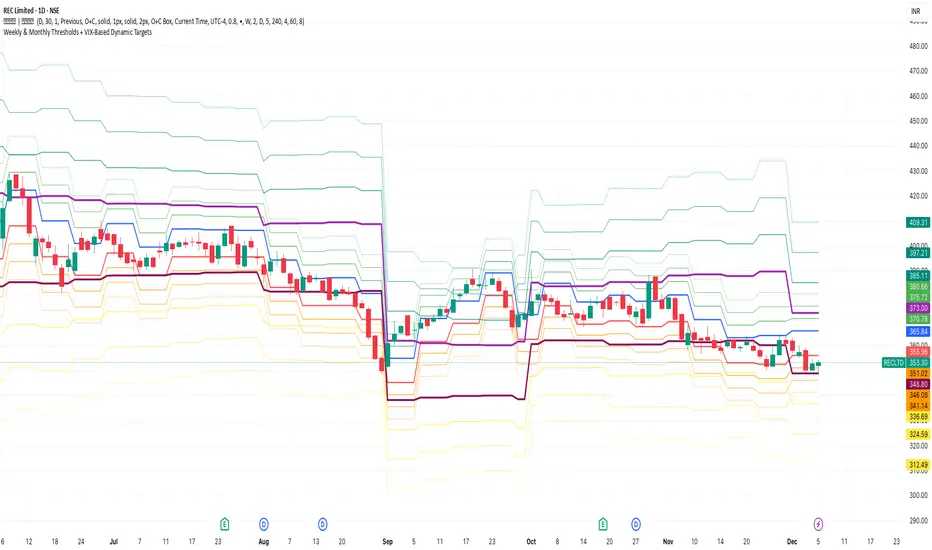
Weekly & Monthly Thresholds + VIX-Based Dynamic TargetsWeekly & Monthly Thresholds + VIX-Based Dynamic Targets

HTF Liquidity Sweep DetectorAn indicator designed to detect liquidity sweeps on Higher Timeframes (HTF), displaying points where price sweeps through the highs or lows of candles on larger timeframes.
Key Features
Supports analysis of 2 timeframes simultaneously (HTF 1 and HTF 2)
Detects both Bullish and Bearish liquidity sweeps
Displays lines and labels with turtle emoji markers
Automatic sweep invalidation system
Customizable line styles, colors, and widths for each HTF
Independent label and turtle emoji display controls
Adjustable label position (Left, Center, Right)
Configurable line extension length
Alert notifications when sweeps are formed
How It Works
Monitors candles on selected higher timeframes
Identifies when price sweeps above previous highs (Bullish Sweep) or below previous lows (Bearish Sweep)
Validates sweep formations and automatically removes invalidated sweeps
Displays sweep lines extending forward with optional labels
Settings
HTF 1 & HTF 2:
Enable/Disable HTF
Timeframe selection
Number of candles to track
Show/Hide sweep lines
Line style (Solid, Dashed, Dotted)
Line width and color
Extend bars length
Show/Hide labels and turtle emojis independently
Label position (Left, Center, Right)
Label size and color
Alerts:
Sweep formation notifications
Use Cases
Identifying liquidity grab zones
Confirming trend reversals
Spotting institutional manipulation patterns
Planning entries after liquidity sweeps

Weekly & Monthly Thresholds + Targets (final, fixed)bullish and bearish weekly and monthly range for the whole audience

Weekly & Monthly Thresholds + Targets (final, fixed)with alerts the weekly and monthly bullish and bearish ranges

ACD STRATEGYACD Opening Range Strategy based off of the strategy of Mark Fischer. It trades off the MGC opening range of all 3 sessions (LDN, ASN, NY)

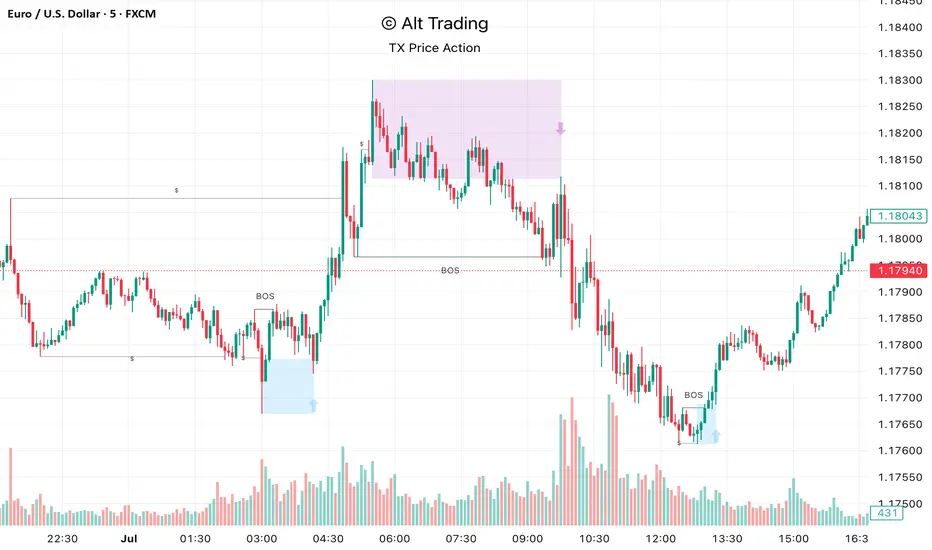
Alt Trading: TX Price Action
The Alt Trading: TX Price Action Indicator is a multi-layered market-structure and liquidity engine built for intraday and swing traders who want a clean, rules-based map of how price is actually moving through liquidity. It runs a fractal-based swing engine in the background to define objective structure, then derives Break-of-Structure (BOS) legs, inducement sweeps, and execution zones from that single model so nothing on the chart is contradictory or “bolted on.” Asian-session profiling builds a dynamic liquidity range that anchors the QuickStrikes filter, allowing you to require BOS and/or entry zones to sit in specific relation to session highs/lows before a setup is even allowed to print. Displacement legs are converted into Fibonacci- and POI-based retracement zones with configurable frequency (High/Medium/Low), automatically projecting forward in time with transparent, non-intrusive boxes for both long and short scenarios. A tiered inducement engine tracks minor (current day), medium (previous day), and major (weekly) highs and lows, promoting levels to permanent lines once they’ve been meaningfully swept, and labeling them directly on the chart for instant context. As sweeps form and BOS confirms, the indicator constructs entry zones, optional risk/reward panels, and live-updating TP/SL visualization boxes that track active long or short scenarios until completion. All elements—zones, BOS lines, inducement levels, fractal structure, arrows, and risk blocks—are fully style-able so the tool can be tuned to any chart theme without losing clarity. TX Price Action doesn’t attempt to “predict” price; instead, it translates complex liquidity behavior into a consistent, visual playbook that makes it easier to systematize premium/discount entries and manage trades with discipline.
Percent Change Histogram + MACandle Percent Move Columns with Optional Moving Average
Description:
This indicator calculates the percentage move of each candle over a specified number of bars and displays it as upward-facing columns, regardless of the candle direction. Each column is color-coded based on the candle’s direction—green for bullish, red for bearish. An optional moving average can be overlaid on the percentage values to help visualize trends and smooth out volatility.
Features:
Shows each candle’s percentage move as a column facing upward.
Columns are colored according to candle direction.
Adjustable input for the number of bars used in calculation.
Optional moving average overlay that can be added or removed.
Helps quickly assess volatility and trend strength in percentage terms.
Use Case:
Ideal for traders who want a clear visual representation of individual candle movements in percentage terms, making it easier to spot trends, pullbacks, and volatility patterns across different timeframes.

Bli-Rik : Trend + HTF 34 + HTF RSI Rel + Stoch Filtersprovides you accurate buy and sell signals on 5 mins and 15 mins chart, mainly foe sensex

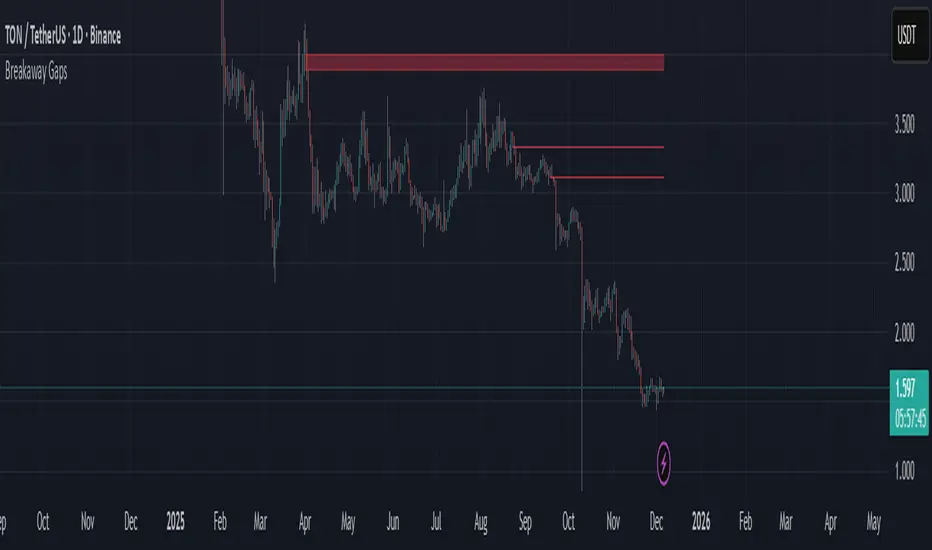
Breakaway Gaps## Breakaway Gaps — Multi-Method Gap & Imbalance Mapping Tool
**Overview**
Breakaway Gaps is a gap-mapping tool designed to highlight areas where price has displaced rapidly and left potential imbalance zones on the chart. It blends multiple detection techniques into one framework, allowing traders to monitor different styles of “breakaway” behavior without clutter or manual drawing.
---
### What the script provides
- **Gap & imbalance zone detection** — identifies areas where price has moved quickly and may have left inefficiencies behind.
- **Breakaway zones** — highlights areas created by strong directional movement or structural shifts in price.
- **Automatic zone management** — highlighted areas extend forward and are removed once price interacts with them, keeping the chart clean.
- **Adjustable behavior** — all major parameters can be tuned: sensitivity, lookback length, displacement thresholds, color themes, and the number of displayed zones.
---
### Why this tool is useful
- Captures different forms of breakaway conditions in a single indicator.
- Helps traders visualize zones that may act as future reaction points, liquidity magnets, or reference areas.
- Designed to keep the chart clean by automatically maintaining and updating all zones.
- Flexible enough to support both discretionary and systematic styles.
---
### What it does *not* do
- Does **not** generate trade signals, entries, exits, stop levels, or position direction.
- Does not predict outcomes or guarantee that any highlighted zone will be respected or filled.
- Should be used as a contextual tool alongside your own analysis and risk management.
---
### Suggested applications
- Identifying potential retracement targets after strong moves
- Marking areas where liquidity may rest or where price may rebalance
- Supporting market structure, breakout, or liquidity-based trading frameworks
- Higher-timeframe context zones combined with lower-timeframe execution
---
### Customization
The tool offers full user control over sensitivity, zoning behavior, highlight style, and display limits, so traders can adapt it to different markets and timeframes.
---
**Disclaimer**
This tool is for chart visualization only. It does not provide financial advice or guaranteed outcomes. Always use proper risk management and your own judgment when trading.
SIFVG [ULTRA+]Introduction
Sweep Inverse Fair Value Gap° is a fully customizable charting tool built to track inversion fair value gap logic that occur after displacement events—specifically when Fair Value Gaps (FVGs) are closed through, and effectively flipping their original state. The tool is inspired by Inner Circle Trader (ICT) concepts, offering a clean visual interface to support traders studying price behaviour after liquidity sweeps, FVG closures, and highlighting mechanical swings targets.
This indicator does not draw zones or suggest direction. It operates entirely on confirmed price events and produces logic-bound visuals designed for traders who already understand IFVG-based reasoning and seek visual consistency across sessions, Timeframe on any instrument.
Key Terms and Definitions
• Swing High / Swing Low: A swing high is a local price peak with lower highs on either side. A swing low is a local trough with higher lows on either side. These are used to detect where liquidity may rest and are required for confirming the initial raid condition in the IFVG model.
• Liquidity Raid: This occurs when price trades through a prior swing high or low, effectively “sweeping” a level where orders may be clustered around. The raid is a required precursor to inversion logic in this model. The tool will not evaluate a potential Fair Value Gap or Inversion Fair Value Gap unless a swing high or low has been taken first.
• Fair Value Gap (FVG): A Fair Value Gap is a price imbalance that occurs when a strong move leaves a gap between candles—specifically, when the high of one candle and the low of a later candle do not overlap. FVGs often emerge during displacement and are commonly studied as inefficiencies within a price leg.
• Inversion Fair Value Gap: An inversion happens when price fully closes through an existing Fair Value Gap that raided liquidity, suggesting the original imbalance rebalanced, and looks to reverse its original role. For example, when a bearish FVG is closed above after raiding a swing low, it may present a shift in orderflow (bullish inversion). The tool recognizes SIFVGs as “inverted” after a candle body candle closes through the gap post raid.
• Displacement: A strong directional price move, typically with momentum, that leaves a Fair Value Gap behind. Displacement is important in inversion logic, as it creates the context and confidence in comparing and contrasting FVGs and Inversions for obvious flips in market behaviour.
• SIFVG Line: Once inversion occurs, the indicator draws a single horizontal array on the candle's close. It marks the start of model activation. This is not a prediction level or a support/resistance area, as it merely serves as a reference for when model logic is sequentially active.
• Opposing Swing: The swing high or low opposite the one that was swept during the initial raid. This becomes the model’s first target for mechanical delivery and is automatically drawn once the IFVG line is plotted. When price reaches this swing, the model has reached its mechanical objective and could offer opportunities for further continuation to additional liquidity pools if orderflow continues to be present.
• Invalidation: The Sweep Inversion Fair Value Gap is considered invalid in one of two scenarios, which the user can toggle individually: a body print back above/below the inversion in bearish/bullish conditions, or trading above/below the most recent swing high/low after the liquidity raid. The SIFVG line will continue extending until the setup is invalidated by the chosen toggle, or when the Opposing Swing is reached.
• Consequent Encroachment (CE): The midpoint (50%) of the FVG or SIFVG. This line can be optionally displayed for users who use the midpoint of imbalances for reference of imbalance respect. It is not required by the model’s internal logic but may assist with discretionary interpretation.
• Description
At its core, SIFVG follows a structured three-step logic sequence: a FVG is created, liquidity is taken, and the Fair Value Gap (FVG) inside of the leg of the raid is closed through, signally a potential orderflow shift. Once inversion is confirmed, an SIFVG line is plotted at the close of the candle that caused the inversion, making it the structural anchor for the model.
The tool does not account for partial fills or candle wicks for FVGs or SIFVGs. Only full-body closures through a qualifying FVG are recognized. When this occurs, a bullish or bearish inversion is plotted and the model becomes active. From there, the opposing swing (the unswept high or low from the displacement leg) is automatically drawn as the target for the model.
Key Features
The Bias allows traders to define whether to track bullish inversions (closing above bearish FVGs), bearish inversions (closing below bullish FVGs), or neutral to see both. This allows isolated directional focus as well as the ability to display all models.
The Session Filter enables traders to define up to four specific Time blocks when the model is permitted to trigger. The Macros Only toggle filters setups further by limiting activation to the first and last 10 minutes of each hour, a filter inspired for intraday traders and scalpers.
How Traders Can Use the Indicator Effectively
SIFVG is not meant to identify trade signals, entries, or exits. It is best used as a visual tracker and confluence for structure-based delivery. The tool excels as a companion for:
Journaling and reviewing SIFVG-based setups across Timeframes and sessions
Studying structural completion or invalidation behaviour
Tracking delayed deliveries and retracement-based logic
Traders using the tool should be familiar with FVG formations, inversion criterias, and the importance of orderflow once an opposing swing is reached.
Usage Guidance
Add the SIFVG to a TradingView chart. This is a fractal script and can be applied across any Timeframe or asset pairing.
Use the SIFVG line to track inversion structure, monitor when inversions are created and negated, and reference the opposing swing to determine whether structural delivery has completed.
Use the SIFVG in combination with your own discretion and narrative to assess when the model has flipped, held, or broken.
Terms and Conditions
Our charting tools are products provided for informational and educational purposes only and do not constitute financial, investment, or trading advice. Our charting tools are not designed to predict market movements or provide specific recommendations. Users should be aware that past performance is not indicative of future results and should not be relied upon for making financial decisions. By using our charting tools, the purchaser agrees that the seller and the creator are not responsible for any decisions made based on the information provided by these charting tools. The purchaser assumes full responsibility and liability for any actions taken and the consequences thereof, including any loss of money or investments that may occur as a result of using these products. Hence, by purchasing these charting tools, the customer accepts and acknowledges that the seller and the creator are not liable nor responsible for any unwanted outcome that arises from the development, the sale, or the use of these products. Finally, the purchaser indemnifies the seller from any and all liability. If the purchaser was invited through the Friends and Family Program, they acknowledge that the provided discount code only applies to the first initial purchase of any Marcus product. The purchaser is therefore responsible for cancelling – or requesting to cancel – their subscription in the event that they do not wish to continue using the product at full retail price. If the purchaser no longer wishes to use the products, they must unsubscribe from the membership service, if applicable. We hold no reimbursement, refund, or chargeback policy. Once these Terms and Conditions are accepted by the Customer, before purchase, no reimbursements, refunds or chargebacks will be provided under any circumstances.
By continuing to use these charting tools, the user acknowledges and agrees to the Terms and Conditions outlined in this legal disclaimer.

Alt Trading: TX ORB Sniper
The Alt Trading: TX ORB Sniper indicator is a precision-engineered opening range breakout system built for serious intraday futures and CFD traders who demand clean, rule-based execution around the cash open. It dynamically constructs a New York session opening range using 1-minute data, then projects that structure onto higher timeframes to identify only the most decisive breakouts above or below the range. Multiple ORB modes (V1–V4) adjust the exact timing and risk model, including a reduced-risk V4 variant with compressed stop placement for more aggressive scalping conditions. A two-stage signal flow distinguishes between “get ready” crosses on the chart timeframe and confirmed entries on the target timeframe, ensuring that traders can anticipate, then verify, each breakout with confidence. Once a valid long or short is triggered, TX ORB Sniper automatically draws evolving risk/reward boxes that extend in real time, locking in entry, stop, and target levels and visually snapping them to the exact bar where the trade concludes. Integrated money management logic computes position sizing from fixed dollar risk, risk-percent, or fixed lot modes, capping maximum size to prevent over-leveraging during volatile sessions. All visual elements gold “ready” candles, range cross lines, and R/R zones are optimized for replay, so historical trades remain crystal clear when studying performance. With its disciplined one-and-done session logic, time-bounded trading window, and robust alert system for both preparation and entry, TX ORB Sniper delivers a complete, exchange-grade framework for systematic opening range breakout execution.

Zumiko ADHD Trend🎶 ZuMiKo – Team of the Future 🎶
ZuMiKo on the front line, competition in the background,
Team number one – everyone knows that!
Indicators like gold, dollars flying by,
The machine does the work, you just count the profits.
Zero accidents, every move is right here,
The algorithm is like a sniper – it hits without fail.
From zero to a hundred, the pace doesn't slow down here,
Whoever bets on ZuMiKo will win and reign supreme tomorrow.
Zu-Mi-Ko! – the future is in motion,
One click and you get a financial boost!
Zu-Mi-Ko! – the plan is fulfilled here,
The machine works, and you count the balance!
A new era of business, no carrying,
The system does the selling, you have time to use.
Phone in your pocket, money spinning,
When others are afraid – our team just rushes ahead.
No bullshit here, just results and facts,
Indicators in the green, like lights for a rocket.
A team like concrete, everyone here is a player,
Either you stand and watch, or you join in and get it!
Zu-Mi-Ko! – the future is in motion,
One click and you get a financial boost!
Zu-Mi-Ko! – the plan is coming true here,
The machine is working, and you're counting your money!
Don't wait for a miracle, because the miracle is already here,
Technology is working for your future and peace of mind.
Don't ask “is it worth it?”, just “when do we start?”,
Because this is the moment to deal the cards.
Zu-Mi-Ko! – it's not a dream, it's a game,
Team number one – this is where you win money!
Zu-Mi-Ko! – jump into the game,
One click separates you from this story!
t.me

MC [PRO+]MC Pro+ Indicator Strategy
Blue Line (MC 1):
Long or Short Trend Indicator When price crosses this blue line level, the trend changes Acts as the primary trend direction signal.
Orange Line (MC 2) :
Works like a magnet, keeping price attracted to it When price is too far from this line, it pulls price back like a magnet (long scenario) Price tends to gravitate towards this level. When this orangheline starts moving downward (loses its strength), the trend may reverse We can start going short even if we're still above the blue line (which indicates long or short) Shows weakening bullish momentum.
RedLine (MC 3):
Ultra Bullish Scenario Used specifically for ultra bullish scenarios Confirms extremely strong upward momentum.
Support/Resistance Function: When any line breaks, it acts as support or resistance
Broken levels become important price zones
Choppy Market Signal: When price is very choppy and not moving much (consolidation) All 3 lines are very close together This signals a major explosive move coming either downward or upward Breakout direction confirmed when blue line is crossed.
This is a multi-timeframe momentum and trend-following system using moving averages as dynamic support/resistance and trend indicators.

Zumiko Haso🎶 ZuMiKo – Team of the Future 🎶
ZuMiKo on the front line, competition in the background,
Team number one – everyone knows that!
Indicators like gold, dollars flying by,
The machine does the work, you just count the profits.
Zero accidents, every move is right here,
The algorithm is like a sniper – it hits without fail.
From zero to a hundred, the pace doesn't slow down here,
Whoever bets on ZuMiKo will win and reign supreme tomorrow.
Zu-Mi-Ko! – the future is in motion,
One click and you get a financial boost!
Zu-Mi-Ko! – the plan is fulfilled here,
The machine works, and you count the balance!
A new era of business, no carrying,
The system does the selling, you have time to use.
Phone in your pocket, money spinning,
When others are afraid – our team just rushes ahead.
No bullshit here, just results and facts,
Indicators in the green, like lights for a rocket.
A team like concrete, everyone here is a player,
Either you stand and watch, or you join in and get it!
Zu-Mi-Ko! – the future is in motion,
One click and you get a financial boost!
Zu-Mi-Ko! – the plan is coming true here,
The machine is working, and you're counting your money!
Don't wait for a miracle, because the miracle is already here,
Technology is working for your future and peace of mind.
Don't ask “is it worth it?”, just “when do we start?”,
Because this is the moment to deal the cards.
Zu-Mi-Ko! – it's not a dream, it's a game,
Team number one – this is where you win money!
Zu-Mi-Ko! – jump into the game,
One click separates you from this story!
t.me

Simple Moving Averages + LabelsSimple Moving Averages
With this indicator, you can add a personal and visual touch to your simple mobile averages, activating and customizing the way you view your SMAs with or without labels and prices.

Alt Trading: Mike's ORB Signal Pro
The Alt Trading: Mike's ORB Signal Pro indicator is a professional opening-range breakout system engineered for precision intraday trading on futures and CFD markets. It dynamically calculates the first 15-minute range (9:30–9:45 AM New York time) using 1-minute granularity, then monitors for clean breakout triggers when price closes decisively above or below these critical levels. The system allows only one long and one short setup per session, ensuring disciplined trade selection and eliminating overtrading. Once a valid breakout occurs, the indicator automatically generates visual risk/reward boxes that extend in real time, displaying entry, stop-loss, and take-profit zones with surgical clarity. Integrated money management logic calculates position size dynamically based on account balance, risk per trade, and stop distance, with support for both MNQ futures ($2/point) and CFD contracts with custom point values. The system caps position size to prevent over-leveraging and displays all critical metrics including raw and rounded contract size, risk percentage, and stop distance in a clean top-right table for instant decision-making. Trades automatically close when price hits the target, stop, or session end (4:00 PM by default), snapping all visual elements to the final bar for historical clarity. Optional session-level lines (CDH, CDL, PDH, PDL) provide additional context for confluence-based entries. With fully customizable styling for risk/reward zones, labels, ORB lines, and watermark branding, this indicator delivers a complete, exchange-grade framework for disciplined breakout trading with transparent risk modeling and real-time visual feedback.

Zumiko Haso🎶 ZuMiKo – Team of the Future 🎶
ZuMiKo on the front line, competition in the background,
Team number one – everyone knows that!
Indicators like gold, dollars flying by,
The machine does the work, you just count the profits.
Zero accidents, every move is right here,
The algorithm is like a sniper – it hits without fail.
From zero to a hundred, the pace doesn't slow down here,
Whoever bets on ZuMiKo will win and reign supreme tomorrow.
Zu-Mi-Ko! – the future is in motion,
One click and you get a financial boost!
Zu-Mi-Ko! – the plan is fulfilled here,
The machine works, and you count the balance!
A new era of business, no carrying,
The system does the selling, you have time to use.
Phone in your pocket, money spinning,
When others are afraid – our team just rushes ahead.
No bullshit here, just results and facts,
Indicators in the green, like lights for a rocket.
A team like concrete, everyone here is a player,
Either you stand and watch, or you join in and get it!
Zu-Mi-Ko! – the future is in motion,
One click and you get a financial boost!
Zu-Mi-Ko! – the plan is coming true here,
The machine is working, and you're counting your money!
Don't wait for a miracle, because the miracle is already here,
Technology is working for your future and peace of mind.
Don't ask “is it worth it?”, just “when do we start?”,
Because this is the moment to deal the cards.
Zu-Mi-Ko! – it's not a dream, it's a game,
Team number one – this is where you win money!
Zu-Mi-Ko! – jump into the game,
One click separates you from this story!
t.me

مؤشر مستويات الهيرو زيرو - 45 و 50حسب مدرسة itc شمعة الهيرو زيرو لآخر ريع ساعة لمؤشر US500 تعطي اشارة واضحه للكول اوالبوت ويفضل الأنظر حتى يرخص العقد الي كان كول او بوت عدم الشراء اكثر من 0.50 سنت للمخاطرة العالية في الهيرو
ان اصبت فمن الله وان اخطأت فمن نفسي والشيطان اخوكم فواز الحربي
للأستفسار التواصل تلقرام HARBE_F16@
According to the ITC school, the Hero Zero candlestick pattern on the last 1/4 hourly chart of the US500 index gives a clear signal for a call or put. It's best to wait until the contract that was a call or put drops. Do not buy more than 0.50 cents due to the high risk associated with Hero Zero.If I am right, it is from God; if I am wrong, it is from myself and Satan. Your brother, Fawaz Al-Harbi
For inquiries, contact me on Telegram: @HARBE_F16

YSR TRIDENT FX - Smoothed Heiken Ashi Candles – 🧿 What This Indicator Does
This indicator plots Smoothed Heiken Ashi Candles with a custom vertical offset, allowing traders to view both:
Regular price candles
Smoothed Heiken Ashi trend candles
side-by-side without overlapping.
Traditional Heiken Ashi candles can hide real price movement.
This version solves that by adding double smoothing + adjustable spacing, giving crystal-clear trend visualization while preserving real market structure.
🔥 Key Features
✅ 1. Dual EMA Smoothing
The script applies smoothing twice:
First smoothing: EMA applied on OHLC
Second smoothing: EMA applied on Heiken Ashi values
This creates ultra-clean trend candles with reduced noise.
✅ 2. Adjustable Vertical Distance (Offset)
Control how far Smoothed HA candles appear from regular candles.
Great for:
Scalpers
Price Action traders
No overlap → cleaner market structure.
✅ 3. Accurate Heiken Ashi Formula
Uses:
HA Close = Average of smoothed OHLC
HA Open = Previous HA Open + Previous HA Close / 2
HA High / Low = True trend-based levels
🌈 Color Coding
Green → Bullish Trend
Red → Bearish Trend
(The colors follow the smoothed structure, not raw candles.)
✔️ Best Used For
Trend following
Reversal filtering
Identifying clean directional bias
Removing noise from volatile markets
⭐ Recommended Settings
Length 1: 9
Length 2: 9
Vertical Distance: 0
These create a smooth but responsive Heiken Ashi display.
