MARAL - Ultra Filtered Execution Master EngineMARAL — Super Premium Execution Intelligence
Ultra-Filtered Master Engine + Signals + Entry Checklist + Live Execution Board
What “MARAL” Means
MARAL = Market Awareness + Risk Alignment + Action Logic
Built to align context → risk → decision clearly on the chart.
________________________________________
What MARAL
MARAL is a super-premium TradingView framework that provides:
• ✅ Sharp Buy/Sell signals
• ✅ Pre-entry permission using a visual checklist
• ✅ Post-entry trade management guidance via a live execution board
• ✅ Probability/score readability to support decisions under pressure
Most indicators stop at: “Buy/Sell.”
MARAL goes further: “Should I take it? Should I stay? Should I protect? Should I partially exit? Should I exit?”
________________________________________
Built From Real Trading (Loss → Discipline → System)
MARAL was developed from 3–4 years of live market study, including my own losses and wins.
It’s built for real execution reliability, not “perfect marketing backtests.”
________________________________________
Why MARAL Is Super Premium
Retail traders don’t fail only because of entries. They fail because of execution mistakes:
• entering without context (bias/structure/volatility mismatch)
• trading inside chop/range repeatedly
• holding losers + cutting winners (emotion exits)
• no partial-profit structure
• revenge trading
• late entries/late exits in overextended moves
MARAL is designed to reduce these execution errors with a structured workflow.
________________________________________
MARAL Architecture & “8-Layer” Intelligence
Many premium tools give 1–3 layers (signals + a couple confirmations).
MARAL is built as a multi-layer execution framework (~8 layers):
1. Signal Layer (Buy/Sell triggers)
2. Higher-Timeframe Bias Layer (directional alignment)
3. Structure Layer (bull/bear structure context)
4. Momentum Layer (RSI + Ultra-Filtered RSI confirmation)
5. Volatility Layer (ATR% tradability)
6. Trend-Strength Layer (ADX environment)
7. Scoring & Probability Layer (Long/Short score + trend vs reversal pressure)
8. Execution Layer (post-entry board: hold/protect/partial exit/exit)
This is why MARAL behaves like an execution intelligence system, not just an arrow tool.
________________________________________
Panel 1 — Ultra-Filtered Master Engine (The Brain)
The Ultra-Filtered Master Engine powers MARAL’s signals + context + scoring.
It continuously evaluates:
• Multi-timeframe bias agreement
• Structure confirmation
• Momentum quality (noise-filtered)
• Volatility & trend strength (tradability)
• Score & probability readability (trend vs reversal pressure)
Result: signals + context, not blind arrows.
________________________________________
Panel 2 — Entry Checklist (Pre-Entry Permission — No Signal Blocking)
Instead of hiding signals, MARAL shows a permission checklist that evaluates context and displays:
ENTRY / WAIT / SKIP
✅ Signals remain visible
✅ Reduces impulsive trades
✅ Trader stays in control
________________________________________
Panel 3 — Execution Board (Post-Entry Decision Support — Premium Edge)
A live execution board guides management decisions:
• Trade Status
• Market Phase (trend/range awareness)
• TP Probability
• Obstacle Ahead (nearby friction/risk)
• Exit Pressure
• Structure State
• Momentum Health
• Score Trend
• Risk State (includes Overextended)
• Trade Age
• Action: Hold / Protect / Partial Exit / Exit / Wait
________________________________________
Where MARAL Works (Clear & Honest)
MARAL is designed for liquid, directional instruments:
✅ Crypto: BTC/ETH + major liquid pairs
✅ Forex: major pairs
✅ Gold: XAUUSD
✅ Indices: major global indices
________________________________________
Important Note for Options Traders — Please Read Before Buying
MARAL is NOT recommended for options premium trading (especially short-dated/OTM), because option pricing is strongly affected by IV, Theta decay, Gamma, spreads, and expiry behavior.
Even if the underlying chart direction is correct, options can lose due to IV crush / time decay. Options require an options-specific model.
If your main trading is options buying/selling, please do not purchase.
________________________________________
MARAL in One Screenshot: How the System Thinks (XAUUSD Example).. Live chart examples and screenshots i will share TradingView posts for the below below example.
MARAL is not a “BUY/SELL arrow” indicator.
It is an Execution Intelligence Engine that gives you:
1. Direction (Bias)
2. Permission (Score + Filters)
3. Execution Guidance (Hold / Exit / Wait)
This is exactly why MARAL is premium: it tells you when to trade and when NOT to trade.
________________________________________
1) Direction Engine: Multi-Timeframe Bias (Trade ONLY with the flow)
In your screenshot, the info panel clearly shows:
• Last Signal: LONG
• Direction: Bullish
• H1 Bias: Bullish
• H4 Bias: Bullish
• Daily Bias: Bullish
• Structure: Bull Struct
✅ Meaning: MARAL is not randomly buying. It first confirms the market is aligned across timeframes, then it allows only LONG execution logic.
This alone filters out a huge number of low-quality trades.
________________________________________
2) Strength & Volatility Filter: “Is the move healthy or dangerous?”
From the same panel:
✅ Meaning: MARAL is measuring whether the move has real trend strength, not just “green candles”.
________________________________________
3) Score Engine: MARAL enters only when confirmations stack
This is the core premium layer:
✅ Meaning:
• MARAL gives a high-quality Long rating
• And it explicitly blocks shorts (“No-Trade”) even if a candle looks tempting.
So buyers understand: MARAL doesn’t overtrade. It filters.
________________________________________
4) Execution Board: The “Professional Dashboard” (why this is premium)
Your left panel says:
• TRADE STATUS: ✅ VALID
• MARKET PHASE: CONTINUATION
• TP PROBABILITY: HIGH
• OBSTACLE AHEAD: NO
• EXIT PRESSURE: LOW
• STRUCTURE: Bull Struct
• MOMENTUM HEALTH: STRONG
• RISK STATE: NORMAL
• ACTION: HOLD
✅ Meaning (simple for buyers):
MARAL is telling you:
“This is a continuation long. Probability is high. Risk is normal. Don’t panic. Hold the position.”
This is what most indicators never do. They give a signal and disappear.
MARAL stays with the trade and guides execution.
________________________________________
5) Signals on the chart: Why multiple BUY labels appear
You can see multiple BUY labels during the uptrend.
That is not “spam signals”. It’s continuation entries:
• After trend confirmation,
• MARAL allows re-entries/pyramiding opportunities only when the filters stay valid.
So the buyer sees:
✅ one system catching an entire move, not just one random entry.
________________________________________
6) The “WAIT” feature (this is a super-premium selling point)
On the right panel (Entry Checklist) you have:
• SETUP: WAIT
• ENTRY PERMISSION: WAIT
✅ Meaning:
Even in a bullish market, MARAL will say WAIT when conditions are not perfect (chop / uncertainty / missing confirmation).
This is the premium story:
“MARAL is not just signals. It tells you when NOT to trade.”
That prevents:
• revenge trades
• overtrading
• entries in messy candles after a spike
Pricing & Early Access (First 100 Users Only)
Special early access pricing applies only for the first 100 users.
After 100 users, pricing will increase.
Early Access Pricing (First 100 Users):
• Monthly: $99
• Quarterly: $249
• Annual: $899
Lifetime Plan (Limited):
• $7500 USD — only 3 seats total (once sold out, lifetime will be closed permanently)
________________________________________
How to Buy
✅ Purchase, Access & Support
📌 Payment & Access
MARAL is an invite-only premium indicator. Access is granted via direct approval.
MARAL is a premium Trading View indicator with manual access control.
To purchase MARAL, please email us first with your Trading View username.
Payment instructions will be shared by email based on your country.
📧 Email: ksharish0468@gmail.com
Access Delivery
Invite-only TradingView access will be granted within 12–24 hours after verification.
A full user manual will be provided along with activation . One Trading View username per purchase.
Support
For technical doubts/support: ksharish0468@gmail.com
Response time: within maximum 12 hours.
Updates
MARAL will be updated with new features over time.
You will receive email notifications if when updates are released.
________________________________________
Terms & Conditions
By purchasing, accessing, or using MARAL, you agree:
1) Nature of Product / No Financial Advice
• MARAL is a decision-support indicator for discretionary traders.
• It is not financial advice, not a recommendation, and not a guarantee of results.
2) No Guarantees / User Responsibility
• Trading involves risk and may result in losses.
• You are solely responsible for entries, exits, position sizing, and risk management.
• Examples shown in screenshots are illustrative and not a promise of performance.
3) License & Access
• Access is licensed to one TradingView account (single user).
• The license is non-transferable unless explicitly approved in writing.
• Access is provided via TradingView invite-only / protected script mechanism.
4) Strict Anti-Piracy / Prohibited Use
You may NOT:
• share access, resell access, or provide it to anyone else
• copy, replicate, reverse engineer, decompile, or attempt to recreate the indicator logic
• publish “clone” indicators derived from MARAL’s workflow
• distribute screenshots/videos intended to reveal proprietary logic or reproduce the system
• use group-sharing, “signal forwarding,” or shared accounts
Violation may result in:
✅ immediate access termination without refund
✅ permanent ban from future access
5) Service Availability / Platform Dependency
• Functionality depends on TradingView uptime, data feeds, Pine limitations, and symbol differences.
• Temporary issues can occur due to platform updates or broker feed variance.
6) Updates / Changes
• Features may be improved, refined, added, or adjusted over time.
• Visual layout may change while preserving core framework.
7) Refund Policy (Digital Access Standard)
• Because this is a digital product with immediate access, refunds are generally not available after access is granted.
• Refund requests due to trading losses, profitability, or user execution choices are not eligible.
• Exceptional cases (duplicate payment / access failure) must be reported within 48 hours for review.
8) Limitation of Liability
• The creator is not liable for trading losses, missed entries, data feed discrepancies, platform downtime, or indirect damages.
• Use is at your own risk.
________________________________________
Disclaimer
MARAL does not guarantee profits. Trade responsibly.
________________________________________
Penunjuk dan strategi

wally H4 Rango Dominante + scanner X20ENGLISH
This script marks the range of the last largest candlestick. You can configure the number of candlesticks to search for the range!
Once it mitigates a high or low and re-enters the range, a signal label appears!
You can lower the timeframe to look for entry confirmation!
It comes with a scanner for 20 manually configurable currencies!

SectorRotationRadar ProThe Sector Rotation Radar is a powerful visual analysis tool designed to track the relative strength and momentum of a stock compared to a benchmark index and its associated sector ETF. It helps traders and investors identify where an asset stands within the broader market cycle and spot rotation patterns across sectors and timeframes.
🔧 Key Features:
Benchmark Comparison: Measures the relative performance (strength and momentum) of the current symbol against a chosen benchmark (default: SPX), highlighting over- or underperformance.
Automatic Sector Detection: Automatically links stocks to their relevant sector ETFs (e.g., XLK, XLF, XLU), based on an extensive internal symbol map.
Multi-Timeframe Analysis: Supports simultaneous comparison across the current, next, and even third-higher timeframes (e.g., Daily → Weekly → Monthly), providing a bigger-picture perspective of trend shifts.
Tail Visualization: Displays a "trail" of price behavior over time, visualizing how the asset has moved in terms of relative strength and momentum across a user-defined period.
Quadrant-Based Layout: The chart is divided into four dynamic main zones, each representing a phase in the strength/momentum cycle:
🔄 Improving: Gaining strength and momentum
🚀 Leading: High strength and high momentum — top performers
💤 Weakening: Losing momentum while still strong
🐢 Lagging: Low strength and low momentum — underperformers
Clean Chart Visualization:
Background grid with axis labels
Dynamic tails and data points for each symbol
Option to include the associated sector ETF for context
Descriptive labels showing exact strength/momentum values per point
⚙️ Customization Options:
Benchmark Selector: Choose any symbol to compare against (e.g., SPX, Nasdaq, custom index)
Start Date Control: Option to fix a historical start point or use the current data range
Trail Length: Set the number of previous data points to display
Additional Timeframes: Enable analysis of one or two higher timeframes beyond the current
Sector ETF Display: Toggle to show or hide the related sector ETF alongside the asset
📚 Technical Architecture:
The indicator relies on external modules for:
Statistical modeling
Relative strength and momentum calculations
Chart rendering and label drawing
These components work together to compute and display a dynamic, real-time map of asset performance over time.
🧠 Use Case:
Sector Rotation Radar is ideal for traders looking to:
Spot stocks or sectors rotating into strength or weakness
Confirm alignment across multiple timeframes
Identify sector leaders and laggards
Understand how a symbol is positioned relative to the broader market and its peers
This tool is especially valuable for swing traders, sector rotation strategies, and macro-aware investors who want a visual edge in decision-making.

Session ATR Progression Tracker📊 Session ATR Progression Tracker - SIYL Regression Trading Tool
Track how much of your instrument's 7-day Average True Range (ATR) has been covered during the current trading session. This indicator is specifically designed for regression traders who follow the "Stay In Your Lane" (SIYL) methodology, helping you identify when the probability of mean reversion significantly increases. If you are interested in more on that check out Rod Casselli and tradersdevgroup.com.
🎯 Key Features:
• Real-time ATR Coverage Percentage - See at a glance what percentage of the 7-day ATR has been covered in the current session
• SIYL-Optimized Thresholds - See at a glance when the instrument has achieved 80% and 100% ATR coverage, the proven thresholds where mean reversion probability increases (customizable)
• Flexible Session Modes:
- Daily: Resets at calendar day change
- Session: Uses exchange-defined trading sessions
- Custom Session: Set your exact session start/end times (perfect for futures traders and international markets)
• Visual Alerts - Color-coded display (gray → orange → red) and optional background highlighting
• Repositionable Display - Choose from 9 screen positions to avoid chart clutter
• Session Markers - Green triangles mark the start of each new session
• Detailed Stats - View current range, ATR value, session high/low, and session status
💡 Why Use This Indicator?
This tool is built around a proven concept: regression trading becomes significantly more effective once a session has achieved at least 80% of its 7-day ATR. At this threshold, the probability of price reverting to mean increases substantially, creating higher-probability trade setups for SIYL practitioners.
Benefits for regression traders:
- Identify optimal entry points when mean reversion probability is highest (≥80% ATR coverage)
- Avoid premature regression entries before adequate range has been established
- Recognize when daily moves have "earned their range" and are ripe for reversal
- Time fade-the-move and counter-trend strategies with statistical backing
- Improve win rates by trading only after proven probability thresholds are met
⚙️ Setup Instructions:
1. Add the indicator to your chart
2. Select your preferred "Reset Mode" (recommend "Custom Session" for futures/international markets)
3. If using Custom Session, enter your session times in 24-hour format (e.g., 0930-1600 for US stocks, 1700-1600 for CME futures)
4. Adjust alert thresholds if desired (default: 80% and 100% - proven SIYL thresholds)
5. Position the display where it's most visible on your chart
📈 Works Across All Markets:
Stocks • Futures • Forex • Indices • Crypto • Commodities
Perfect for regression traders, mean reversion specialists, and SIYL practitioners who want to trade with probability on their side by entering only after the session has "earned its range."
---
Tip: For futures contracts with overnight sessions that span calendar days (like MES, MNQ, MYM), use "Custom Session" mode with your exchange's official session times for accurate tracking.

Price Crossing 144 EMA Alert (No Visuals)Price Crossing 144 EMA Alert (No VisuPrice Crossing 144 EMA Alert (No Visuals)Price Crossing 144 EMA Alert (No Visuals)Price Crossing 144 EMA Alert (No Visuals)Price Crossing 144 EMA Alert (No Visuals)als)

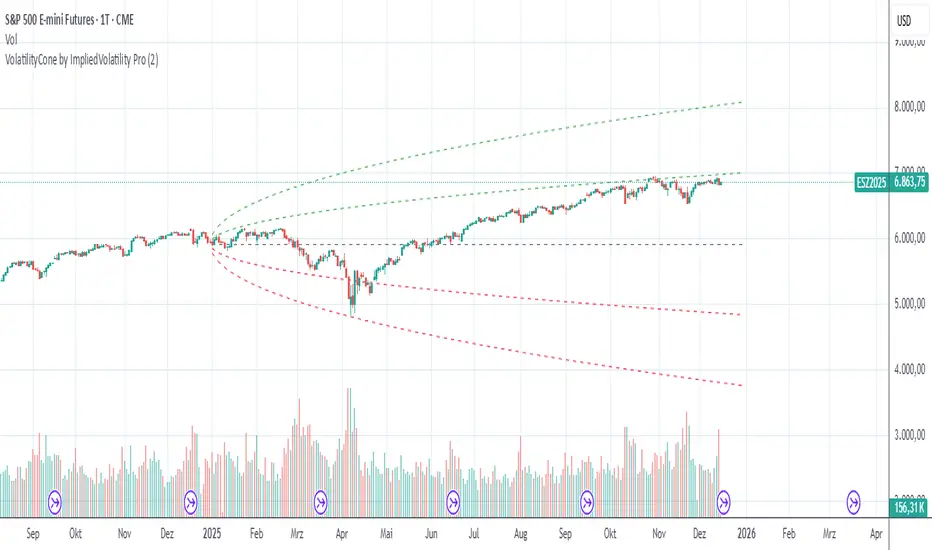
VolatilityCone by ImpliedVolatility ProVolatilityCone by ImpliedVolatility Pro
VolatilityCone by ImpliedVolatility Pro is a forward-looking volatility projection tool that visualizes expected price ranges based on implied volatility.
It draws a volatility cone starting from a user-defined date and projects statistically expected price boundaries into the future using standard deviation theory.
🔍 What does this indicator do?
This indicator calculates and plots price ranges that represent ±1, ±2, and ±3 standard deviations from a starting price, based on implied volatility.
The result is a cone-shaped projection that shows where price is statistically likely to move over time.
In addition, the indicator calculates a Z-Score, showing how far the current price deviates from the expected mean in volatility terms.
📐 Key Features
→ Forward projection based on implied volatility
→ Supports up to 3 standard deviation levels
→ Optional display of half standard deviation levels
→ Manually enter implied volatility or automatically fetch IV from another symbol (e.g. VIX)
→ Custom Start Date
→ The cone starts exactly at the selected date
→ Ideal for earnings, events, or cycle-based analysis
→ Displays the statistical mean price
→ Z-Score indicates how extreme the current price is relative to the cone
📊 How to Use
Price inside the cone
→ Normal volatility behavior
Price near ±1σ
→ Typical volatility range
Price near ±2σ or ±3σ
→ Statistically stretched or extreme conditions
Positive Z-Score
→ Price trading above the mean
Negative Z-Score
→ Price trading below the mean
This makes the indicator useful for:
→ Volatility analysis
→ Mean reversion strategies
→ Risk assessment
→ Event-based forecasting
→ Options-related analysis
⚙️ Notes & Disclaimer
This indicator is not a prediction tool, but a statistical projection
It assumes volatility follows a square-root-of-time model
Best used as a context tool, not as a standalone trading signal
[AlscapeLabs] HTF Candle Stack (Multi-Timeframe)
Overview
The HTF Candle Stack (Multi-TF) indicator is a powerful visualization tool designed to overlay high-timeframe (HTF) price action directly onto your current chart, independent of the chart's price scale. This gives traders a clear, aligned, and non-overlapping view of simultaneous price movements across customizable timeframes.
By stacking the candles horizontally next to the chart's price action, the indicator allows for quick identification of multi-timeframe correlation, trend confluence, and key levels without switching chart timeframes.
Key Features
6 Independent Stacks: Configure up to 6 separate timeframes (e.g., 5m, 15m, 1H, 4H, Daily, Weekly) to view the complete market fractals from micro to macro.
Price-Aligned Visualization : All HTF candle stacks are perfectly aligned with the main chart's vertical price axis
Replay Mode Safe : Includes dedicated logic to prevent "duplicate candles" during Bar Replay, ensuring accurate backtesting and historical analysis.
Toggleable Stacks : Each stack can be individually enabled or disabled via input settings
Dynamic Spacing : The distance between active stacks is automatically calculated and adjusted based on the visibility of the preceding stack.
Settings Guide
Stack Configuration (1 - 6)
Each of the six stacks has identical controls:
Show/Hide : Enable or disable this specific stack.
Timeframe : The specific HTF to display (e.g., "60" for 1 Hour, "D" for Daily).
[*} Count : How many candles to show in this stack (Current Active Candle + Past Closed Candles). Tip: Use higher counts (10-12) for lower TFs (Stack 1-2) and lower counts (2-4) for higher TFs (Stack 5-6)
Candle Color
Controls global coloring
Bullish / Bearish : Customize the body colors.
Wick : Separate control for wick color and transparency
Layout
Distance from Chart : How far (in bars) to the right the first stack begins
Space between Stacks : The gap (in bars) between each active stack.
Candle Width : The thickness of the HTF candles.
Labels
Displays a time-frame next to the active (live) candle in each stack
Show TF Labels : Enable or disable labels through all stacks
Text Color : Label text color
Background : Label background color
Style : Label position (Left, Down)
Size : Label text size (Tiny, Small, Normal, Large, Huge)
Developed by AlscapeLabs

X-Trend Macro Command CenterX-Trend Macro Command Center (MCC) | Institutional Grade Dashboard
📝 Description Body
The Invisible Engine of the Market Revealed.
Traders often focus solely on Price Action, ignoring the massive underwater currents that actually drive trends: Global Liquidity, Inflation, and Central Bank Policy. We created X-Trend Macro Command Center (MCC) to solve this problem.
This is not just an indicator. It is a fundamental heads-up display that bridges the gap between technical charts and macroeconomic reality.
💡 The Idea & Philosophy
Markets don't move in a vacuum. Bull runs are fueled by M2 Money Supply expansion and negative real yields. Crashes are triggered by liquidity crunches and aggressive rate hikes. X-Trend MCC was built to give retail traders the same "Macro Awareness" that institutional desks possess. It aggregates fragmented economic data from Federal Reserve databases (FRED) directly onto your chart in real-time.
🚀 Application & Logic
This tool is designed for Trend Traders, Crypto Investors, and Macro Analysts.
Identify the Regime: Instantly see if the environment is "RISK ON" (High Liquidity, Low Real Rates) or "RISK OFF" (Monetary Tightening).
Validate the Trend: Don't buy the dip if Liquidity (M2) is crashing. Don't short the rally if Real Yields are negative.
Multi-Region Analysis: Switch instantly between economic powerhouses (US, China, Japan) to see where the capital is flowing.
📊 Dashboard Metrics Explained
Every row in the Command Center tells a specific story about the economy:
Interest Rate: The "Gravity" of finance. Higher rates weigh down risk assets (Stocks/Crypto).
Inflation (YoY): The erosion of purchasing power. We calculate this dynamically based on CPI data.
Real Yield (The "Golden" Metric): Calculated as Interest Rate - Inflation.
Green: Real Yield is low/negative. Cash is trash, assets fly.
Red: Real Yield is high. Cash is King, assets struggle.
US Debt & GDP: Fiscal health indicators formatted in Trillions ($T). Watch the Debt-to-GDP ratio—if it spikes >120%, expect currency debasement.
M2 Money Supply: The fuel tank of the market. Tracks the total amount of money in circulation.
↗ Trend: Liquidity is entering the system (Bullish).
↘ Trend: Liquidity is drying up (Bearish).
🧩 The X-Trend Ecosystem
X-Trend MCC is just the tip of the iceberg. This module is part of the larger X-Trend Project — a comprehensive suite of algorithmic tools being developed to quantify market chaos. While our Price Action algorithms (Lite/Pro/Ultra) handle the Micro, the MCC handles the Macro.
Technical Note:
Data Sources: Direct connection to FRED (Federal Reserve Economic Data).
Zero Repainting: Historical data is requested strictly using closed bars to ensure accuracy.
Open Source: We believe in transparency. The code is open for study under MPL 2.0.
Build by Dev0880 | X-Trend © 2025

EMA 8 / 20 / 200Created to easily use the 8/20/200 strategy.
This indicator is designed to give a clear, multi-timeframe view of trend, momentum, and structure using three exponential moving averages.
1. Trend direction (EMA 200 – pink)
The 200 EMA acts as the long-term trend filter.
Price above the 200 EMA suggests a bullish market bias.
Price below the 200 EMA suggests a bearish market bias.
Many traders avoid taking trades against this higher-timeframe direction.
2. Momentum and trade bias (EMA 20 – blue)
The 20 EMA reflects short-term momentum.
When price respects the 20 EMA in an uptrend, pullbacks often provide continuation entries.
In downtrends, the 20 EMA frequently acts as dynamic resistance.
3. Entry timing (EMA 8 – yellow)
The 8 EMA is a fast reaction line used for precise timing.
Crosses of the 8 EMA over the 20 EMA can signal momentum shifts.
Strong trends often show price holding above (or below) the 8 EMA during impulse moves.
4. Confluence and trade filtering
The indicator works best when the EMAs are aligned:
Bullish alignment: EMA 8 > EMA 20 > EMA 200
Bearish alignment: EMA 8 < EMA 20 < EMA 200
Misaligned EMAs usually indicate consolidation or low-probability conditions.
5. Risk management context
EMAs can act as dynamic support and resistance:
Stops are often placed beyond the 20 EMA or 200 EMA depending on trade horizon.
Loss of EMA structure is a warning sign that the trend may be weakening.
In short, the indicator is a trend-first, momentum-second framework that helps you decide when to trade, in which direction, and when to stay out.


Expectativa de Juros (Fed)An indicator that measures future expectations for US interest rates, measured by the difference between the Fed's interest rate and pricing on the CME.

Monthly Hotness RSI (Auto-Calibrated)Indicator of the previous months volatility/vol compared to averages over the last 3-5 years. helps show trend and if the market is 'hot'. indicator is good for showing favourable market conditions.

Pivot Trend [ChartPrime]The Pivot Trend indicator is a tool designed to identify potential trend reversals based on pivot points in the price action. It helps traders spot shifts in market sentiment and anticipate changes in price direction.
◈ User Inputs:
Left Bars: Specifies the number of bars to the left of the current bar to consider when calculating pivot points.
Right Bars: Specifies the number of bars to the right of the current bar to consider when calculating pivot points.
Offset: Adjusts the sensitivity of pivot point detection.
◈ Indicator Calculation:
The indicator calculates pivot points based on the highest and lowest prices within a specified range of bars. It then determines the trend direction based on whether the current price crossed above upper band or crossed below lower band.
Upper and Lower Bands
◈ Visualization:
Trend direction is indicated by the color of the plotted lines, with blue representing an upward trend and red representing a downward trend.
Buy and sell signals are marked on the chart with corresponding symbols (🅑 for buy signals and 🅢 for sell signals).
Buy and sell signals generated by the indicator can be used in conjunction with other technical analysis tools to confirm trading decisions and manage risk.
Overall, the Pivot Trend indicator offers traders a simple yet effective method for identifying potential trend changes and capturing trading opportunities in the market. Adjusting the input parameters allows for customization according to individual trading preferences and market conditions.

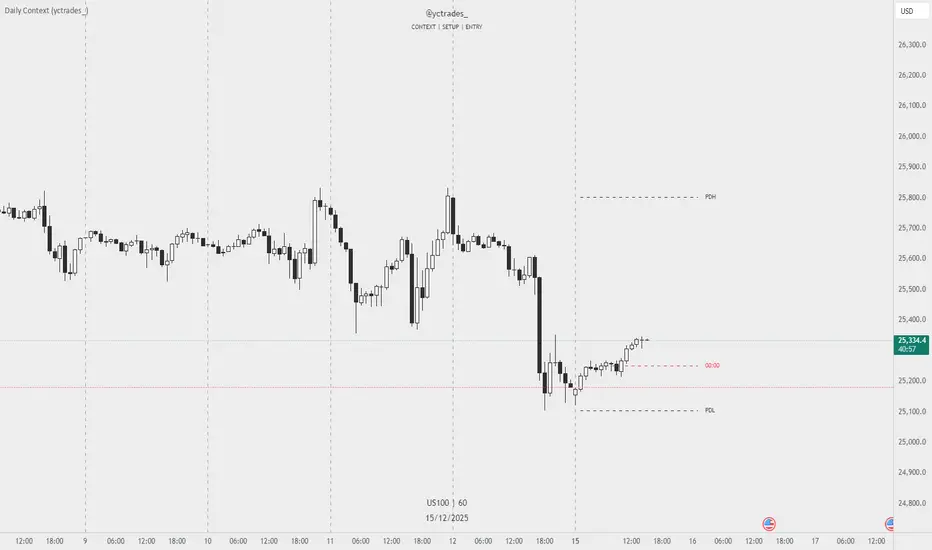
Daily Context (yctrades_)This indicator automatically marks the Previous Day’s High and Low, as well as the market’s midnight opening price.
These levels are updated at the start of each new trading day and remain visible throughout the entire session.
By providing key daily reference points, the indicator helps establish a clear market context and allows traders to immediately understand where price is positioned relative to the previous day’s range and the daily open.
The New York midnight line (00:00 NY) now appears only at the actual NY midnight.
Any previous day’s NY midnight line is automatically deleted when the day changes.
Between the previous NY midnight and the current one, no line is displayed, avoiding clutter or outdated lines.
The line’s color can now be individually customized via NY 00:00 Line + Text Color input, applying to both the line and its label.
Displays a vertical line between each trading day.
Fully customizable in the settings:
Color of the line
Width of the line
Style (solid, dashed, dotted)
This makes it easy to visually separate trading sessions directly on the chart.
PDH / PDL are calculated using UTC 00:00–23:59 to ensure identical levels for all traders worldwide, regardless of market or timezone.
Trend Prediction Meter [PointAlgo]The Trend Prediction Meter & Levels is a composite market-bias and volatility visualization tool designed to summarize trend strength, momentum, price positioning, and volatility into a single normalized score.
It provides a structured framework to interpret directional bias and probable price expansion zones during active market conditions.
Concept Overview
Markets often reflect multiple conditions simultaneously—trend direction, momentum strength, price location within a range, and volatility.
This indicator combines these elements into a unified Bullish Score (0–100), displayed as a meter and supported by projected ATR-based levels.
Rather than focusing on a single signal, the script aims to present context about current market conditions.
Bullish Score Composition (0–100)
The meter represents a weighted blend of multiple market factors:
1. Trend Strength (EMA Structure)
Uses a fast and slow EMA to assess directional bias.
The distance between EMAs is normalized into a trend strength score.
Strong separation indicates directional conviction; compression suggests balance.
2. Momentum Strength (RSI Blend)
Combines a short-term and mid-term RSI.
Helps capture both immediate momentum and broader directional stability.
Higher readings indicate sustained bullish pressure, lower readings indicate bearish pressure.
3. Position Within Recent Range
Measures where price is trading relative to its recent high–low range.
Values near the top of the range reflect strength; values near the bottom reflect weakness.
Mid-range positioning indicates equilibrium.
4. Volume Participation
Compares current volume against its recent average.
Acts as a minor confidence modifier rather than a primary driver.
Each component is normalized and combined using fixed weights to produce a final Bullish Score between 0 and 100.
Bias Classification
The Bullish Score is translated into descriptive market states:
Extreme Bullish
Very Bullish
Bullish
Neutral
Bearish
Very Bearish
These labels describe current bias, not future certainty.
Meter Visualization
The meter plot dynamically changes color based on the score range.
A dashed midline at 50 represents balance.
Background shading highlights strong bullish or bearish dominance zones.
Crossovers of the 50-level indicate shifts in directional control.
ATR-Based Projection Levels:
To provide volatility context, the indicator calculates ATR-based upside and downside reference levels:
Two potential expansion levels (TP1 and TP2) are projected above and below price.
The distance of these levels adapts based on current bias strength.
These levels are contextual reference zones, not fixed targets.
Prediction Dashboard
An optional side table summarizes key readings at the most recent bar:
Symbol
Current bias label
Bullish Score
Current price
ATR value
Upside and downside projection levels
Directional comment (Upside favoured / Downside favoured / Balanced)
This dashboard is designed to provide a quick structural overview without requiring manual calculation.
Signals & Alerts
Built-in alerts are available for:
Bullish bias conditions
Bearish bias conditions
Bullish Score crossing above 50
Bullish Score crossing below 50
Alerts are informational and reflect internal state changes only.
Customization:
Users can adjust:
RSI lengths
EMA lengths
Range lookback period
ATR parameters
Display options for the meter and dashboard
This allows adaptation across different instruments and timeframes.
Usage Notes
Best suited for analytical interpretation rather than standalone decision-making.
Designed to complement price action, structure, or other indicators.
Works across multiple markets where volume and volatility data are available.
Disclaimer :
This indicator is intended for educational and analytical purposes only.
It does not provide investment, trading, or financial advice.
All signals and levels should be validated with independent analysis and appropriate risk management.

Relative Strength Index_YJ//@version=5
indicator(title="MACD_YJ", shorttitle="MACD_YJ",format=format.price, precision=2)
source = close
useCurrentRes = input.bool(true, title="Use Current Chart Resolution?")
resCustom = input.timeframe("60", title="Use Different Timeframe? Uncheck Box Above")
smd = input.bool(true, title="Show MacD & Signal Line? Also Turn Off Dots Below")
sd = input.bool(false, title="Show Dots When MacD Crosses Signal Line?")
sh = input.bool(true, title="Show Histogram?")
macd_colorChange = input.bool(true, title="Change MacD Line Color-Signal Line Cross?")
hist_colorChange = input.bool(true, title="MacD Histogram 4 Colors?")
// === Divergence inputs ===
grpDiv = "Divergence"
calculateDivergence = input.bool(true, title="Calculate Divergence", group=grpDiv, tooltip="피벗 기반 정/역배 다이버전스 탐지 및 알람 사용")
lookbackRight = input.int(5, "Lookback Right", group=grpDiv, minval=1)
lookbackLeft = input.int(5, "Lookback Left", group=grpDiv, minval=1)
rangeUpper = input.int(60, "Bars Range Upper", group=grpDiv, minval=1)
rangeLower = input.int(5, "Bars Range Lower", group=grpDiv, minval=1)
bullColor = input.color(color.new(#4CAF50, 0), "Bull Color", group=grpDiv)
bearColor = input.color(color.new(#F23645, 0), "Bear Color", group=grpDiv)
textColor = color.white
noneColor = color.new(color.white, 100)
res = useCurrentRes ? timeframe.period : resCustom
fastLength = input.int(12, minval=1)
slowLength = input.int(26, minval=1)
signalLength= input.int(9, minval=1)
fastMA = ta.ema(source, fastLength)
slowMA = ta.ema(source, slowLength)
macd = fastMA - slowMA
signal = ta.sma(macd, signalLength)
hist = macd - signal
outMacD = request.security(syminfo.tickerid, res, macd)
outSignal = request.security(syminfo.tickerid, res, signal)
outHist = request.security(syminfo.tickerid, res, hist)
// 가격도 같은 res로
hi_res = request.security(syminfo.tickerid, res, high)
lo_res = request.security(syminfo.tickerid, res, low)
// ── Histogram 색
histA_IsUp = outHist > outHist and outHist > 0
histA_IsDown = outHist < outHist and outHist > 0
histB_IsDown = outHist < outHist and outHist <= 0
histB_IsUp = outHist > outHist and outHist <= 0
macd_IsAbove = outMacD >= outSignal
plot_color = hist_colorChange ? (histA_IsUp ? color.new(#00FF00, 0) :
histA_IsDown ? color.new(#006900, 0) :
histB_IsDown ? color.new(#FF0000, 0) :
histB_IsUp ? color.new(#670000, 0) : color.yellow) : color.gray
macd_color = macd_colorChange ? color.new(#00ffff, 0) : color.new(#00ffff, 0)
signal_color = color.rgb(240, 232, 166)
circleYPosition = outSignal
// 골든/데드 크로스 (경고 해결: 먼저 계산)
isBullCross = ta.crossover(outMacD, outSignal)
isBearCross = ta.crossunder(outMacD, outSignal)
cross_color = isBullCross ? color.new(#00FF00, 0) : isBearCross ? color.new(#FF0000, 0) : na
// ── 플롯
plot(sh and outHist ? outHist : na, title="Histogram", color=plot_color, style=plot.style_histogram, linewidth=5)
plot(smd and outMacD ? outMacD : na, title="MACD", color=macd_color, linewidth=1)
plot(smd and outSignal? outSignal: na, title="Signal Line", color=signal_color, style=plot.style_line, linewidth=1)
plot(sd and (isBullCross or isBearCross) ? circleYPosition : na,
title="Cross", style=plot.style_circles, linewidth=3, color=cross_color)
hline(0, "0 Line", linestyle=hline.style_dotted, color=color.white)
// =====================
// Divergence (정배/역배) - 피벗 비교
// =====================
_inRange(cond) =>
bars = ta.barssince(cond)
rangeLower <= bars and bars <= rangeUpper
plFound = false
phFound = false
bullCond = false
bearCond = false
macdLBR = outMacD
if calculateDivergence
// 정배: 가격 LL, MACD HL
plFound := not na(ta.pivotlow(outMacD, lookbackLeft, lookbackRight))
macdHL = macdLBR > ta.valuewhen(plFound, macdLBR, 1) and _inRange(plFound )
lowLBR = lo_res
priceLL = lowLBR < ta.valuewhen(plFound, lowLBR, 1)
bullCond := priceLL and macdHL and plFound
// 역배: 가격 HH, MACD LH
phFound := not na(ta.pivothigh(outMacD, lookbackLeft, lookbackRight))
macdLH = macdLBR < ta.valuewhen(phFound, macdLBR, 1) and _inRange(phFound )
highLBR = hi_res
priceHH = highLBR > ta.valuewhen(phFound, highLBR, 1)
bearCond := priceHH and macdLH and phFound
// 시각화 (editable 파라미터 삭제)
plot(plFound ? macdLBR : na, offset=-lookbackRight, title="Regular Bullish (MACD)",
linewidth=2, color=(bullCond ? bullColor : noneColor), display=display.pane)
plotshape(bullCond ? macdLBR : na, offset=-lookbackRight, title="Bullish Label",
text=" Bull ", style=shape.labelup, location=location.absolute, color=bullColor, textcolor=textColor, display=display.pane)
plot(phFound ? macdLBR : na, offset=-lookbackRight, title="Regular Bearish (MACD)",
linewidth=2, color=(bearCond ? bearColor : noneColor), display=display.pane)
plotshape(bearCond ? macdLBR : na, offset=-lookbackRight, title="Bearish Label",
text=" Bear ", style=shape.labeldown, location=location.absolute, color=bearColor, textcolor=textColor, display=display.pane)
// 알람
alertcondition(bullCond, title="MACD Regular Bullish Divergence",
message="MACD 정배 다이버전스 발견: 현재 봉에서 lookbackRight 만큼 좌측.")
alertcondition(bearCond, title="MACD Regular Bearish Divergence",
message="MACD 역배 다이버전스 발견: 현재 봉에서 lookbackRight 만큼 좌측.")

EMA 5/9 Angle + Candle Strength (SL=Open, TP=RR)EMA 5 / EMA 9 cross
Cross must have ~30° angle (approximated using slope → atan)
Entry candle must be bullish/bearish and also be Normal / 2nd Most / Most based on body-size percentile
Entry = close of signal candle
SL = open of signal candle
TP = 1:2 RR (editable input)

RSI + STOCH RSI - Marx_CapitalSimple RSI + STOCH RSI indicator in one pane. In addition to the standard 30/70 and 20/80 RSI levels you have three adjustable levels (eg. 0, 50, 100) to indicate STOCH RSI overbought/oversold scenarios.

AlgosPoint G&MPoint Breaking 2025 (MB&GB Breaking Point Pro)
What It Does:
A comprehensive TradingView indicator that combines multiple technical analysis tools to identify key market breakout points, support/resistance levels, and trading opportunities. It integrates Volume Profile analysis, AlphaTrend signals, and custom risk assessment metrics.
Key Features:
Volume Profile Analysis: Displays Point of Control (POC), Value Area High/Low (VAH/VAL), and volume distribution
Support & Resistance Detection: Automatically identifies key price levels based on volume or price action
AlphaTrend Signals: Generates BUY/SELL signals with visual labels on chart
Volume Spike Detection: Highlights unusual volume activity indicating potential exhaustion or breakout
High Volatility Alerts: Marks periods of increased market volatility using ATR
Risk Assessment Dashboard: Real-time panel showing:
Long/Short percentages (RSI-based)
Stop levels for both directions
Bot activity percentage
Csocy Signal status (Safe/Undecided/Risky)
How to Use:
Add to Chart: Apply indicator to any timeframe (works best on 15m-4H)
Configure Settings: Adjust parameters in grouped sections:
📊 General Settings (lookback periods)
🎯 Support & Resistance (line styles/colors)
💥 Volume Spike (threshold sensitivity)
⚡ High Volatility (ATR multiplier)
📈 Volume Profile (display options)
🔥 AlphaTrend (signal sensitivity)
Read Signals:
BUY label = Potential long entry when AlphaTrend crosses up
SELL label = Potential short entry when AlphaTrend crosses down
Dashboard colors: Green = bullish, Red = bearish, Yellow = neutral
Set Alerts: Built-in alerts for price crosses, volume spikes, and signal confirmations
Risk Management: Use displayed stop levels and Csocy Signal status to manage position sizing
Best For:
Day traders and swing traders
Crypto, Forex, and Stock markets
Identifying high-probability breakout zones
Volume-based trading strategies

BRT Support MA [STRATEGY] v2BRT Support MA Strategy v2 - Dynamic Support Line Strategy
📊 Strategy Description
BRT Support MA Strategy v2 is an automated trading strategy based on the analysis of dynamic support and resistance levels using volatility calculations on higher timeframes. The strategy is designed to identify key trend reversal moments and enter positions with optimal risk-to-reward ratios.
🎯 Key Features
Unique strategy characteristics:
1. Multi-Timeframe Volatility Analysis - indicators are calculated on a user-selected timeframe, which allows filtering market noise and obtaining more reliable signals
2. Adaptive Hedging System - a unique algorithm for dynamic position volume calculation during reversals, which accounts for current drawdown and automatically adjusts order size for optimal risk management
3. Visual Trend Indication - dynamic color change of the main line (green = uptrend, red = downtrend) for quick assessment of current market conditions
4. Automatic Signal Markers - the strategy marks trend change moments on the chart with arrows for convenient analysis
5. Limit Orders - entries into positions occur via limit orders at key levels, ensuring better price execution
⚙️ Strategy Settings
Support MA Length - calculation period for the main support/resistance line
Support MA Timeframe - timeframe for indicator calculations (can be set higher than current for noise filtering)
TP (%) - take profit percentage from entry point
SL (%) - stop loss percentage from entry point
Hedge Multiplier - volume multiplier for hedging positions during reversals
📈 Operating Logic
The strategy analyzes the relationship between two dynamic levels calculated based on market volatility. When price breaks through the main support level in the direction of the trend:
Long positions are opened when the main indicator is in an uptrend and price breaks above it
Short positions are opened when the main indicator is in a downtrend and price breaks below it
When there is an open position and an opposite signal forms, the strategy automatically calculates the optimal volume for a hedging position based on the percentage price movement and the set take profit.
🎨 Visual Elements
Blue/Green/Red line - main dynamic support/resistance level (color changes depending on current trend)
Green arrows down ▼ - uptrend reversal signals
Red arrows up ▲ - downtrend reversal signals
TP and SL - displayed in data window for current open position
💡 Usage Recommendations
Test the strategy on historical data of different instruments before use
Optimize parameters for the specific trading instrument and timeframe
Configure TP/SL parameters according to your trading system and risk tolerance
Hedge Multiplier controls hedging system aggressiveness - start with conservative values
⚠️ DISCLAIMER
IMPORTANT! PLEASE READ BEFORE USE:
This script is provided for educational and research purposes only . It is intended for testing on historical data and studying algorithmic trading approaches.
The author is NOT responsible for:
Any financial losses incurred as a result of using this strategy
Trading results in real-time or on demo accounts
Losses arising from incorrect parameter configuration
Technical failures, slippage, and other market conditions
Trading involves a high level of risk and is not suitable for all investors. You can lose all of your invested capital. Do not invest money you cannot afford to lose.
Before starting real trading:
Conduct thorough testing on historical data
Ensure you fully understand the strategy's operating logic
Consult with a financial advisor
Consider broker commissions and slippage
Start with minimum volumes
Past performance does not guarantee future profitability. Use of the strategy is at your own risk.
© MaxBRFZCO | Version 2.0 | Pine Script v5
For questions and suggestions, please use comments under the publication

Put Call Relative StrengthPut–Call Relative Strength (PE/CE RS)
Description
Put–Call Relative Strength compares the premium movement of a Put Option (PE) against a Call Option (CE) to detect bearish pressure in the market.
It uses the ratio:
RS = PE / CE – 1
If Puts gain strength faster than Calls, RS turns positive — indicating bearish dominance.
A moving average line helps you understand trend strength and filter noise.
This is an ideal tool for traders wanting a clear, fast view of downside momentum and Put-led trend shifts.
How to Use
1️⃣ Select PE and CE Symbols
In settings → manually enter:
Put Option (PE)
Call Option (CE)
Same strike + same expiry recommended.
2️⃣ Interpret RS
RS > 0 (Green) → Puts stronger → Bearish bias
RS < 0 (Red) → Calls stronger → Bullish bias
3️⃣ Use RS MA to Confirm Trend
RS MA rising (Green) → Bearish strength increasing
RS MA falling (Red) → Bearish strength weakening
RS MA sideways (Gray) → Indecision / range
4️⃣ Best Use Cases
Intraday short setups
PE scalping
Confirmation for breakdowns
Identifying Put-led strength surges
Best for 1m–10m timeframes

Ghost Scalp Protocol By [@Ash_TheTrader]
# 👻 GHOST SCALP PROTOCOL
### 💀 Stop Getting Trapped. Start Tracking the Banks.
Most retail traders lose because they enter exactly where institutions are exiting. They get caught in **"Stop Hunts"** and **"Fake-Outs."**
The **Ghost Scalp Protocol** is not just an indicator; it is a complete institutional trading system designed for **M1 & M5 Scalpers**. It combines **Smart Money Concepts (SMC)** with a **Physics-Based Momentum Engine ($p=mv$)** to detect high-probability reversals.
---
### ⚛️ THE LOGIC: 3-STAGE CONFIRMATION
This algorithm does not rely on lagging indicators. It uses a 3-step "Protocol" to validate every trade:
**1. THE GHOST TRAP (Liquidity Sweeps)**
* The script automatically draws "Ghost Lines" at key Swing Highs/Lows where retail Stop Losses are hiding.
* It waits for price to **sweep** these levels (Stop Hunt).
* **The Signal:** A Neon **Skull (☠️)** appears *only* if price aggressively rejects the level with high volume. This is the "Turtle Soup" pattern.
**2. THE PHYSICS ENGINE ($p = mv$)**
* Momentum is not just price speed; it is **Mass (Volume) x Velocity (Range)**.
* The dashboard calculates the "Force" of every candle.
* **The Signal:** An **Arrow (⬆/⬇)** appears when momentum surges **5x** above the average. This confirms the banks are pushing the move.
**3. BANK BIAS (Elasticity Filter)**
* Markets move like a rubber band.
* The script calculates a hidden "Fair Value" baseline.
* It creates a **Bias**: It only looks for Shorts in **PREMIUM (Shorting)** zones and Longs in **DISCOUNT (Accumulating)** zones.
---
### 📊 THE SMART DASHBOARD (HUD)
A futuristic, non-intrusive Heads-Up Display keeps you focused on the data that matters:
* **🏦 BANK BIAS:** Tells you if Institutions are likely **Accumulating** or **Shorting**.
* **📈 HTF TREND:** Automatically checks the **1-Hour Trend**. Don't fight the tide.
* **🚀 MOMENTUM:** Real-time Physics calculation.
* **Green Text:** Acceleration (Move is getting stronger).
* **Red Text:** Deceleration (Move is dying).
* **🌍 SESSION:** Shows active Bank Sessions (Tokyo, London, NY).
* **⚠️ OVERLAP ALERT:** Flashes GOLD when London & New York are open simultaneously (Peak Volatility).
---
### 🔥 STRATEGY: HOW TO TRADE
Use this checklist to execute high-probability scalps:
#### 📉 SHORT SETUP (SELL)
1. **Liquidity:** Wait for price to break above a **Red Ghost Line** (Sweep Highs).
2. **Signal:** Wait for the **Pink Skull ☠️** (Trap Detected).
3. **Confluence:**
* Dashboard Bias says: **"SHORTING"**
* HTF Trend says: **"BEARISH 📉"** (Optional but recommended).
4. **Entry:** On the Close of the Skull candle.
5. **Stop Loss:** Just above the wick swing high.
#### 📈 LONG SETUP (BUY)
1. **Liquidity:** Wait for price to break below a **Blue Ghost Line** (Sweep Lows).
2. **Signal:** Wait for the **Blue Skull ☠️** (Trap Detected).
3. **Confluence:**
* Dashboard Bias says: **"ACCUMULATING"**
* HTF Trend says: **"BULLISH 📈"** (Optional but recommended).
4. **Entry:** On the Close of the Skull candle.
5. **Stop Loss:** Just below the wick swing low.
---
### 🏆 RECOMMENDED PAIRS & TIMEFRAMES
* **⚡ Best Timeframes:**
* **1 Minute (M1):** For aggressive "Sniper" entries (High Frequency).
* **5 Minute (M5):** The "Gold Standard" for balanced Scalping.
* **15 Minute (M15):** Safer, higher win-rate Day Trading.
* **💎 Best Assets:**
* **Gold (XAUUSD):** Highly effective on liquidity sweeps.
* **Indices:** US100 (Nasdaq), US30 (Dow Jones).
* **Crypto:** BTCUSD, ETHUSD (High volatility).
* **Forex:** GBPUSD, EURUSD (London/NY Session).
---
### 🛠️ SETTINGS & CUSTOMIZATION
* **Surge Factor:** Default is **5.0x**. Lower this to 3.0 if you want more aggressive Momentum Arrows.
* **Smart Sessions:** Automatically converts to **New York Time** (EST) regardless of your location. No more time zone math.
* **Visuals:** Designed with "Ghost Glow" technology—97% transparent backgrounds that look classy and don't clutter your chart.
---
**"The Ghost Algo sees what you can't."**
*Trade Safe. Trade Smart.*
**~ Ash_TheTrader**
