Session Dynamics & Pivot Overlay (Arjo)## **OVERVIEW**
The **Session Dynamics & Pivot Overlay (Arjo)** is a visual analysis tool that displays session-based price ranges, anchored volume-weighted averages, daily pivot levels, and smoothed trend conditions on the chart. It highlights how price interacts with custom sessions, midpoint levels, and dynamic ranges, providing a structured visual layout that helps users observe market behavior over time without implying any form of prediction or trading signal.
## **CONCEPTS**
This indicator incorporates several widely used analytical concepts:
- **Session Ranges:** Identifies user-defined time windows and visually displays their high, low, and midpoint behavior throughout the session.
- **VWAP (Morning Session):** Shows volume-weighted average price calculations for a defined morning period, assisting with visual comparison between price and weighted averages.
- **Daily Pivot Levels:** Displays R1–R2, S1–S2, central pivot, and associated levels derived from prior daily price data.
- **Trend Smoothing:** Uses SuperSmoother filtering and an additional EMA to highlight whether the smoothed trend is rising or falling.
- **EMA + ATR Bands:** Plots a 20-period EMA with upper and lower ATR-derived bands to help visualize short-term price displacement relative to average true range.
All of these elements are presented solely for structural and comparative chart analysis.
## **FEATURES**
- **Custom Session Visualization:** Automatically draws session boxes, capturing the evolving high, low, and midpoint throughout the defined intraday window.
- **Dynamic Midline Calculation:** A midpoint line is updated continuously during the session to visually anchor price within the session’s range.
- **Morning Session VWAP:** Displays a dedicated VWAP line for the morning window with adjustable source and configuration options.
- **Daily Pivot Lines:** Automatically plots pivot, BC/TC, R1–R2, and S1–S2 levels with customizable colors, widths, and line styles.
- **Trend-Responsive Pivot Display:** Optionally toggles visibility of R2 or S2 depending on the direction of the smoothed trend.
- **EMA + ATR Zones:** Renders a 20-EMA and ATR-based support/resistance zone using filled regions for enhanced visual clarity.
- **Full Customization:** Multiple color, transparency, line-style, and display options allow users to adapt the presentation to their charting preferences.
- **Overlay Compatible:** Designed to work directly on price charts without obstructing candles or other overlays.
## **HOW TO USE**
Users can interact with the indicator entirely through the settings panel:
- Adjust session timings to match preferred market hours or custom internal zones.
- Enable or disable the display of pivot levels, VWAP, or the ATR/EMA zone.
- Customize colors and line styles to improve visibility according to the chart background or personal preference.
- Observe how price behaves relative to the session box, midpoint, VWAP, and pivot levels for contextual understanding.
- Utilize the smoothed trend condition to see when the indicator chooses to display certain pivot extensions.
These elements help users interpret chart structure, volatility, and intraday behavior in a visually organized manner.
## **CONCLUSION**
The ** Session Dynamics & Pivot Overlay (Arjo) ** indicator offers a consolidated view of session structure, pivot levels, VWAP, and smoothed trend conditions. Its purpose is to improve visual clarity and assist users in understanding market context without issuing directives or trade suggestions. It functions as an educational tool that enhances chart interpretation and supports structured analysis.
---
## **DISCLAIMER**
This indicator is for educational and visual analysis purposes only. It does not provide trading signals, financial advice, or guaranteed outcomes. Users should conduct their own research and consult a licensed financial professional when necessary. All trading decisions are solely the responsibility of the user.
Happy Trading (Arjo)
Penunjuk dan strategi

Daily 9 SMA S/R with Std DevThis indicator plots the Daily 9 Simple Moving Average as dynamic support/resistance on any timeframe, with standard deviation bands to measure trend strength and identify overextended price action.
━━━━━━━━━━━━━━━━━━━━━━
HOW IT WORKS
━━━━━━━━━━━━━━━━━━━━━━
The Daily 9 SMA acts as a key level institutions watch. When price is above it, bullish bias. Below it, bearish bias. Simple.
Standard deviation bands show you:
- 1 StdDev = Strong trend territory
- 2 StdDev = Extreme/overextended - potential reversal zone
━━━━━━━━━━━━━━━━━━━━━━
FEATURES
━━━━━━━━━━━━━━━━━━━━━━
- Daily 9 SMA plotted on any timeframe
- 1 & 2 Standard Deviation bands
- Trend strength scoring (-3 to +3)
- Info table showing current values and trend status
- Visual signals for MA reclaims, losses, and trend entries
━━━━━━━━━━━━━━━━━━━━━━
ALERTS
━━━━━━━━━━━━━━━━━━━━━━
- Price Reclaims Daily 9 SMA
- Price Loses Daily 9 SMA
- Enter Strong Bullish Zone (>1 StdDev)
- Enter Strong Bearish Zone (<1 StdDev)
- Extreme Extension Alerts (2 StdDev)
- Bounce/Rejection at MA
━━━━━━━━━━━━━━━━━━━━━━
HOW TO USE
━━━━━━━━━━━━━━━━━━━━━━
1. Use on lower timeframes (5m, 15m, 1H) to see Daily levels
2. Look for bounces off the Daily 9 SMA for entries
3. Avoid longs when price loses the MA, avoid shorts when price reclaims
4. Use StdDev bands to gauge when price is overextended
━━━━━━━━━━━━━━━━━━━━━━
SETTINGS
━━━━━━━━━━━━━━━━━━━━━━
- MA Length - Default 9
- StdDev Multipliers - Default 1.0 and 2.0
- StdDev Lookback - Default 20
- Customizable colors
Works on any market - Forex, Crypto, Stocks, Futures.

TCT OBIF Detector█ OVERVIEW
The OBIF (Order Block Imbalance Fill) indicator automatically detects and visualizes high-probability trading zones by combining two powerful Smart Money Concepts: Order Blocks and Fair Value Gaps (FVGs).
An OBIF occurs when an Order Block forms immediately before a Fair Value Gap, creating a zone of institutional interest that price often revisits before continuing its move.
█ CONCEPTS
Order Block (OB)
An Order Block is the last opposing candle before a strong directional move. It represents an area where institutional traders likely placed orders.
- Bullish OB: Last bearish candle before an up-move
- Bearish OB: Last bullish candle before a down-move
Fair Value Gap (FVG)
An FVG is a price imbalance created when a candle's body completely gaps past the previous candle's range, leaving an unfilled area.
- Bullish FVG: Gap up where candle .low > candle .high
- Bearish FVG: Gap down where candle .high < candle .low
OBIF Zone
When an Order Block directly precedes an FVG, it creates an OBIF - a confluence zone with higher probability of acting as support/resistance.
█ HOW TO USE
1. Identify the Trend
Use OBIFs in the direction of the higher timeframe trend for best results.
2. Wait for Price to Return
OBIFs act as magnets - price often returns to fill the imbalance and test the order block.
3. Look for Confirmation
When price enters an OBIF zone, look for:
- Rejection wicks
- Engulfing patterns
- Break of structure on lower timeframes
4. Mitigation
Once price fully trades through the OBIF (touches the opposite edge), the zone is considered mitigated and loses its significance.
█ FEATURES
- Automatic Detection — Identifies OBIFs in real-time as they form
- Visual Zones — Clean, non-intrusive boxes that don't obscure price action
- Mitigation Tracking — Zones automatically update when price mitigates them
- Multi-Timeframe Friendly — Works on any timeframe from 1m to Monthly
- Customizable — Adjust colors, opacity, and display preferences
█ SETTINGS
- Lookback Window — How many candles back to search for the Order Block (default: 3)
- Show Bullish/Bearish — Toggle visibility of each type
- Show Mitigated — Display zones that have been mitigated (shown in gray)
- Fill Opacity — Adjust zone transparency (higher = more see-through)
- Border Width — Thickness of zone borders
█ BEST PRACTICES
✓ Use on higher timeframes (1H+) for more reliable zones
✓ Combine with market structure analysis
✓ Look for OBIFs at key support/resistance levels
✓ Use lower timeframe confirmation for entries
✗ Don't trade every OBIF blindly
✗ Avoid OBIFs against the dominant trend
█ CREDITS
The Composite Trader (TCT) methodologies.

Pure xATR ProUncover the hidden rhythm of the market with Pure xATR Pro. This indicator is designed for serious traders who need to understand "Price Extension". It calculates the precise distance between the price and the baseline Moving Average (MA) relative to market volatility (ATR). Instead of guessing top and bottom, visualize exactly where the price stands in the cycle—from extreme panic selling to euphoric profit-taking.
Key Features:
4-Stage Market Zoning System:
Panic Zone (Oversold): Identifies extreme price drops (statistically rare deviations). Often presents high-reward mean reversion opportunities.
Buy Zone (Entry): The sweet spot for trend initiation.
Hold / Winner Zone: Detects strong momentum. Keeps you in the trade while the trend is healthy (Ride the trend).
Profit Taking Zone (Overbought): signals when the price is statistically overextended and liable to pullback.
Adaptive Volatility Logic:
Includes a dynamic algorithm that analyzes historical volatility (Lookback Period) to automatically adjust Overbought/Oversold percentiles, adapting to changing market conditions.
Professional Dashboard:
Real-time Status: Displays current Zone, Volatility State (Breakout/Normal), and Actionable Advice.
Risk Management: Auto-calculates Dynamic Stop Loss (based on Supertrend, ATR, or MA) and Fixed % Risk.
Multi-Level Targets: Automatically projects 3 profit targets (TP) based on ATR multiples.
Clean & Customizable Visuals:
Smart Highlighting: Background colors automatically highlight key zones (Panic/Buy/Hold/Profit).
Style Control: Full color customization available directly in the "Style" tab for a clutter-free input menu.
------------------
ค้นพบจังหวะที่แท้จริงของตลาดด้วย Pure xATR Pro อินดิเคเตอร์ระดับมืออาชีพที่ออกแบบมาเพื่อวิเคราะห์ "ระยะการยืดตัวของราคา" (Price Extension) โดยคำนวณระยะห่างระหว่างราคากับเส้นค่าเฉลี่ย (MA) เทียบกับความผันผวน (ATR) ช่วยให้คุณเห็นภาพชัดเจนว่าราคา ณ ปัจจุบันอยู่ในสถานะใด ตั้งแต่จุดที่คนเทขายด้วยความตกใจ (Panic) ไปจนถึงจุดที่ราคาแพงเกินไปและควรขายทำกำไร
ฟีเจอร์หลัก (Key Features):
ระบบแบ่งโซนตลาด 4 ระดับ (4-Stage Zoning):
Panic Zone (โซนของถูก/Oversold): จับจังหวะที่ราคาดิ่งลงแรงผิดปกติ ซึ่งมักเป็นจุดกลับตัวที่ให้ผลตอบแทนสูง (High Reward)
Buy Zone (โซนสะสม): จุดเริ่มต้นของเทรนด์ เป็นระยะปลอดภัยในการเข้าออเดอร์
Hold / Winner Zone (โซนรันเทรนด์): แยกแยะช่วงที่เทรนด์แข็งแกร่ง ให้คุณ "ถือสถานะต่อ" (Let Profit Run) ไม่ขายหมู
Profit Taking Zone (โซนขายทำกำไร): แจ้งเตือนเมื่อราคาวิ่งไปไกลเกินค่าเฉลี่ยทางสถิติ (Overextended) เพื่อพิจารณาขาย
ระบบปรับตัวตามความผันผวน (Adaptive Logic):
อัลกอริทึมอัจฉริยะที่คำนวณค่า Percentile ย้อนหลัง เพื่อปรับระดับ Overbought/Oversold ให้เหมาะสมกับสภาวะตลาดที่เปลี่ยนไปโดยอัตโนมัติ
หน้าปัดสถานะครบวงจร (Professional Dashboard):
แสดงสถานะปัจจุบัน (Action), ระดับความผันผวน, และคำแนะนำแบบ Real-time
Risk Management: คำนวณจุด Stop Loss ให้อัตโนมัติ (เลือกสูตรได้: Supertrend, ATR, หรือ MA)
Target Projection: คำนวณเป้าหมายทำกำไร (TP) ให้ล่วงหน้า 3 ระดับตามระยะ ATR
กราฟสะอาดตา ปรับแต่งง่าย (Clean Visuals):
Smart Highlight: ไฮไลท์สีพื้นหลังตามโซนต่างๆ อัตโนมัติ (Panic/Buy/Hold/Profit) ทำให้ดูเทรนด์ง่ายเพียงกวาดตา
Customizable: ปรับแต่งสีและความโปร่งใสได้อิสระผ่านแถบ "Style" เพื่อกราฟที่ดูเป็นระเบียบและไม่รกสายตา

Fabio-Style Order Flow SystemFabio-Style Order Flow System — LVN • Delta • Big Trades • FVG • Order Blocks • Liquidity • Volume Profile
This indicator brings together all major components of Fabio Valentino’s order-flow strategy in one unified tool. It visualizes where smart money is active, where inefficiencies form, and where price is likely to react next.
🔍 FEATURES
1. Order Flow & Delta
Smoothed delta to show true market imbalance
Background color shifts to bullish/bearish delta dominance
Alerts for delta spikes & order-flow flips
2. Big Trade Detection
Highlights Big Buy and Big Sell prints (relative to average volume)
Helps identify institutional aggression on both sides
3. Low Volume Nodes (LVNs)
Automatically detects low-volume zones
Flags retests of LVNs for high-probability reactions
Uses dynamic volume thresholds for accuracy
4. Volume Profile (Lightweight)
Bucket-based intrabar profile across user-defined lookback
Highlights volume distribution without heavy TradingView CPU load
Auto-scales bucket density & transparency
5. Fair Value Gaps (FVGs)
Detects both bullish & bearish three-bar imbalances
Marks gaps visually using colored boxes
Updates dynamically with a user-set lookback
6. Order Blocks (OBs)
Identifies valid displacement bars and their origin OB
Plots clean, minimalist rectangles around key OB zones
Uses ATR-based impulse filtering
7. Liquidity Grabs
Detects wick-based liquidity sweeps
Highlights both equal high/low and stop-run type wicks
Useful for spotting reversals & trap setups
8. Strategy Dashboard
Shows real-time order flow state
Displays delta strength, big trades, LVNs, and last directional impulse
Auto-positions in all corners
🎯 PERFECT FOR
Traders who use:
Order Flow
Smart Money Concepts (SMC)
ICT / FVG / Liquidity models
Market Structure + Volume
Fabio Valentino-style analysis
⚙️ PERFORMANCE
All elements optimized
Uses automatic box-clearing to avoid array overload
Works on all timeframes & markets (crypto, FX, indices, stocks)

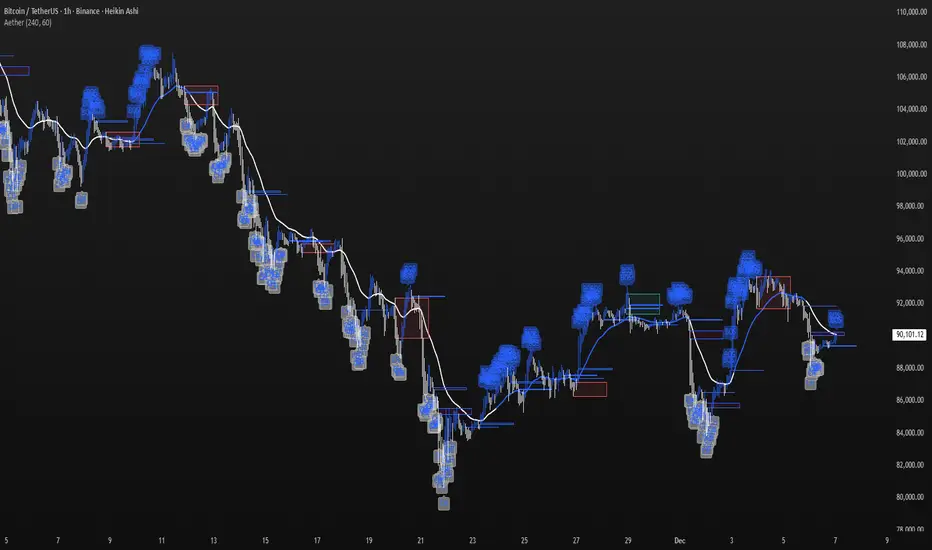
Aether Market MapAether Market Map A multi-component structure-based tool that aids chart analysis by visually displaying various market structure elements.
It combines order blocks, fair value gaps, liquidity segments, trend-shifting signals, and more to help users interpret the pricing structure more clearly.
This script does not provide specific trading strategies or investment advice and is a reference tool for chart analysis.
🔍 Key Features
1. Order Blocks (OB)
Displays the potential inflection sections in box form according to the specified conditions.
This feature helps to visually grasp the price segments that market participants have repeatedly responded to.
2. Fair Value Gaps (FVG)
It detects the area where the imbalance between the candles has occurred and displays it in a box form.
The area represents the section where there has been a fast movement or abnormal flow of prices.
3. Liquidity Levels
Shapes the points where liquidity was gathered through a short-term high-point and low-point pivot structure.
You can see the structural levels at which prices can react repeatedly.
4. BOS / CHOCH (Structural Change Detection)
Label changes in market structure based on recent high/low breakthroughs.
This is not just trend tracking, it helps us to visually grasp the changes in the structure itself.
📈 Analysis of multi-time frame trends
We compute the comprehensive trend state by leveraging the moving average slope of the swing and macro higher order time frames.
These values are reflected in chart background and EMA color changes to intuitively display the overall market mood.
Positive Environment (Regime > 0) → Green Family
Negative Environment (Regime < 0) → Red Series
This is a simple visualization of the flow of the market to the user, not a specific trading direction.
🔧 Signal Engine (Confluence-Based Visual Tool)
The script does not provide a transaction signal and does not induce a particular trading decision.
The Signal feature is a visual notification element that appears on the chart when a number of conditions overlap.
a change in the ratio of trading volume
Structural activities in recent analysis sections
Trending Environment
short-term momentum change
This feature is a reference visual element for interpreting market data from multiple perspectives.
🎛 Setting Items
Show Order Blocks — Visualize Order Blocks
Show Fair Value Gaps — Show FVG Detection
Show Liquidity Levels — Show pivot-based liquidity areas
Show BOS/CHoCH — Show Structural Switching Points
Show Trade Signals — Display visual signal notifications
HTF Settings — Enter parent timeframe analysis values
💡 Precautions for Use
This script is a market structure visualization tool and does not guarantee specific trading strategies, forecasts, or returns.
Components are calculated based on historical data and may not fully reflect real-time market changes.
All features are intended for research and chart analysis assistance purposes.
📌 Official Disclaimer
This script does not provide investment, finance, or trading advice.
All trading judgments made by the user and their consequences are the user's own responsibility.
This tool only provides a reference visualization function to assist with analysis.
CharisGold FX Dashboard v2.8 (Signals + Alerts)this strategy is a trend line follower using EMA LOW (2 3 6 9) for scalping EMA LOW(25 34 89 110 355 and 480 )for trend direction

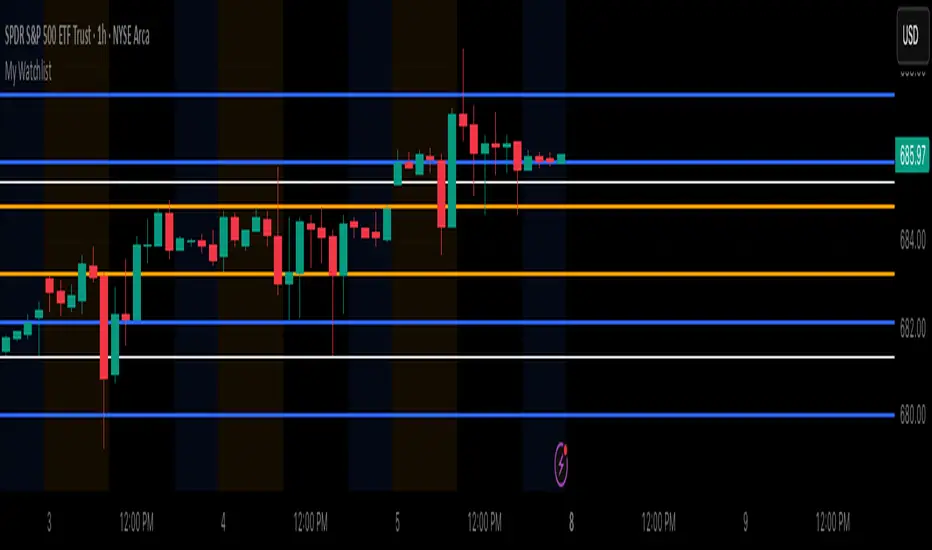
My WatchlistUse Case
Do you belong to a group of traders that post key levels based on their technical analysis to be utilized for trading opportunities? The goal of this indicator is to reduce your daily prep time by allowing you to paste in the actual level values instead of trying to manually create each of the horizontal lines.
How it works
Simply enter the values of the key levels for the tickers that you would like to plot horizontal lines for. If you don't want to plot a level just leave the value as zero and it will be ignored.
Settings
You can enable/disable any of the levels
You can change the colors of the levels
You can add Previous Day High and Previous Day Low levels to the chart
Volatility Radar [upslidedown]💎 Overview
Volatility Radar visualizes extreme volatility conditions in a clean, intuitive oscillator format.
Unlike traditional momentum oscillators, it transforms average true range (ATR) behavior into a directional volatility structure, making it easier to spot moments when markets may be shifting into expansion, compression, or potential pivot zones.
💎 How to Use
The oscillator highlights moments when the internal volatility condition becomes active as well as when that condition breaks. These events may coincide with structural turning points, breakout conditions, or volatility expansions. While not a prediction tool, Volatility Radar helps traders identify moments worth paying closer attention to.
💎 Signal Markers
■ Square icons on top/bottom identify when the Volatility Radar condition is ACTIVE
▲▼ Triangle icons on top/bottom identify when the Volatility Radar condition BREAKS
📌 Chart Example:
💎 Oscillator Trends
One of the core features of Volatility Radar is its ability to highlight positive or negative volatility trends. The oscillator automatically colors its components to reflect uptrending vs. downtrending volatility structure, making trend context easier to interpret at a glance.
📌 Chart Example:
💎 Histogram Trends
For users who prefer a more compact or traditional visual style, Volatility Radar includes an optional histogram display mode. This mode provides a clean representation of the detected trend and can be helpful for validating price-action concepts within the broader volatility context.
📌 Chart Example:
💎 Volatility Moving Average
The yellow moving average line offers a volatility moving average that can aid in determining longer term trend strength.
Interpret the trend direction by observing whether the average is increasing/decreasing or above/below the zero line.
Reversals may be observed when values move into oversold territories.
Trend continuation may occur during periods when the average is near the zero line.
Evaluate opportunities when the moving average is "touched" or "pinged" by the radar line (setting available to highlight these crosses).
📌 Chart Example:
💎 Backtesting Support
Volatility Radar outputs external signals designed for use with automated backtesting on TradingView. It integrates with @jason5480’s open-source Template Trailing Strategy and its supporting signal libraries.

FX OSINT — Institutional Midnight Intelligence For ForexFX OSINT — Institutional Midnight Intelligence For Forex
See Your FX Charts Like an Intelligence Briefing, Not a Guess
If you’ve ever stared at EURUSD or GBPJPY and thought:
Where is the real liquidity?
Is this move sponsored by smart money or just noise?
Am I buying into premium or discount?
…then FX OSINT is designed for you.
FX OSINT (Forex Open Source Intelligence) treats the FX market the way an analyst treats an investigation:
Collect open‑source signals from price, time, and volatility.
Map out liquidity, structure, and sessions in a repeatable way.
Present them in a clean, non‑cluttered dashboard so you can read context quickly.
No rainbow spaghetti. No 12 indicators stacked on top of each other. Just structured information, midnight visuals, and a clear read on what the market is doing right now.
Why FX OSINT Exists
Many FX traders run into the same problems:
Overloaded charts – multiple indicators fighting for space, none talking to each other.
Signals with no context – arrows that ignore structure, sessions, and liquidity.
Tools not tuned for FX – generic indicators that don’t care what pair you are on.
FX OSINT brings this together into one FX‑focused framework that:
Understands structure : BOS/CHOCH, swings, and trend across multiple timeframes.
Respects liquidity : sweeps, order blocks, and FVGs with controlled visibility.
Reads volatility & ADR : how far today’s range has developed.
Knows the clock : London, New York, and key killzones.
Scores confluence : a 0–100 engine that summarizes how much is lining up.
FX OSINT is built for traders who want structured, institutional‑style logic with a disciplined, midnight‑themed UI —not flashing buy/sell buttons.
1. Midnight Dashboard — Top‑Right Intelligence Panel
This panel acts as your compact “situation room”:
CONFLUENCE — 0–100 score blending trend alignment, volatility regime, sessions, liquidity events, order blocks, FVGs, and ADR context.
REGIME — Low / Building / Normal / Expansion / Extreme, driven by ATR relationships, so you know if you’re in chop, trend, or expansion.
HTF / MTF / LTF TREND — Higher‑, medium‑, and current‑timeframe bias in one place, so you see if you are trading with or against the larger flow.
ADR USED — How much of today’s typical range has already been consumed in percentage terms.
PIP VALUE — Approximate pip size per pair, including JPY‑style pairs.
Everything is bold, legible, and color‑coded, but the layout stays minimal so you can:
Look once → understand the context.
2. Structure, BOS, CHOCH — Smart‑Money‑Style Skeleton
FX OSINT tracks swing highs and lows, then shows how structure evolves:
Trend logic based on evolving swings, not just a moving average cross.
BOS (Break of Structure) when price expands in the direction of trend.
CHOCH (Change of Character) when behavior flips and the market structure changes.
Labels are selective, not spammy . You don’t get a tag on every minor wiggle—only when structure meaningfully shifts, so it’s easier to answer:
"Are we continuing the current leg, or did something actually change here?"
3. Liquidity Sweeps, Order Blocks & FVGs — The OSINT Layer
FX OSINT treats liquidity as a key information layer:
Liquidity sweeps — Detects when price spikes through recent highs/lows and then snaps back, flagging potential stop runs.
Order blocks — The last opposite candle before a displacement move, drawn as controlled boxes with limited lifespan to avoid clutter.
Fair Value Gaps (FVGs) — Three‑candle imbalances rendered as precise zones with a cap on how many can exist at once.
Under the hood, boxes are managed so your chart does not become a wall of old zones:
// Draw Order Blocks with overlap prevention
if isBullishOB and showOrderBlocks
if array.size(obBoxes) >= maxBoxes
oldBox = array.shift(obBoxes)
box.delete(oldBox)
newBox = box.new(bar_index , low , bar_index + obvLength, high ,
border_color = bullColor, bgcolor = bullColorTransp,
border_width = 2, extend = extend.none)
array.push(obBoxes, newBox)
Box limits keep the number of zones under control.
Borders and transparency are tuned so you still see price clearly.
You end up with a curated liquidity map , rather than a chart buried under every level price has ever touched.
4. Volatility, ADR & Sessions — Time and Range Intelligence
FX OSINT runs a Volatility Regime Analyzer and an ADR engine in the background:
Volatility regime — Five states (Low → Extreme) derived from fast vs. slow ATR.
ADR bands — Daily high/mid/low projected from the current daily open.
ADR used % — How far today’s move has traveled relative to its typical range.
On the time side:
Asia, London, New York sessions are softly highlighted with a single active background to avoid overlapping colors.
Killzones (e.g., London and New York opens) can be emphasized when you want to focus on where significant moves often begin.
Together, this helps you answer:
"What time is it in the trading day?"
"How stretched are we?"
"Is expansion just starting, or are we late to the move?"
5. ICT‑Style Add‑Ons — BOS/CHOCH, Premium/Discount, and Confluence
For modern FX / ICT‑inspired workflows, FX OSINT includes:
BOS / CHOCH labels — Clear structural shifts based on swings.
Premium / Discount zones — 25%, 50%, 75% levels of the daily range, so you know if you are buying discount in an uptrend or selling premium in a downtrend.
Confluence score — A single number summarizing how many conditions line up in the current context.
Instead of replacing your plan, FX OSINT compresses your checklist into the chart:
Structure
Liquidity
Session / Time
Volatility / ADR
Higher‑timeframe alignment
When these agree, the dashboard reflects it. When they don’t, it stays neutral and lets you see the conflict.
How To Use FX OSINT
FX OSINT is not a signal bot. It is an information engine that organizes context so you can apply your own plan.
A typical workflow might look like:
Start on higher timeframes (e.g., H4/D1) to form directional bias from structure, volatility regime, and ADR context.
Move to intraday timeframes (e.g., M15/H1) around your chosen sessions (London and/or New York).
Look for confluence :
HTF / MTF / LTF trends aligned.
Price in discount for longs or premium for shorts.
Recent liquidity sweep into a meaningful OB or FVG.
Confluence score at or above a level you consider significant.
Then refine entries using BOS/CHOCH on lower timeframes according to your own risk and execution rules.
FX OSINT aims to make sure you do not enter a trade without seeing:
Where you are in the day (ADR and sessions).
Where you are in the volatility cycle (regime).
Who currently appears in control (structure and trend).
Which liquidity was just targeted (sweeps and zones).
Design Choices and Scope
FX OSINT was designed around a few clear constraints:
FX‑focused — Logic and filters tuned for FX majors, minors, exotics, and metals. It is intended for FX markets, not for every possible asset class.
Open‑source — The full Pine Script code is available so you can read it, learn from it, and adapt it to your own workflow if needed.
Clear themes — Two main visual styles (e.g., dark institutional “midnight” and a lighter accent variant) with a focus on readability, not visual noise.
Chart‑friendly — Panels use fixed areas, session highlights avoid overlapping, and boxes are capped/pruned so the chart remains usable.
FX OSINT is for only Forex pairs, not anything else!
Hope you enjoyed and remember your Open Source Intelligence Matters 😉!
-officialjackofalltrades

Daily Low < Threshold AND Close > Threshold//@version=5
indicator("Daily Low < Threshold AND Close > Threshold", overlay=true)
// Get 1-month close (no lookahead)
monthlyClose = request.security(syminfo.tickerid, "1M", close, lookahead=barmerge.lookahead_off)
// Compute adjustment and threshold
adjustment = monthlyClose * 12.15 / (100 * math.sqrt(360.0 / 30.0))
threshold = monthlyClose - adjustment
// Conditions
condLow = low < threshold
condClose = close > threshold
signal = condLow and condClose
// Plots
plot(threshold, title="Threshold", color=color.orange, linewidth=2)
plot(low, title="Daily Low", color=color.red, linewidth=1)
plot(close, title="Daily Close", color=color.green, linewidth=1)
// Signal marker
plotshape(signal,
title="Signal",
location=location.belowbar,
style=shape.labelup,
text="OK",
textcolor=color.white,
size=size.tiny,
color=color.green)

aPraJaiThis indicator Overlays Heikin Ashi Candles over the normal Candlestick pattern for you to be able to view both candle types simultaneously.

Volume Percentile BreakoutCalculates significant volume by selected percentile over three days of your preferred timeframe.

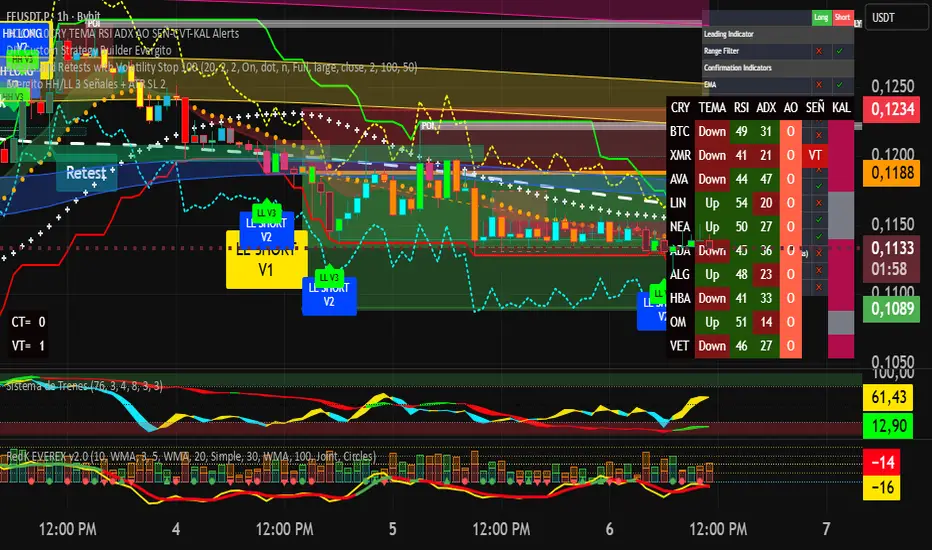
Evergito HH/LL 3 Señales + ATR SL 2How to trade with the Evergito HH/LL 3 Signals + ATR SL indicator? Brief and direct explanation: General system logic: The indicator looks for actual breakouts of the high/low of the last 20 bars (HH/LL) and combines them with the position relative to the 200 SMA to filter the underlying trend. You have 3 types of signals that you can activate/deactivate separately: Signal
When it appears
What it means in practice
Entry type
V1
HH breakout + the close crosses above the 200 SMA (or the opposite in a short position)
Very safe entry confirmed. The price has just validated the long/flat trend → safer and with a better ratio
The most reliable (the original)
V2
HH breakout but the price was already above the 200 SMA (or already below in a short position)
Entry in an already established trend. Fewer “surprises”, more continuity
Ideal for strong trends
V3
Only the breakout of the HH or LL, without looking at the 200 SMA
Aggressive entry/scalping on explosive breakouts. More signals, more noise.
For times of high volatility.
How to enter the market (simple rule): Wait for any of the 3 labels (V1, V2, or V3) to appear, depending on which ones you have activated.
Enter at the close of that candle (or at the open of the next one if you are conservative).
Automatic Stop Loss → the blue (long) or yellow (short) line that represents the ATR x2.
Take Profit → you decide, but the indicator already gives you the visual reference for the risk (ATR x2), so 1:2 or 1:3 is usually very convenient.
Practical example: You see a large green label “HH LONG V1” → you go long at the close of that candle. Stop right at the blue line (ATR x2 below the price).
Typical target: 2x or 3x the risk (very common to reach it in a trend).
Recommended use: Most traders leave only V1 activated → fewer signals but very high quality.
Those who trade intraday or crypto usually combine V1 + V2.
V3 only for news events or very volatile openings.
In summary:
Label = immediate entry
Blue/yellow line = automatic stop
And enjoy the move.
Trend Tracer [AlgoAlpha]🟠 OVERVIEW
This tool builds a two-stage trend model that reacts to structure shifts while also showing how strong or weak the move is. It uses a mid-price band (from the highest high and lowest low over a lookback) and applies two Supertrend passes on top of it. The first pass smoothens the basis. The second pass refines that direction and produces the final trail used for signals. A gradient fill between the two trails uses RSI of price-to-trail distance to show when price is stretched or cooling off. The aim is to give traders a simple way to read trend alignment, pressure, and early turns without guessing.
🟠 CONCEPTS
The script starts with a mid-range basis. This is the average of the rolling highest high and lowest low. It acts as a stable structure reference instead of raw close or typical price. From there, two Supertrend layers are applied:
• The first Supertrend uses a shorter ATR period and lower factor. It reacts faster and sets the main regime.
• The second Supertrend uses a slightly longer ATR and higher factor. It filters noise, waits for confirmed continuation, and generates the signal line.
The interaction between these trails matters. The outer Supertrend provides context by defining the broader regime. The inner Supertrend provides timing by flipping earlier and marking possible shifts. The gradient fill uses RSI of (close − supertrend value) to display when price stretches away from the trail. This shows strength, exhaustion, or compression within the trend.
🟠 FEATURES
Bullish and bearish flip markers placed at recent highs/lows
Rejection signals off the trend tracer line
Alerts for bullish and bearish trend changes
🟠 USAGE
Setup : Add the script to your chart. Timeframe is flexible; lower timeframes show more flips while higher ones give cleaner swings. Adjust Length to change how wide the basis range is. Use the two ATR settings and factors to match the volatility of the market you trade.
Read the chart : When the refined trail (stv_) sits above price the regime is bearish; when below, it is bullish. The wide trail (stv) confirms the larger move. Watch the gradient fill: darker colors appear when price is stretched from the trail and lighter colors appear when the move is weakening. Flip markers ▲ or ▼ highlight the first clean shift of the refined trail.
Settings that matter : Increasing the Main Factor slows main-trend flips and filters chop. Increasing the Signal Factor delays the timing trail but reduces noise. Shortening Length makes the basis more reactive. ATR periods change how sensitive each Supertrend pass is to volatility.

OBV + A/D Accumulation Score# OBV + A/D Accumulation Score
This script fuses **On-Balance Volume (OBV)** and **Chaikin Accumulation/Distribution Line** into one perfectly normalized, weighted, smoothed score that reveals **exactly** what smart money is doing on a **daily basis** — even when you're watching lower timeframes.
It only moves when real institutional order flow is present. Zero-line crosses and extreme levels have an uncanny ability to call major turns before price even blinks.
Institutional accumulation/distribution, distilled into one clean line.
### Why This Indicator Is Special
- **Z-Score Normalization** → OBV and A/D are forced onto the exact same scale so neither dominates (most combined indicators fail here)
- **Weighted Composite** → Default 50/50, but you can slide it to favor OBV or A/D depending on the asset (huge edge on crypto vs stocks)
- **Daily Resolution Forced** → Shows true daily smart-money flow no matter what chart you're on (add to 1H/4H for god-tier context)
- **Extreme Thresholds** (±1.2 default) with lime/maroon coloring → When these hit, institutions are going nuclear
- **Optional Histogram Mode** + subtle pane background tint → Instant bias recognition
- **Full Alert Suite** → Zero-cross + Extreme breaches (with current score value in the message)
### How to Trade It (The Signals That Actually Print)
**Primary Signals**
- Green triangle + alert → Accumulation just turned ON (smart money buying pressure now dominant)
- Red triangle + alert → Distribution just turned ON (smart money exiting)
**Nuclear Signals**
- Lime color + "EXTREME ACCUMULATION" alert → Institutions aggressively piling in → one of the strongest buy signals on daily
- Maroon color + "EXTREME DISTRIBUTION" alert → Institutions dumping hard → one of the strongest sell/short signals
**Best Uses**
- Zero-cross up + price above daily EMA-9/21 → Swing long bias god mode
- Divergences on daily (price new high + score lower high = top incoming)
- Extreme accumulation while price is basing → Buy the breakout and thank me later
Works insanely well on BTC/ETH, SPX/QQQ, NVDA, TSLA — anything with real institutional volume.
### Settings Explained
- **Z-Score Lookback** (50): Longer = only major regime changes
- **Signal Smoothing** (10): Lower = more responsive, higher = smoother trend
- **OBV Weight** (0.5): Slide toward 1.0 for pure direction-based strength, toward 0.0 for close-location sensitivity
- **Extreme Threshold**: 1.2 is perfect balance — raise to 1.8+ for only the absolute strongest moves
- **Show as Histogram**: MACD-style bars (great for ranging markets)
- **Background tint**: Subtle green/red — you'll love it or disable it

Evergito HH/LL 3 Señales + ATR SLHow to trade with the Evergito HH/LL 3 Signals + ATR SL indicator? Brief and direct explanation: General system logic: The indicator looks for actual breakouts of the high/low of the last 20 bars (HH/LL) and combines them with the position relative to the 200 SMA to filter the underlying trend. You have 3 types of signals that you can activate/deactivate separately: Signal
When it appears
What it means in practice
Entry type
V1
HH breakout + the close crosses above the 200 SMA (or the opposite in a short position)
Very safe entry confirmed. The price has just validated the long/flat trend → safer and with a better ratio
The most reliable (the original)
V2
HH breakout but the price was already above the 200 SMA (or already below in a short position)
Entry in an already established trend. Fewer “surprises”, more continuity
Ideal for strong trends
V3
Only the breakout of the HH or LL, without looking at the 200 SMA
Aggressive entry/scalping on explosive breakouts. More signals, more noise.
For times of high volatility.
How to enter the market (simple rule): Wait for any of the 3 labels (V1, V2, or V3) to appear, depending on which ones you have activated.
Enter at the close of that candle (or at the open of the next one if you are conservative).
Automatic Stop Loss → the blue (long) or yellow (short) line that represents the ATR x2.
Take Profit → you decide, but the indicator already gives you the visual reference for the risk (ATR x2), so 1:2 or 1:3 is usually very convenient.
Practical example: You see a large green label “HH LONG V1” → you go long at the close of that candle. Stop right at the blue line (ATR x2 below the price).
Typical target: 2x or 3x the risk (very common to reach it in a trend).
Recommended use: Most traders leave only V1 activated → fewer signals but very high quality.
Those who trade intraday or crypto usually combine V1 + V2.
V3 only for news events or very volatile openings.
In summary:
Label = immediate entry
Blue/yellow line = automatic stop
And enjoy the move.

Forex Knack — Premium Smart Money Indicator📈 Forex Knack — Premium Smart Money Indicator
Developed by Vineesh Rohini
Forex Knack is an invite-only, institutional-grade Smart Money Concepts toolkit built for traders who want clarity, precision and high-quality confluence — without leaking the internal logic.
This indicator combines market structure mapping, dynamic trend shifts, valuation zones and multi-layer confirmation into a clean, professional interface suitable for Forex, XAUUSD (Gold), Crypto and major Indices.
★ Core Benefits
- ✅ Cleaner Market Structure: Live BOS / CHoCH mapping for internal + swing structure.
- ✅ Directional Clarity: Proprietary “Shift” model to identify buy/sell phases.
- ✅ Confluence Signals: Combo confirmations when structure + momentum align.
- ✅ Premium / Discount Zones: Automatic institutional zones for better entries.
- ✅ Order Block Visuals: Internal & swing order block identification.
- ✅ Fair Value Gaps (optional): Imbalance highlighting for tactical entries.
- ✅ Momentum Confirmation: Oscillator-based trend confirmation.
- ✅ Strong / Weak Highs & Lows: Quick strength/weakness view for swing decisions.
🚫 What’s NOT included
- No full strategy code or secret formulas are revealed.
- Not a turnkey “auto-trade” bot — it is a professional decision-support tool.
🔒 Invite-only Access
This script is invite-only: the source code is fully protected and hidden.
You may apply for access; approved users can add the indicator to their charts but **will never** see the source code.
📬 How to request access
1. Follow the author profile on TradingView.
2. Send a message with your TradingView username and the note:
“Requesting access to Forex Knack indicator.”
(Access is granted manually after verification.)
⚠ Disclaimer
For educational purposes only. Not financial advice. Use with proper risk management.
© Vineesh Rohini — Forex Knack

Institutional Flow Engine (IFE) v1.7 PROInstitutional Flow Engine (IFE) v1.7 PRO — Description
The Institutional Flow Engine (IFE) is an intraday market-flow framework built around liquidity behavior, session timing and structural shifts. Instead of combining public indicators, IFE uses its own unified engine that monitors:
• Accumulation ranges formed during the early session
• Liquidity events when price reaches key levels and rejects
• Structural shifts based on pivot swings
• Momentum confirmation after structural breaks
• Higher-timeframe inefficiency zones (price speed / imbalance areas)
• Session-specific conditions for Core Session and Expansion Session
The objective is to provide a logical roadmap of how price transitions from accumulation → manipulation → expansion during the trading day.
--------------------------------------------------------------------
1. Session Framework
IFE operates using three phases:
1. Asia Accumulation Phase
- Builds the core accumulation range
- Builds an extended reference range used later by the Expansion Session
2. Pre-Core Phase
- Tracks a local intraday range before the main session
- Detects liquidity taps or sweeps of this range
3. Core Session (London)
- Primary signal window where the engine evaluates directional intent
4. Expansion Session (New York)
- Secondary session logic for continuation or reversal during the afternoon
--------------------------------------------------------------------
2. Liquidity Events and Key Levels
IFE identifies multiple types of liquidity behavior:
• Sweeps of the Asia accumulation range
• Sweeps of the extended reference range
• Sweeps of the pre-session intraday range
• Equal-high and equal-low clusters that attract price and later reject
A liquidity event is confirmed when price trades beyond a key level and then returns back into the range.
Users can decide whether:
• Liquidity events are required for signals
• Only the side where liquidity was taken should be traded
• Both sides can be considered
--------------------------------------------------------------------
3. Structural Shifts and Momentum Confirmation
The engine monitors local structure using pivot-based swing points. A directional shift occurs when price closes beyond a previous swing level.
This shift is validated only if accompanied by a momentum candle (a body significantly larger than recent average).
The user can select aggressive, standard, or defensive confirmation modes.
These momentum-based signals are independent from zone-based signals.
--------------------------------------------------------------------
4. Inefficiency / Imbalance Zones (Higher Timeframe Mapping)
IFE maps areas where price moved too quickly (inefficiency zones) on a higher timeframe.
These zones:
• Are detected using multiple gap-based models
• Have a maximum lifetime
• Are invalidated if price fully trades through
• Are visualized with dynamic boxes extended forward
Optional signal conditions allow:
• Tap + rejection within an active zone
• Session window confirmation
• Liquidity-based directional filters
--------------------------------------------------------------------
5. Equilibrium Filters (Optional)
IFE calculates an equilibrium level for each session based on the midpoint of either:
• The Asia accumulation range, or
• The most recent structural swing range
Users can restrict signals so that:
• Shorts only trigger above equilibrium
• Longs only trigger below equilibrium
This helps avoid entries in the inefficient half of the range.
--------------------------------------------------------------------
6. Signal Types
There are two main signal types inside each session:
1. Zone-Based Signals
- Price interacts with an active inefficiency zone
- Liquidity event is confirmed
- Price rejects the zone
- Session window is active
2. Momentum-Based Signals
- A structural shift is confirmed
- A momentum candle supports the move
- Liquidity/equilibrium conditions are met
- Session window is active
Long and short signals are plotted clearly on the chart with directional labels.
--------------------------------------------------------------------
7. Alerts
IFE includes alerts for:
• Zone-based long/short signals
• Momentum-based long/short signals
• Core Session events
• Expansion Session events
Each alert matches the exact visual signal on chart.
--------------------------------------------------------------------
8. Practical Use
IFE is designed for:
• Major indices (NAS100, ES, DAX)
• FX majors
• High-liquidity crypto pairs
Recommended workflow:
1. Observe how the Asia range forms initial liquidity.
2. Watch for liquidity grabs before the main session.
3. Use inefficiency zones as primary interest areas.
4. Use session timing as the main filter.
5. Apply your own risk management alongside the signals.
IFE is a structural mapping tool intended for experienced traders. It does not constitute financial advice.

Alpha Signal AI ProAlpha Signal AI Pro
Short description:
A smart, ensemble-style indicator that blends trend, momentum, volume, volatility, and candle patterns into a score & star system that produces Buy/Sell signals confirmed by MACD crosses. After a signal, it projects smart targets (TP1/TP2/TP3) and a stop-loss derived from ATR, with forward drawings and a control panel for trade management.
Inputs
Minimum Score (min_score): default 6.0 — higher = fewer but stronger signals.
Minimum Stars (min_stars): default 2 — extra filter for strength.
Future Bars (future_bars): default 15 — how far targets/SL are drawn ahead.
Use AI Targets (use_ai_targets): toggle the AI multiplier for TP/SL.
How it works
Computes buy_score/sell_score from: EMA8/21/50/200, RSI & its MA, MACD & Histogram, Stochastic, ADX/DMI, VWAP, Volume, 15m MTF tilt, ROC/Momentum, Heikin Ashi, and candle patterns (engulfing/hammer/shooting star).
Converts scores into Stars (⭐⭐ to ⭐⭐⭐⭐⭐) via tiered thresholds.
Signals fire only when: Score ≥ minimum + Stars ≥ minimum + MACD cross (up = Buy, down = Sell).
On a signal, one active trade is managed until TP3 or SL is reached.
Targets & Stop (AI-driven)
Targets and SL are ATR-based, then adjusted by an AI multiplier derived from: ATR%, momentum (ROC), relative volume, trend strength (ADX), and star rating.
Approximate formulas:
TP1 ≈ 1.5×ATR × AI
TP2 ≈ 2.5×ATR × AI
TP3 ≈ 4.0×ATR × AI
SL ≈ 1.0×ATR ÷ AI
What you’ll see on chart
“Buy/Sell” markers with small Star labels, an Entry line (blue), SL (red dotted), TP1/TP2 (green), TP3 (gold) with shaded target boxes and a guide line towards the final target.
A central AI badge showing the multiplier % and star rating.
A top-right Panel showing status, strength, AI%, price, scores, and during trades: entry, TP1/TP2/TP3, and live P/L.
Alerts
Two ready-made conditions: Buy and Sell when the respective signal triggers.
Add alert: Right click → Add alert → choose the indicator → select condition.
Best practices
Match timeframe to instrument:
Scalping 5–15m: min_score 8, min_stars 3–4.
Swing H1–H4: min_score 7, min_stars 3.
Daily/Equities: min_score 6–7, min_stars 2–3.
Prefer trades with EMA200 and 15m MTF trend alignment.
De-risk around major news.
Use fixed risk per trade (e.g., 1%).
Important notes
Prefer bar close confirmation to avoid mid-bar MACD flips.
Single trade at a time via the in_trade state.
15m MTF uses request.security with lookahead_off; evaluate at close for consistency.
FAQ
Use it standalone? You can, but it’s stronger when combined with S/R zones/trendlines and solid risk management.
Why do targets vary? The AI multiplier adapts TP/SL to current market conditions.
Disclaimer
This is an analytical/educational tool, not financial advice. Always backtest and use appropriate risk management.
Developer note
Built in Pine Script v6, uses var for trade state, clears drawings on the last bar to keep the chart tidy, and raises drawing limits to avoid runtime errors.
Pious 3/8 EMA High-Low + 89 EMA Strategybuy signal when 3emah cross above 8emah, 3emal cross above 8emal,high cross above previous 3 high with volume and vice versa

4x Stochastic Combo - %K only4x Stochastic Combo in one indicator.
Default parameters: (9, 3, 3), (14, 3, 3), (40, 4, 4), (60, 10, 10)
Only %K is shown.
Possibility to set alerts "all above 80" or "all below 20".
How to use:
Look for divergence after getting an alert for good quality signals. Connect the stochastic signals with multi-timeframe analysis.
