IndiabizlistFX Scalper 1.0the detailed description will be updated soon
basically an indicator with customized settings for reversal trading, i am currently updating it, with the dashboard, it will be updated soon
Penunjuk dan strategi

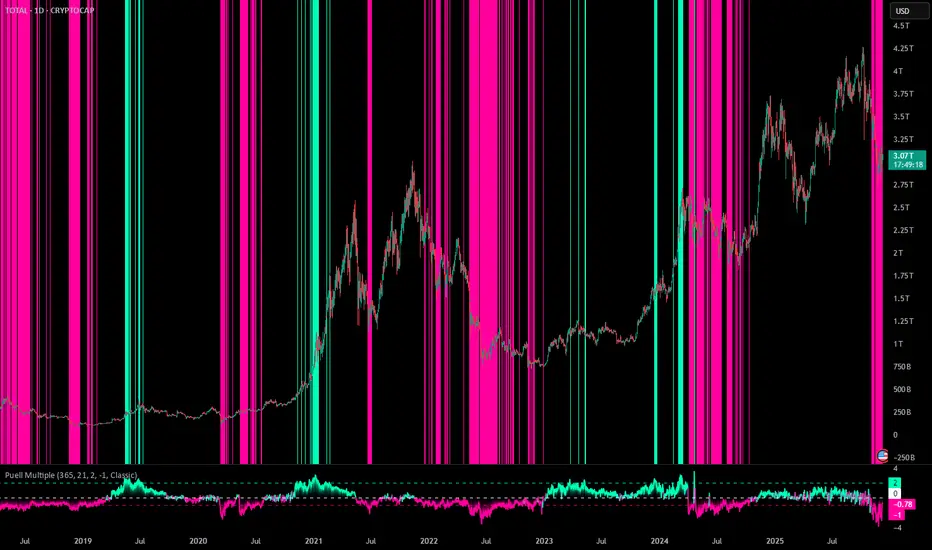
Puell MultiplePuell Multiple
The Puell Multiple is calculated by dividing the total USD value of Bitcoin issued today (newly mined coins × BTC price) by the 365-day moving average of that daily issuance value. It shows how today's miner revenue compares to the past year's average.
Features
This script offers several customizable inputs, enabling traders to tailor the indicator to their preferences. Traders can adjust the thresholds to define the sensitivity of overbought and oversold conditions.
It has 10 available color schemes to choose from and the background coloring on the chart can be toggled on and off.
Practical Applications
This indicator is designed for traders who focus on identifying cycle extremes and potential mean reversion opportunities.
Detecting Overbought and Oversold Conditions: The indicator measures how far the price has deviated from its norm, allowing traders to identify overbought or oversold conditions with precision.
Timing Market Reversals: The indicator provides early signals of potential market reversals by highlighting when the price has moved too far away from its average, helping traders anticipate reversion opportunities.
Trend Finder - Buy/Sell (Anuj Edition)Renko Trend Finder – Anuj Edition is a powerful trend-following tool designed to detect market direction using Renko logic instead of traditional candlesticks.
Renko filtering removes market noise, making trends clearer and reversals easier to identify.
This indicator internally builds Renko-style price movement and generates clean, high-quality Buy and Sell signals without repainting.

NUPLNUPL
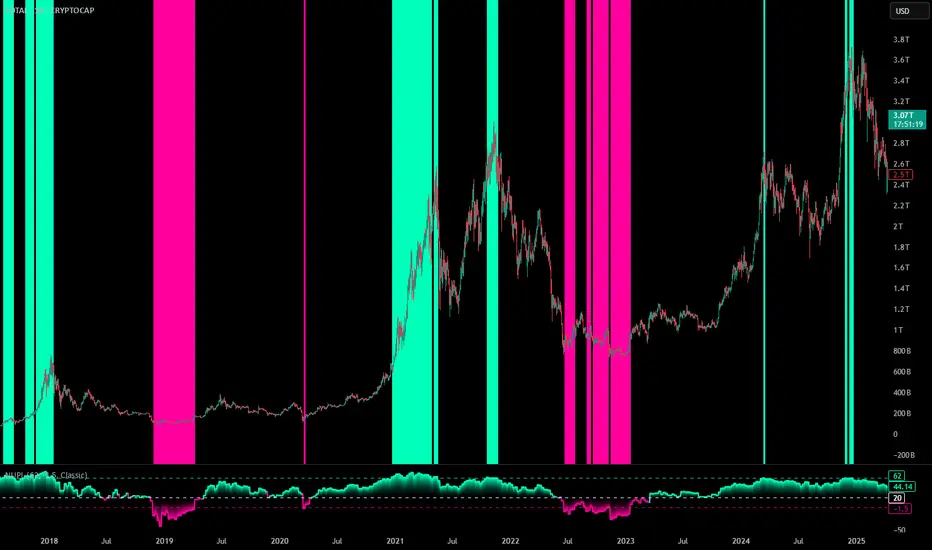
The Net Unrealized Profit and Loss (NUPL) is an advanced on-chain indicator that is measured by subtracting the Realized Value from Market Value. Realized Value takes the price of each Bitcoin when it was last moved. It adds up all individual prices and takes an average. It multiplies that average price by the total number of coins in circulation. Market Value is the current price of Bitcoin multiplied by the number of coins in circulation. This gives us the NUPL which estimates the total paper profits/losses in Bitcoin held by investors.
Features
This script offers several customizable inputs, enabling traders to tailor the indicator to their preferences. Traders can also adjust the thresholds to define the sensitivity of overbought and oversold conditions.
It has 10 available color schemes to choose from and the background coloring on the chart can be toggled on and off.
Practical Applications
This indicator is designed for traders who focus on identifying cycle extremes and potential mean reversion opportunities.
Detecting Overbought and Oversold Conditions: The indicator measures how far the price has deviated from its norm, allowing traders to identify overbought or oversold conditions with precision.
Timing Market Reversals: The indicator provides early signals of potential market reversals by highlighting when the price has moved too far away from its average, helping traders anticipate reversion opportunities.
SOPRSOPR
The Spent Output Profit Ratio (SOPR) is an advanced on-chain indicator that measures the ratio between the combined USD value of all Bitcoin outputs spent on a given day and their combined USD value at the time of creation. SOPR offers a window into aggregate seller behavior, effectively representing the USD amount received by sellers divided by the USD amount they originally paid.
Features
This script offers several customizable inputs, enabling traders to tailor the indicator to their preferences. Traders can adjust the thresholds to define the sensitivity of overbought and oversold conditions.
It has 10 available color schemes to choose from and the background coloring on the chart can be toggled on and off.
Practical Applications
This indicator is designed for traders who focus on identifying cycle extremes and potential mean reversion opportunities.
Detecting Overbought and Oversold Conditions: The indicator measures how far the price has deviated from its norm, allowing traders to identify overbought or oversold conditions with precision.
Timing Market Reversals: The indicator provides early signals of potential market reversals by highlighting when the price has moved too far away from its average, helping traders anticipate reversion opportunities.

Trend Finder - Buy/Sell (Anuj Edition)Renko Trend Finder – Anuj Edition is a powerful trend-following tool designed to detect market direction using Renko logic instead of traditional candlesticks.
Renko filtering removes market noise, making trends clearer and reversals easier to identify.
This indicator internally builds Renko-style price movement and generates clean, high-quality Buy and Sell signals without repainting.

MVRVMVRV
The Market Value to Realized Value (MVRV) is an advanced on-chain indicator designed to assess the ratio between the Market Value and the Realized Value of Bitcoin.
Market Value is calculated as the current price of Bitcoin multiplied by its circulating supply and realized Value is derived by multiplying the realized price of Bitcoin (the price at which the coins last moved) by the circulating supply. It represents the total cost basis of all Bitcoin held.
Features
This script offers several customizable inputs, enabling traders to tailor the indicator to their preferences. Traders can also adjust the thresholds to define the sensitivity of overbought and oversold conditions.
It has 10 available color schemes to choose from and the background coloring on the chart can be toggled on and off.
Practical Applications
This indicator is designed for traders who focus on identifying cycle extremes and potential mean reversion opportunities.
Detecting Overbought and Oversold Conditions: The indicator measures how far the price has deviated from its norm, allowing traders to identify overbought or oversold conditions with precision.
Timing Market Reversals: The indicator provides early signals of potential market reversals by highlighting when the price has moved too far away from its average, helping traders anticipate reversion opportunities.

Brahmastra Basic1. Core Purpose and Strategy
This is a multi-timeframe (MTF) indicator designed to identify high-probability entry points for a specific trend-following options selling strategy. It works by confirming a trend on higher timeframes (Daily and Hourly) before waiting for a precise entry trigger on a lower timeframe (15-Minute).
The core principle is confluence: ensuring that the Daily trend bias and the Hourly trend momentum are aligned before looking for a trade. This filters out many false signals that can occur when trading on a single timeframe.
IMPORTANT: This indicator MUST be applied to a 15-minute chart to function correctly.
2. How to Read the Visual Signals on Your Chart
The indicator provides several visual cues to guide you through the trading setup from start to finish.
A. Candle Colors: The "Setup is Ready" Signal
The primary signal to start paying attention is the change in candle color.
Aqua Candles: The market is in a Bullish Alignment. This means both the Daily and Hourly trends are bullish. You should now be preparing for a Put Sell entry. The very first aqua candle in a sequence is your "alert candle."
Yellow Candles: The market is in a Bearish Alignment. This means both the Daily and Hourly trends are bearish. You should now be preparing for a Call Sell entry. The very first yellow candle in a sequence is your "alert candle."
B. Entry Signals: The "Execute Trade" Signal
These signals appear only after the alert candle's level has been breached.
Green "PUT SELL" Label (below candle): This is your signal to enter a Put Sell (or a long position). It appears on the close of the 15-minute candle that breaks above the high of the first aqua alert candle.
Red "CALL SELL" Label (above candle): This is your signal to enter a Call Sell (or a short position). It appears on the close of the 15-minute candle that breaks below the low of the first yellow alert candle.
C. Exit Signals: The "Close Position" Signal
Red 'X' (above candle): This is the signal to close your Put Sell position. It appears when the primary daily trend has reversed to bearish.
Green 'X' (below candle): This is the signal to close your Call Sell position. It appears when the primary daily trend has reversed to bullish.
D. Background & EMA Lines: The "Context"
EMA Lines: The indicator plots two key EMAs from the higher timeframes onto your 15-minute chart so you can see the context.
Orange Line: Daily 5 EMA
Blue Line: Hourly 51 EMA
Faint Background Color: After an entry signal appears, the background will remain faintly colored (green for a bullish trade, red for a bearish trade) to remind you that you are in a hypothetical position.
3. The Step-by-Step Strategy Logic
Here is the precise set of rules the indicator follows to generate its signals:
For a PUT Sell (Bullish Trade):
Alignment Check: The indicator first confirms that:
The Daily Close is above the Daily 5 EMA.
AND the Hourly Close is above the Hourly 51 EMA.
Alert Phase: As soon as this alignment is true, the 15-minute candles turn aqua. The indicator internally notes the high of the very first aqua candle.
Entry Trigger: The indicator waits for a 15-minute candle to close above the high of that first alert candle. When this happens, the green "PUT SELL" label is plotted.
Exit Condition: The position is held until the Daily Close crosses back below the Daily 5 EMA. When this happens, the red 'X' exit signal is plotted.
For a CALL Sell (Bearish Trade):
Alignment Check: The indicator first confirms that:
The Daily Close is below the Daily 5 EMA.
AND the Hourly Close is below the Hourly 51 EMA.
Alert Phase: As soon as this alignment is true, the 15-minute candles turn yellow. The indicator internally notes the low of the very first yellow candle.
Entry Trigger: The indicator waits for a 15-minute candle to close below the low of that first alert candle. When this happens, the red "CALL SELL" label is plotted.
Exit Condition: The position is held until the Daily Close crosses back above the Daily 5 EMA. When this happens, the green 'X' exit signal is plotted.

MTF Fractal Manifold Support & Resistance Pro [Voidspire]Welcome to MTF Fractal Manifold Support & Resistance Pro. This is not a standard pivot point or zigzag indicator. This tool utilizes Topological Data Analysis (TDA) and Quantitative Physics concepts to treat price action as a high-dimensional manifold.
By applying Lorentzian Kernel Clustering and the Expectation-Maximization (EM) algorithm, the script identifies "High Energy" singularity points where price, time, and volatility (mass) converge. It distinguishes between significant structural levels and random market noise using Shannon Entropy Z-Scores.
🧠 Key Features
⚛️ Physics-Based Clustering: Instead of simple highs/lows, we calculate the "Mass" of a price level based on Tick Volume (Forex) or Real Volume (Equities) and Volatility.
📐 6-Dimensional Analysis: Monitors 6 different timeframes simultaneously (Micro, Meso, and Macro layers) to find Fractal resonance.
📊 Hurst Exponent Integration: Automatically detects whether the market is trending or mean-reverting (ranging) to adjust the search radius (Gamma) of the clusters dynamically.
🧪 Entropy Z-Score: Each level is assigned a Z-Score. Low scores (Green) indicate highly ordered, stable support. High scores (Red) indicate chaotic, unstable zones.
🔥 Topological Confluence Zones: When multiple timeframe levels overlap, they merge into high-probability "Heatmap Boxes," signaling major reversal or breakout zones.
🔥 This indicator does not use future functions and will not be repaint.
⚙️ Comprehensive Settings Guide
This script is highly customizable to fit any asset class (Crypto, Forex, Stocks, Indices).
1. Algorithm Settings (Core)
Asset Class Model:
Forex/Synthetic: Uses Tick Volume + Volatility to calculate Mass.
Equities: Uses Real Volume.
Pure Price: Uses pure geometry (Suitable for assets where accurate trading volume information is not available).
Fractal Gamma Sensitivity: Controls the "focus" of the clustering. Higher values detect finer, more local structures; lower values find broader, major structures.
Entropy Lookback: The historical window used to calculate the Z-Score statistics.
2. Manifold Layer Configuration (Layers 1-6)
You have control over 6 distinct timeframe layers.
Enable/Timeframe: Choose which timeframes to analyze (e.g., 15m, 1H, 4H, Daily).
K-Centers: How many support/resistance clusters to find on this specific timeframe.
Sample Size: How far back in history to analyze data for this layer.
3. Topological Confluence (The Heatmap)
Show High-Energy Confluence: Enables the drawing of rectangular zones where levels overlap.
Merge Threshold %: The distance required to merge two levels into a single zone.
Bullish/Bearish Heatmap: Custom colors for Support (Bullish) and Resistance (Bearish) zones.
4. Dynamic Visibility Control
Hide Micro/Meso Layer: Automatically hides lower timeframe levels when you zoom out to higher timeframes (e.g., hide 15m levels when looking at the Weekly chart) to keep your chart clean.
5. UI & Visual Interaction
Confluence Breakout Threshold: The percentage price must move beyond a zone to confirm a breakout signal.
Zone Transparency: Adjusts the alpha channel of the confluence boxes.
Label Size: Customize the text size of the energy/entropy data labels.
Show Dashboard: Toggles the stats panel.
Show Midline: Toggles the median line inside confluence zones.
6. Layer Coloring & Alerts
Layer Colors: Set unique colors for all 6 layers (Micro, Meso, Macro) to visually decode timeframe hierarchy.
Ghost Extension Transparency: Adjust the visibility of the dotted lines that project the support levels into the future.
Alerts: Configure custom messages for bullish breakouts or bearish breakdowns. Supports variables {ticker} and {price}.
Disclaimer
Trading involves substantial risk and is not suitable for every investor. This indicator is a tool for technical analysis and does not constitute financial advice. Past performance does not guarantee future results. Always use proper risk management.
------------------------------------
中文介绍
机构级市场支撑阻力分析系统
欢迎使用多时间框架高维流形支撑阻力分析系统。这不仅仅是一个普通的枢轴点或 Zigzag 指标。本脚本利用 拓扑数据分析 (TDA) 和 量化物理学 概念,将价格行为视为一个高维流形进行建模。
通过应用 洛伦兹核聚类 (Lorentzian Kernel Clustering) 和 期望最大化 (EM) 算法,该脚本能够识别价格、时间和波动率(质量)汇聚的“高能奇点”。同时,结合 香农熵 Z-Score (Shannon Entropy Z-Scores),它可以有效区分关键的市场结构位和随机的市场噪音。
🧠 核心特性
⚛️ 物理驱动聚类: 我们不单纯依赖高低点,而是根据 Tick 量(外汇)或真实成交量(股票)结合波动率来计算价格水平的“质量 (Mass)”。
📐 6维流形分析: 同时监控 6 个不同的时间周期(微观、中观、宏观层级),寻找分形共振。
📊 赫斯特指数 (Hurst Exponent): 自动检测市场是处于趋势状态还是均值回归(震荡)状态,并据此动态调整聚类算法的搜索半径 (Gamma)。
🧪 熵值 Z-Score: 每个支撑位都有一个 Z分数。低分(绿色)代表高度有序、稳固的支撑;高分(红色)代表混沌、不稳定的区域。
🔥 拓扑共振区: 当多个时间周期的水平位重叠时,它们会合并成高概率的“热力图箱体 (Heatmap Boxes)”,这通常是反转或突破的关键区域。
🔥该指标不使用未来函数,也不会重绘。
⚙️ 全面的参数设置指南
本脚本高度可定制,适用于任何资产类别(加密货币、外汇、股票、指数)。
1. Algorithm Settings (核心算法设置)
Asset Class Model (资产模型):
Forex/Synthetic: 使用 Tick 量 + 波动率计算质量。
Equities: 使用真实成交量。
Pure Price: 纯几何计算(适用于不能获取准确成交量信息的资产)。
Fractal Gamma Sensitivity (分形敏感度): 控制聚类的“焦点”。数值越高,生成的结构越精细;数值越低,寻找的结构越宏观。
Entropy Lookback: 计算熵值 Z-Score 统计数据的历史样本窗口大小。
2. Manifold Layer Configuration (流形层级 1-6)
您可以控制 6 个独立的时间框架层级。
Enable/Timeframe: 选择要分析的时间周期(例如:15分钟、1小时、4小时、日线)。
K-Centers: 在该时间周期上寻找多少个支撑/阻力聚类中心。
Sample Size: 分析该层级多少根历史 K 线的数据。
3. Topological Confluence (拓扑共振/热力图)
Show High-Energy Confluence: 开启后,将重叠的水平位显示为矩形区域。
Merge Threshold %: 将两个临近水平位合并为一个区域的距离阈值。
Bullish/Bearish Heatmap: 自定义支撑区(看涨)和阻力区(看跌)的颜色。
4. Dynamic Visibility Control (动态可视性)
Hide Micro/Meso Layer: 当您切换到大周期图表时,自动隐藏小周期的线条,保持图表整洁。
5. UI & Visual Interaction (UI 与交互)
Confluence Breakout Threshold: 价格必须突破区域宽度的百分之多少才被确认为突破信号。
Zone Transparency: 调整共振区箱体的透明度。
Label Size: 自定义能量/熵值数据标签的字体大小。
Show Dashboard: 显示/隐藏统计面板。
Show Midline: 显示/隐藏共振区内部的中轴线。
6. Layer Coloring & Alerts (着色与警报)
Layer Colors: 为所有 6 个层级设置不同的颜色,以便直观区分微观、中观和宏观结构。
Ghost Extension Transparency: 调整向右延伸的预测虚线的透明度。
Alerts: 配置看涨突破或看跌跌破的自定义警报消息。支持变量 {ticker} 和 {price}。
免责声明
交易涉及巨大风险,并不适合所有投资者。该指标仅供技术分析辅助使用,不构成任何财务建议。过往的表现并不能保证未来的结果。请务必做好风险管理。

n-Day Stock Return with MAs and SlopesThis indicator calculates the n-day percentage return of a stock and visualizes it either as a histogram or line, with optional moving averages (MA1 and MA2) of the return and their slopes. The script highlights trend changes in the slopes of these moving averages by drawing colored horizontal markers at each reversal point—green for upward slope shifts, red for downward shifts, and gray when the slope turns flat—allowing users to quickly identify strengthening, weakening, or neutral return trends over time. It also includes optional slope plots for additional trend context and a zero reference line for distinguishing positive and negative performance.

Paradox CyclesParadox Cycles is a comprehensive market timing indicator that helps traders visualize key trading time-cycles throughout the trading day. Designed for intraday trading on timeframe 15 minutes and below.

Sunit's ID / NR4 / NR7 / IDNR4 / IDNR7 + LVQ/LVY/LVEThis indicator identifies some of the most powerful price compression patterns used in short-term and swing trading, including:
Inside Day (ID)
NR4 (Narrowest Range in 4 Bars)
NR7 (Narrowest Range in 7 Bars)
IDNR4 (Inside Day + NR4)
IDNR7 (Inside Day + NR7)
Along with volume-based exhaustion signals:
LVQ — Lowest Volume in Quarter
LVY — Lowest Volume in Year
LVE — Lowest Volume Ever (dataset minimum)
These patterns originate from volatility breakout logic used by Toby Crabel, quantitative traders, prop firms, and systematic momentum strategies.
🎯 Why These Patterns Matter
Markets move in a cycle:
Volatility contraction → Volatility expansion → Trend continuation or reversal.
NR4, NR7, and Inside Days highlight tight consolidation, where market participants become indecisive.
Low-volume conditions (LVQ/LVY/LVE) often signal complete disinterest — usually right before volatility expansion.
When price compression AND volume contraction occur together, it often precedes:
✔ Breakouts
✔ Trend continuation
✔ Momentum bursts
✔ Opening Range Breakouts (ORB)
✔ Swing explosive moves
This script highlights those conditions visually and generates optional alerts.
🧠 Trade Application Ideas
This is NOT a buy/sell indicator — it's a setup detector.
Common use cases:
Day trading / Opening Range Breakouts (ORB)
Swing trading volatility expansion
Scanning for breakout candidates
Filtering for best risk-reward environments
Momentum burst and continuation setups
Mean reversion failure traps (failed breakouts)
Best timeframes: Daily, 4H, 1H
(Though intraday scalpers may also use it.)
🛠 Features Included
✔ Highlights ID, NR4, NR7, IDNR4, IDNR7 patterns
✔ Separate color coding for each pattern
✔ Labels plotted on chart
✔ Volume exhaustion tags (LVQ, LVY, LVE)
✔ Compression combo detection (price + volume)
✔ Fully configurable options
✔ Works on stocks, futures, crypto, forex
✔ Built in TradingView Alerts for every pattern
Ideal for scans, dashboards, and watchlist building.
🧭 Best Practice Workflow
Night Before / After Market Close:
Scan for IDNR7, IDNR4, NR7, NR4
Add any with LVQ / LVY / LVE to watchlist
The next day: wait for breakout levels or ORB structure
Next Day Execution Examples:
ORB breakout above Inside Day/NR high
Break of previous high/low with volume
Trend continuation in direction aligned with broader structure
⚠️ Notes / Disclaimer
This tool does not generate direct buy/sell signals.
It is a market structure scanner for discretionary or systematic setups.
Always combine with context: trend, liquidity, ATR, session behavior.

Squeeze Fire Arrows (on Price)This script plots when the squeeze fires. It was built by modifying using the Lazybear Squeeze Momentum code

ZENADX Flow DI+ DI-ZENADX Flow Di+ Di- — Modified ADX/DI Trend Structure
This indicator is a refined and brand-aligned enhancement of the classic ADX, +DI, and –DI system, inspired by the original open-source work of Gustavo Cardelle (Gu5).
The ZENADX Flow version focuses on clear trend interpretation, minimal visual noise, and stable performance for discretionary and algorithmic traders.
🔍 What This Indicator Does
ADX Line (White Base Tone)
Shows overall trend strength. Rising ADX = strengthening trend.
Color-Coded ADX Flow
Green shades → Bullish directional strength
Red shades → Bearish directional strength
White → Low ADX / ranging market
+DI and –DI Structure
Helps identify which side (buyers or sellers) currently controls momentum.
DI Cross (Yellow Signal Marker)
Highlights potential trend-shift zones where +DI and –DI intersect.
Trend Markers Above the Indicator
Bullish Trend
Bearish Trend
Strong Bullish
Strong Bearish
End Trend (trend exhaustion)
✨ Improvements in the ZENADX Flow Edition
New optimized defaults: DI Length = 8, Range Level = 25, Trend Level = 25
Cleaned color logic for clarity and emotional neutrality
Removed bar-coloring to keep price action clean
Alerts remain always available (no toggle required)
Fully rewritten into safe, stable Pine formatting to avoid syntax issues
📌 Recommended For
Trend-followers
Momentum traders
Algo developers using DI/ADX states
Reversal detection (via DI Cross)
🧭 ZENADX Flow Research
Developed and refined under the ZENADX Flow Research methodology, focusing on:
Simplicity
Psychological clarity
Consistency
Actionable trend structure
📝 License
This work extends the original script by Gustavo Cardelle (Gu5) and follows the same license:
Attribution–NonCommercial 4.0 International (CC BY-NC 4.0)
-------------------------------------------------------------------
ZENADX Flow Di+ Di- — ระบบวิเคราะห์เทรนด์ ADX/DI เวอร์ชันปรับปรุง
อินดิเคเตอร์ตัวนี้เป็นการพัฒนาและปรับปรุงจากโครงสร้างดั้งเดิมของ ADX / +DI / –DI โดยอ้างอิงจากงานต้นฉบับของ Gustavo Cardelle (Gu5)
เวอร์ชัน ZENADX Flow ถูกออกแบบให้ อ่านง่าย ชัดเจน และรองรับการใช้งานทั้งเทรดมืออาชีพและระบบอัตโนมัติ
🔍 สิ่งที่อินดิเคเตอร์นี้ช่วยให้เห็น
ADX สีขาวเป็นฐาน
แสดง “ความแข็งแรงของเทรนด์” (ไม่ใช่ทิศทาง)
โทนสีบอกพลังเทรนด์
เขียวเข้ม/อ่อน → เทรนด์ขาขึ้นกำลังแข็งแรง/อ่อน
แดงเข้ม/อ่อน → เทรนด์ขาลงกำลังแข็งแรง/อ่อน
ขาว → ช่วงตลาด Sideway / เทรนด์อ่อน
+DI / –DI
ช่วยบอกว่าซื้อหรือขายกำลังคุมตลาดอยู่
DI Cross (จุดสีเหลือง)
เป็นสัญญาณเปลี่ยนโมเมนตัมที่สำคัญ
สัญลักษณ์เหนืออินดิเคเตอร์
Bullish Trend
Bearish Trend
Strong Bullish
Strong Bearish
End Trend (จบเทรนด์)
✨ สิ่งที่ปรับปรุงในเวอร์ชัน ZENADX Flow
ค่าเริ่มต้นใหม่ที่เหมาะกับ Flow Trading: DI = 8, Range = 25, Trend = 25
ลบ bar-coloring เพื่อให้กราฟสะอาด
ระบบสีอ่านง่าย ไม่ปนกัน
Alerts ทำงานพร้อมใช้ทันที
จัด Code Format แบบ “Safe Format” เพื่อป้องกัน error ขณะแก้ไข
🧭 พัฒนาโดย ZENADX Flow Research
ยึดหลักสำคัญของ ZENADX คือ
ความเรียบง่าย
ความชัดเจนทางจิตวิทยา
ความสม่ำเสมอ
มุ่งเน้นเทรนด์ที่ “ไหล” ตามโครงสร้างตลาดจริง
📝 License
สคริปต์นี้พัฒนาต่อยอดจากอินดิเคเตอร์ต้นฉบับของ Gustavo Cardelle (Gu5)
และยังใช้สัญญาอนุญาตเดียวกัน:
Attribution–NonCommercial 4.0 International (CC BY-NC 4.0)

FAD Dashboard (Future vs Spot)Inspired by Wealthcon
This dashboard shows Real Time sentiment of Future Asset Difference with Future price of 3 Main Index & 10 Most significant Nifty 50 stocks . But the list is user customisable.
Fut Up + FAD Up (Deep Green)
Fut Down + FAD Up (Deep Blue)
Fut Up + FAD Down (Yellow)
Fut Down + FAD Down (Red)
Only for Educational purpose.

MR GenericA clean Z-score oscillator that measures how far price has stretched from its rolling regression mean.
Green zones is oversold, red zones is overbought. Small circles flag normal reversals; tiny diamonds mark rare extreme levels (±2.8σ+). Works on any asset, any timeframe.

EMA 21/55/100/200EMA 21/55/100/200 – All-in-one Trend & Swing Trading Toolkit
A clean and practical four-EMA system designed for trend trading, swing trading, and short-to-mid-term market structure analysis.
This indicator includes full visualization and customization options:
1️⃣ Four EMAs with full control (21/55/100/200)
Enable or disable each EMA individually.
All periods, colors, and line widths are fully adjustable for different trading systems.
2️⃣ Strong Trend Background Highlight
When the EMAs form a classic perfect bullish or perfect bearish alignment,
the indicator automatically highlights the chart background to show strong trend conditions.
3️⃣ EMA Cross Signals
Visual markers for key EMA crossovers such as:
• 21 ↗ 55
• 55 ↗ 100
These help identify momentum shifts, trend acceleration, or potential reversals.
4️⃣ EMA Touch Alerts
Alerts trigger whenever price touches any EMA, useful for:
• Trend pullback entries
• Monitoring short-term trend changes
• Validating support and resistance levels
⸻
EMA 21/55/100/200 四合一指标,适用于 EMA 的趋势交易、波段交易与中短线判断。
本指标包含完整的可视化选项:
1️⃣ EMA 21/55/100/200 四线自由开关
可调整周期、颜色、粗细,适配趋势或波段系统。
2️⃣ 多头/空头强势排列背景提示
当 EMA 呈现经典“完美多头 / 空头排列”时,会自动通过背景着色提示市场结构进入强趋势。
3️⃣ EMA 交叉信号提示
支持 21↗55、55↗100 等关键均线交叉标记,便于观察趋势加速或反转。
4️⃣ EMA 触及警报提醒
当价格触及任意 EMA 时,可触发警报,用于:
• 趋势回调买点
• 关注短期趋势变化
• 观察支撑/压力有效性

TomTrades Candle Behavior & Timing + TP + Alertsgreen mean sell red mean buy if prices breaks above green its a buy same for red if price stay below red its a sell white line is hourly trend line

Gold Seasonal Long-Term StrategyBased on the rigid cycle of physical gold demand.
It capitalizes on the strong buying momentum driven by India's Diwali in November, the Western holiday season in December, and the Chinese New Year in January/February to execute a long-term hold.

EMA Market Structure [BOSWaves]// This Pine Script™ code is subject to the terms of the Mozilla Public License 2.0 at mozilla.org
// Join our channel for more free tools: t.me
// This Pine Script® code is subject to the terms of the Mozilla Public License 2.0 at mozilla.org
// © BOSWaves
//@version=6
indicator("EMA Market Structure ", overlay=true, max_lines_count=500, max_labels_count=500, max_boxes_count=500)
// ============================================================================
// Inputs
// ============================================================================
// Ema settings
emaLength = input.int(50, "EMA Length", minval=1, tooltip="Period for the Exponential Moving Average calculation")
emaSource = input.source(close, "EMA Source", tooltip="Price source for EMA calculation (close, open, high, low, etc.)")
colorSmooth = input.int(3, "Color Smoothing", minval=1, group="EMA Style", tooltip="Smoothing period for the EMA color gradient transition")
showEmaGlow = input.bool(true, "EMA Glow Effect", group="EMA Style", tooltip="Display glowing halo effect around the EMA line for enhanced visibility")
// Structure settings
swingLength = input.int(5, "Swing Detection Length", minval=2, group="Structure", tooltip="Number of bars to the left and right to identify swing highs and lows")
swingCooloff = input.int(10, "Swing Marker Cooloff (Bars)", minval=1, group="Structure", tooltip="Minimum number of bars between consecutive swing point markers to reduce visual clutter")
showSwingLines = input.bool(true, "Show Structure Lines", group="Structure", tooltip="Display lines connecting swing highs and swing lows")
showSwingZones = input.bool(true, "Show Structure Zones", group="Structure", tooltip="Display shaded zones between consecutive swing points")
showBOS = input.bool(true, "Show Break of Structure", group="Structure", tooltip="Display BOS labels and stop loss levels when price breaks structure")
bosCooloff = input.int(15, "BOS Cooloff (Bars)", minval=5, maxval=50, group="Structure", tooltip="Minimum number of bars required between consecutive BOS signals to avoid signal spam")
slExtension = input.int(20, "SL Line Extension (Bars)", minval=5, maxval=100, group="Structure", tooltip="Number of bars to extend the stop loss line into the future for visibility")
slBuffer = input.float(0.1, "SL Buffer %", minval=0, maxval=2, step=0.05, group="Structure", tooltip="Additional buffer percentage to add to stop loss level for safety margin")
// Background settings
showBG = input.bool(true, "Show Trend Background", group="EMA Style", tooltip="Display background color based on EMA trend direction")
bgBullColor = input.color(color.new(#00ff88, 96), "Bullish BG", group="EMA Style", tooltip="Background color when EMA is in bullish trend")
bgBearColor = input.color(color.new(#ff3366, 96), "Bearish BG", group="EMA Style", tooltip="Background color when EMA is in bearish trend")
// ============================================================================
// Ema trend filter with gradient color
// ============================================================================
ema = ta.ema(emaSource, emaLength)
// Calculate EMA acceleration for gradient color
emaChange = ema - ema
emaAccel = ta.ema(emaChange, colorSmooth)
// Manual tanh function for normalization
tanh(x) =>
ex = math.exp(2 * x)
(ex - 1) / (ex + 1)
accelNorm = tanh(emaAccel / (ta.atr(14) * 0.01))
// Map normalized accel to hue (60 = green, 120 = yellow/red)
hueRaw = 60 + accelNorm * 60
hue = na(hueRaw ) ? hueRaw : (hueRaw + hueRaw ) / 2
sat = 1.0
val = 1.0
// HSV to RGB conversion
hsv_to_rgb(h, s, v) =>
c = v * s
x = c * (1 - math.abs((h / 60) % 2 - 1))
m = v - c
r = 0.0
g = 0.0
b = 0.0
if (h < 60)
r := c
g := x
b := 0
else if (h < 120)
r := x
g := c
b := 0
else if (h < 180)
r := 0
g := c
b := x
else if (h < 240)
r := 0
g := x
b := c
else if (h < 300)
r := x
g := 0
b := c
else
r := c
g := 0
b := x
color.rgb(int((r + m) * 255), int((g + m) * 255), int((b + m) * 255))
emaColor = hsv_to_rgb(hue, sat, val)
emaTrend = ema > ema ? 1 : ema < ema ? -1 : 0
// EMA with enhanced glow effect using fills
glowOffset = ta.atr(14) * 0.25
emaGlow8 = plot(showEmaGlow ? ema + glowOffset * 8 : na, "EMA Glow 8", color.new(emaColor, 100), 1, display=display.none)
emaGlow7 = plot(showEmaGlow ? ema + glowOffset * 7 : na, "EMA Glow 7", color.new(emaColor, 100), 1, display=display.none)
emaGlow6 = plot(showEmaGlow ? ema + glowOffset * 6 : na, "EMA Glow 6", color.new(emaColor, 100), 1, display=display.none)
emaGlow5 = plot(showEmaGlow ? ema + glowOffset * 5 : na, "EMA Glow 5", color.new(emaColor, 100), 1, display=display.none)
emaGlow4 = plot(showEmaGlow ? ema + glowOffset * 4 : na, "EMA Glow 4", color.new(emaColor, 100), 1, display=display.none)
emaGlow3 = plot(showEmaGlow ? ema + glowOffset * 3 : na, "EMA Glow 3", color.new(emaColor, 100), 1, display=display.none)
emaGlow2 = plot(showEmaGlow ? ema + glowOffset * 2 : na, "EMA Glow 2", color.new(emaColor, 100), 1, display=display.none)
emaGlow1 = plot(showEmaGlow ? ema + glowOffset * 1 : na, "EMA Glow 1", color.new(emaColor, 100), 1, display=display.none)
emaCore = plot(ema, "EMA Core", emaColor, 3)
emaGlow1b = plot(showEmaGlow ? ema - glowOffset * 1 : na, "EMA Glow 1b", color.new(emaColor, 100), 1, display=display.none)
emaGlow2b = plot(showEmaGlow ? ema - glowOffset * 2 : na, "EMA Glow 2b", color.new(emaColor, 100), 1, display=display.none)
emaGlow3b = plot(showEmaGlow ? ema - glowOffset * 3 : na, "EMA Glow 3b", color.new(emaColor, 100), 1, display=display.none)
emaGlow4b = plot(showEmaGlow ? ema - glowOffset * 4 : na, "EMA Glow 4b", color.new(emaColor, 100), 1, display=display.none)
emaGlow5b = plot(showEmaGlow ? ema - glowOffset * 5 : na, "EMA Glow 5b", color.new(emaColor, 100), 1, display=display.none)
emaGlow6b = plot(showEmaGlow ? ema - glowOffset * 6 : na, "EMA Glow 6b", color.new(emaColor, 100), 1, display=display.none)
emaGlow7b = plot(showEmaGlow ? ema - glowOffset * 7 : na, "EMA Glow 7b", color.new(emaColor, 100), 1, display=display.none)
emaGlow8b = plot(showEmaGlow ? ema - glowOffset * 8 : na, "EMA Glow 8b", color.new(emaColor, 100), 1, display=display.none)
// Create glow layers with fills (from outermost to innermost)
fill(emaGlow8, emaGlow7, showEmaGlow ? color.new(emaColor, 97) : na)
fill(emaGlow7, emaGlow6, showEmaGlow ? color.new(emaColor, 95) : na)
fill(emaGlow6, emaGlow5, showEmaGlow ? color.new(emaColor, 93) : na)
fill(emaGlow5, emaGlow4, showEmaGlow ? color.new(emaColor, 90) : na)
fill(emaGlow4, emaGlow3, showEmaGlow ? color.new(emaColor, 87) : na)
fill(emaGlow3, emaGlow2, showEmaGlow ? color.new(emaColor, 83) : na)
fill(emaGlow2, emaGlow1, showEmaGlow ? color.new(emaColor, 78) : na)
fill(emaGlow1, emaCore, showEmaGlow ? color.new(emaColor, 70) : na)
fill(emaCore, emaGlow1b, showEmaGlow ? color.new(emaColor, 70) : na)
fill(emaGlow1b, emaGlow2b, showEmaGlow ? color.new(emaColor, 78) : na)
fill(emaGlow2b, emaGlow3b, showEmaGlow ? color.new(emaColor, 83) : na)
fill(emaGlow3b, emaGlow4b, showEmaGlow ? color.new(emaColor, 87) : na)
fill(emaGlow4b, emaGlow5b, showEmaGlow ? color.new(emaColor, 90) : na)
fill(emaGlow5b, emaGlow6b, showEmaGlow ? color.new(emaColor, 93) : na)
fill(emaGlow6b, emaGlow7b, showEmaGlow ? color.new(emaColor, 95) : na)
fill(emaGlow7b, emaGlow8b, showEmaGlow ? color.new(emaColor, 97) : na)
// ============================================================================
// Swing high/low detection
// ============================================================================
// Swing High/Low Detection
swingHigh = ta.pivothigh(high, swingLength, swingLength)
swingLow = ta.pivotlow(low, swingLength, swingLength)
// Cooloff tracking
var int lastSwingHighPlot = na
var int lastSwingLowPlot = na
// Check if cooloff period has passed
canPlotHigh = na(lastSwingHighPlot) or (bar_index - lastSwingHighPlot) >= swingCooloff
canPlotLow = na(lastSwingLowPlot) or (bar_index - lastSwingLowPlot) >= swingCooloff
// Store swing points
var float lastSwingHigh = na
var int lastSwingHighBar = na
var float lastSwingLow = na
var int lastSwingLowBar = na
// Track previous swing for BOS detection
var float prevSwingHigh = na
var float prevSwingLow = na
// Update swing highs with cooloff
if not na(swingHigh) and canPlotHigh
prevSwingHigh := lastSwingHigh
lastSwingHigh := swingHigh
lastSwingHighBar := bar_index - swingLength
lastSwingHighPlot := bar_index
// Update swing lows with cooloff
if not na(swingLow) and canPlotLow
prevSwingLow := lastSwingLow
lastSwingLow := swingLow
lastSwingLowBar := bar_index - swingLength
lastSwingLowPlot := bar_index
// ============================================================================
// Structure lines & zones
// ============================================================================
var line swingHighLine = na
var line swingLowLine = na
var box swingHighZone = na
var box swingLowZone = na
if showSwingLines
// Draw line connecting swing highs with zones
if not na(swingHigh) and canPlotHigh and not na(prevSwingHigh)
if not na(lastSwingHighBar)
line.delete(swingHighLine)
swingHighLine := line.new(lastSwingHighBar, lastSwingHigh, bar_index - swingLength, swingHigh, color=color.new(#ff3366, 0), width=2, style=line.style_solid)
// Create resistance zone
if showSwingZones
box.delete(swingHighZone)
zoneTop = math.max(lastSwingHigh, swingHigh)
zoneBottom = math.min(lastSwingHigh, swingHigh)
swingHighZone := box.new(lastSwingHighBar, zoneTop, bar_index - swingLength, zoneBottom, border_color=color.new(#ff3366, 80), bgcolor=color.new(#ff3366, 92))
// Draw line connecting swing lows with zones
if not na(swingLow) and canPlotLow and not na(prevSwingLow)
if not na(lastSwingLowBar)
line.delete(swingLowLine)
swingLowLine := line.new(lastSwingLowBar, lastSwingLow, bar_index - swingLength, swingLow, color=color.new(#00ff88, 0), width=2, style=line.style_solid)
// Create support zone
if showSwingZones
box.delete(swingLowZone)
zoneTop = math.max(lastSwingLow, swingLow)
zoneBottom = math.min(lastSwingLow, swingLow)
swingLowZone := box.new(lastSwingLowBar, zoneTop, bar_index - swingLength, zoneBottom, border_color=color.new(#00ff88, 80), bgcolor=color.new(#00ff88, 92))
// ============================================================================
// Break of structure (bos)
// ============================================================================
// Track last BOS bar for cooloff
var int lastBullishBOS = na
var int lastBearishBOS = na
// Check if cooloff period has passed
canPlotBullishBOS = na(lastBullishBOS) or (bar_index - lastBullishBOS) >= bosCooloff
canPlotBearishBOS = na(lastBearishBOS) or (bar_index - lastBearishBOS) >= bosCooloff
// Bullish BOS: Price breaks above previous swing high while EMA is bullish
bullishBOS = showBOS and canPlotBullishBOS and emaTrend == 1 and not na(prevSwingHigh) and close > prevSwingHigh and close <= prevSwingHigh
// Bearish BOS: Price breaks below previous swing low while EMA is bearish
bearishBOS = showBOS and canPlotBearishBOS and emaTrend == -1 and not na(prevSwingLow) and close < prevSwingLow and close >= prevSwingLow
// Update last BOS bars
if bullishBOS
lastBullishBOS := bar_index
if bearishBOS
lastBearishBOS := bar_index
// Plot BOS with enhanced visuals and SL at the candle wick
if bullishBOS
// Calculate SL at the low of the current candle (bottom of wick) with buffer
slLevel = low * (1 - slBuffer/100)
// BOS Label with shadow effect
label.new(bar_index, low, "BOS", style=label.style_label_up, color=color.new(#00ff88, 0), textcolor=color.black, size=size.normal, tooltip="Bullish Break of Structure SL: " + str.tostring(slLevel))
// Main SL line at candle low
line.new(bar_index, slLevel, bar_index + slExtension, slLevel, color=color.new(#00ff88, 0), width=2, style=line.style_dashed, extend=extend.none)
// SL zone box for visual emphasis
box.new(bar_index, slLevel + (slLevel * 0.002), bar_index + slExtension, slLevel - (slLevel * 0.002), border_color=color.new(#00ff88, 60), bgcolor=color.new(#00ff88, 85))
// S/R label
label.new(bar_index + slExtension, slLevel, "S/R", style=label.style_label_left, color=color.new(#00ff88, 0), textcolor=color.black, size=size.tiny)
if bearishBOS
// Calculate SL at the high of the current candle (top of wick) with buffer
slLevel = high * (1 + slBuffer/100)
// BOS Label with shadow effect
label.new(bar_index, high, "BOS", style=label.style_label_down, color=color.new(#ff3366, 0), textcolor=color.white, size=size.normal, tooltip="Bearish Break of Structure SL: " + str.tostring(slLevel))
// Main SL line at candle high
line.new(bar_index, slLevel, bar_index + slExtension, slLevel, color=color.new(#ff3366, 0), width=2, style=line.style_dashed, extend=extend.none)
// SL zone box for visual emphasis
box.new(bar_index, slLevel + (slLevel * 0.002), bar_index + slExtension, slLevel - (slLevel * 0.002), border_color=color.new(#ff3366, 60), bgcolor=color.new(#ff3366, 85))
// S/R label
label.new(bar_index + slExtension, slLevel, "S/R", style=label.style_label_left, color=color.new(#ff3366, 0), textcolor=color.white, size=size.tiny)
// ============================================================================
// Dynamic background zones
// ============================================================================
bgcolor(showBG and emaTrend == 1 ? bgBullColor : showBG and emaTrend == -1 ? bgBearColor : na)
// ============================================================================
// Alerts
// ============================================================================
alertcondition(bullishBOS, "Bullish BOS", "Bullish Break of Structure detected!")
alertcondition(bearishBOS, "Bearish BOS", "Bearish Break of Structure detected!")
alertcondition(emaTrend == 1 and emaTrend != 1, "EMA Bullish", "EMA turned bullish")
alertcondition(emaTrend == -1 and emaTrend != -1, "EMA Bearish", "EMA turned bearish")
// ╔════════════════════════════════╗
// ║ Download at ║
// ╚════════════════════════════════╝
// ███████╗██╗███╗ ███╗██████╗ ██╗ ███████╗
// ██╔════╝██║████╗ ████║██╔══██╗██║ ██╔════╝
// ███████╗██║██╔████╔██║██████╔╝██║ █████╗
// ╚════██║██║██║╚██╔╝██║██╔═══╝ ██║ ██╔══╝
// ███████║██║██║ ╚═╝ ██║██║ ███████╗███████╗
// ╚══════╝╚═╝╚═╝ ╚═╝╚═╝ ╚══════╝╚══════╝
// ███████╗ ██████╗ ██████╗ ███████╗██╗ ██╗
// ██╔════╝██╔═══██╗██╔══██╗██╔════╝╚██╗██╔╝
// █████╗ ██║ ██║██████╔╝█████╗ ╚███╔╝
// ██╔══╝ ██║ ██║██╔══██╗██╔══╝ ██╔██╗
// ██║ ╚██████╔╝██║ ██║███████╗██╔╝ ██╗
// ╚═╝ ╚═════╝ ╚═╝ ╚═╝╚══════╝╚═╝ ╚═╝
// ████████╗ ██████╗ ██████╗ ██╗ ███████╗
// ╚══██╔══╝██╔═══██╗██╔═══██╗██║ ██╔════╝
// ██║ ██║ ██║██║ ██║██║ ███████╗
// ██║ ██║ ██║██║ ██║██║ ╚════██║
// ██║ ╚██████╔╝╚██████╔╝███████╗███████║
// ╚═╝ ╚═════╝ ╚═════╝ ╚══════╝╚══════╝
// ==========================================================================================

Breaker Blocks [TakingProphets]Breaker Blocks
Smart Money “breaker” zones automatically mapped on your chart.
This tool is designed for traders who use ICT / Smart Money concepts and want a clean, automated way to see breaker blocks form and evolve in real time.
-----------------------------------------------------------------------------------------------
🔍 What this indicator does
The script automatically detects potential bullish and bearish breaker blocks after a market structure shift, then draws and maintains those zones on your chart:
-Plots bullish breaker blocks as green shaded zones.
-Plots bearish breaker blocks as red shaded zones.
-Optionally shows the 50% (midline) of each breaker for refinement.
-Keeps a rolling list of the most recent breakers and removes older ones to keep your chart clean.
-Optionally hides breakers once price closes through them (invalidation), so only active zones remain.
It’s built to work on any symbol and any timeframe. Lower timeframes will naturally generate more breakers; higher timeframes will show fewer, more significant zones.
Important: This script does not open, manage, or close trades for you. It only visualizes price zones that may be relevant to your own strategy and analysis.
-----------------------------------------------------------------------------------------------
🧠 Core logic (high level)
Under the hood, the indicator:
Uses an internal zigzag swing structure to track major pivot highs and lows.
Watches for a market structure shift (MSS):
Bullish MSS: price closes above a prior swing high.
Bearish MSS: price closes below a prior swing low.
Once an MSS is confirmed, it:
Locates the relevant impulse candle(s) that price traded through.
Defines the breaker block using the high/low (or body vs. wick, based on internal settings).
Draws a breaker box from that origin forward in time.
Each breaker is stored as an internal object with:
Direction (bullish or bearish)
Top and bottom prices
Visual boxes and an optional midline
On every new candle, all active breakers are updated:
Extended forward as new bars print.
Optionally invalidated and deleted if price closes back through the breaker in the opposite direction.
This gives you a dynamic map of which breaker blocks are still “respected” by price and which have failed.
-----------------------------------------------------------------------------------------------
⚙️ Key Inputs & Settings
All user-facing options are grouped under “Breaker Blocks” for a clean UI.
-Display Breaker Block
Toggle the visualization on/off without removing detection logic.
-Bullish Color / Bearish Color
Choose the fill color for bullish and bearish breaker zones.
-Show 50% Line
Plots a dashed line at the mid-point of each breaker block.
Helpful if you use the 50% level as a refinement or entry anchor.
-Max Visible
Limits how many of the most recent breaker blocks stay on the chart.
Older breakers are deleted once this limit is exceeded (keeps things clean and lightweight).
-Hide When Invalidated
If enabled:
Bullish breaker is hidden once price closes below its low.
Bearish breaker is hidden once price closes above its high.
If disabled, breakers remain visible even after those closes (for study / backtesting purposes).
These options allow you to run the tool in either a minimal, current-context only mode, or a more historical, educational mode.
-----------------------------------------------------------------------------------------------
🧭 How traders might use it
Some common ways traders may incorporate breaker blocks into their own plans:
As context zones around which to look for entries using their personal triggers.
As potential support/resistance areas after a shift in structure.
To visually separate active vs. invalidated zones instead of manually redrawing them.
In confluence with other SMC tools (FVGs, liquidity pools, PD arrays, etc.) and higher-timeframe bias.
This indicator is intended as a visual aid and works best when combined with a complete trading plan, risk management rules, and your own discretion.
-----------------------------------------------------------------------------------------------
⚠️ Disclaimer
This indicator does not guarantee profits or specific outcomes.
It is provided for educational and informational purposes only.
Past price behavior around breaker blocks does not imply future results.
Always test any tool on a demo account or in a simulated environment before using it with real capital.
Trading involves risk, and you are solely responsible for your own decisions.

EMMTECH Doji Pullback StrategyThis is a trend-following pullback trading strategy for TradingView that identifies high-probability entry points when price temporarily moves against the main trend, then shows signs of reversal.
Core Concept
The indicator waits for the market to establish a trend (using the 100 EMA as a reference), then looks for a brief counter-trend pullback followed by a doji candle (indecision candle), which signals potential trend resumption.
Key Components
1. Trend Filter - 100 EMA
The orange line on your chart representing the 100-period Exponential Moving Average
Price above EMA = uptrend (look for buy setups)
Price below EMA = downtrend (look for sell setups)
2. Pullback Detection
The strategy counts consecutive candles moving against the trend:
In an uptrend: waits for 2+ consecutive red (bearish) candles
In a downtrend: waits for 2+ consecutive green (bullish) candles
3. Clean Candle Filter (Optional)
Filters out candles with large wicks to ensure strong directional moves:
Measures wick size relative to body
Default: wicks can't exceed 30% of body size
Ensures the pullback candles show genuine selling/buying pressure
4. Doji Confirmation
After the pullback, the strategy looks for a doji candle:
Small body relative to total range (default: ≤10% of candle range)
Represents indecision and potential exhaustion of the pullback
Often signals the trend is about to resume
Trade Signals
BUY Signal (Green triangle below bar):
Price is above 100 EMA ✓
2+ consecutive clean red candles ✓
Current candle is a doji ✓
SELL Signal (Red triangle above bar):
Price is below 100 EMA ✓
2+ consecutive clean green candles ✓
Current candle is a doji ✓
Risk Management Visualization
When a signal triggers, the indicator automatically draws:
Red line: Stop loss (placed at the low of the setup for buys, high for sells)
Green line: Target (1:1 risk-reward ratio) (Preferably set SL at recent low)
Teal box: Visual representation of the trade's risk-reward zone
Customizable Parameters
EMA Length: Default 100, adjust for faster/slower trend identification
Consecutive Candles: Minimum pullback candles required (default 2)
Wick Filter: Toggle clean candle requirement on/off
Wick Threshold: How much wick is acceptable (0.3 = 30%)
Doji Filter: Toggle doji requirement on/off
Doji Threshold: How small the body must be (0.1 = 10% of range)
Trading Logic
This strategy aims to catch the "sweet spot" where:
The main trend is still intact (EMA filter)
Weak hands have been shaken out (pullback)
Momentum is exhausting (doji appears)
Strong hands are likely to resume the trend
The background color (light green/red) helps you quickly identify which side of the trend you're on.

