Relative Outperformance Strategy (Long Only)Relative Strength used to spot entries. Gives good returns overall.
Penunjuk dan strategi

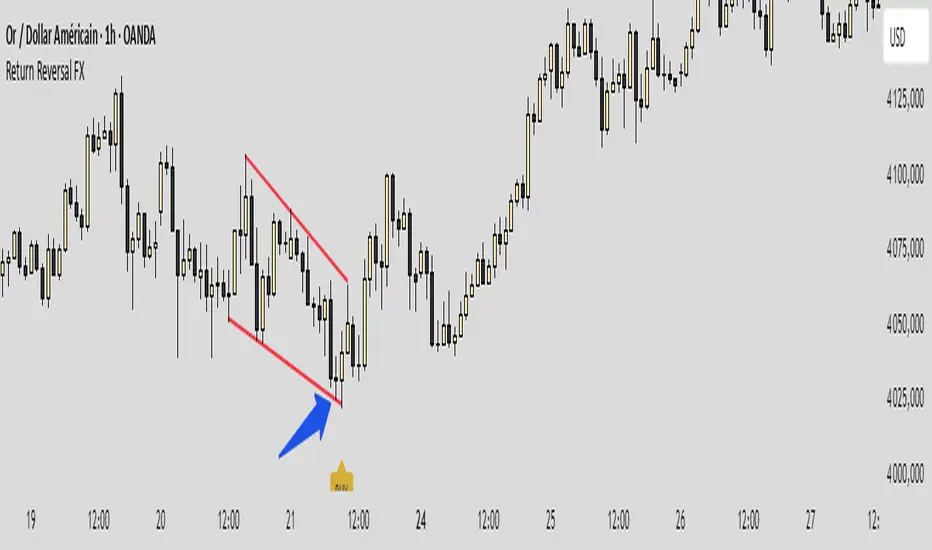
Return IchimoGiu Reversal FXReturn IchimoGiu Reversal FX — Extreme RSI/CCI Reversal System
Return IchimoGiu Reversal FX is a precision tool designed to detect high-quality reversal points based on extreme momentum exhaustion followed by controlled re-entry into equilibrium.
The system is built around a custom interpretation of the CCI, using:
extreme break levels
validated return thresholds
candle-level confirmation logic
optional signal rejection mechanics
This creates reversal signals that occur only when a genuine over-extension is followed by a structurally clean return into momentum.
🔍 How It Works
1️⃣ Extreme Break Detection
Price must drive the CCI beyond calibrated thresholds:
+266 for bullish exhaustion
−171 for bearish exhaustion
This filters out normal retracements and isolates only high-volatility extensions.
2️⃣ Controlled Return Signal
A signal appears when CCI re-enters moderated levels:
222 for sell setups
−114 for buy setups
The signal is printed directly on the candle that performs this return, ensuring timing precision.
3️⃣ Reset Protection
If the CCI breaks the extreme level again before confirmation → signal is cancelled.
This eliminates the majority of fake reversals.
⭐ What Makes This Indicator Original
Return Reversal FX is not a standard CCI signal.
It uses:
dual-threshold dynamic structure
candle-level validation
a proprietary state machine managing break → return → confirmation
tailored levels optimized through empirical research
This creates a unique reversal system unavailable through classic indicators.
📈 Best Usage
Works on indices, forex majors, metals and crypto
Recommended timeframe: M15 → H1
Ideal for counter-trend scalping and swing reversals
🔒 Access
This is an invite-only script.
To request access, please contact me on TradingView or Telegram.
IchimoGiu FX Pro IchimoGiu FX Pro — Advanced Trend & Structure Confirmation System
IchimoGiu FX Pro is an invite-only indicator designed to identify high-probability trend continuation setups using a dual-stage logic that combines market structure breaks with a custom Ichimoku-based confirmation engine.
Unlike standard Ichimoku or classic breakout indicators, IchimoGiu creates a unique interaction between structure shifts and equilibrium zones, allowing early detection of valid momentum phases while filtering out weak or false breakouts.
🔍 Core Functionalities
1️⃣ Pre-Breakout Detection (Structure Engine)
The indicator tracks relevant swing highs and lows and identifies when price approaches a potential BOS (Break of Structure).
This creates a Pre-Signal label, allowing traders to anticipate momentum shifts and prepare zones.
2️⃣ Confirmation Signal (IchimoGiu Filter)
Once structure is actually broken, the system applies a custom Ichimoku logic:
Tenkan/Kijun dynamic alignment
Cloud directional bias
Price location vs. equilibrium
Optional Chikou confirmation layer
Reset conditions to avoid false trends
Only when all internal conditions align is a confirmed BUY or SELL signal generated.
This makes IchimoGiu a precision tool for continuation trades, not a simple trend-following mashup.
⭐ What Makes IchimoGiu Original
IchimoGiu is not a merge of existing indicators.
It uses:
a proprietary pivot engine designed specifically for BOS/CHOCH,
re-engineered Ichimoku components optimized for confirmation speed,
an original pre-signal → confirmation structure logic,
unique reset and filtering conditions.
These concepts cannot be reproduced through classic Ichimoku or standard TradingView indicators.
📈 Best Practices
Recommended markets: XAUUSD, Nasdaq, US30, GBPUSD, EURUSD
Recommended timeframes: M15 → H1
Use the Pre-Signal to define interest zones
Enter only on confirmed labels for maximum reliability
🔒 Access
This is an invite-only script.
To request access, please send me a private TradingView message or contact me on Telegram.

BigCandleAndRSIAlertChanges Candle Color to your choosing for Big Candles or Big Wick Candles or Over Bought/Oversold RSI Levels.

The Trader's Edge (A professional Trader's tool)This is a script which is made by a professional stock trader and this script is capable of drawing Demand / Supply zones as well as capable of scoring the trade as well depending upon freshness, time spent in the zone, it also has the power to calculate the pre - defined risk to reward for every trade that you take as per this indicator. This script also displays the Trendo f the stock on 3 difrerent time frames on one single time frame easy to do multiple time frame analysis. and it also as the power of identifying which zones are falling outside "THE BOLLINGER BANDS" There by signaling an "ALL STAR ENTRY" This tool is A must have for any professional Stock trader.

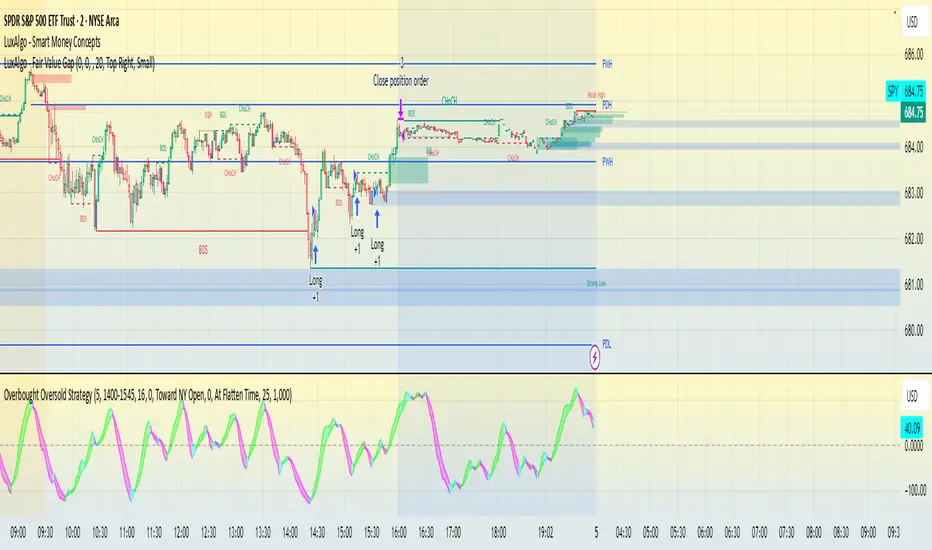
Overbought Oversold Strategy - SPY-SPX-QQQ 0DTEOverbought / oversold strategy designed for scalping. Configured to run for scalps at end of day.
The Overbought Oversold Strategy calculates a custom oscillator using exponential moving averages and standard deviation on a weighted price to identify momentum shifts.
Entry and Exit are tunable for back testing your style of trading.
It allows users to restrict trading to a specified session, defaulting to NY market hours (9:30 AM to 4:00 PM), and optionally flattens all positions at a user-defined time like market close to manage overnight risk. Entry strategies include buying only on buy signals, selling only on sell signals, or mean-reverting toward the NY open price or a custom target by entering long if below or short if above when signals align. Exit options comprise fixed tick-based profit targets and stop losses, closing on the next opposing signal, or holding until the flatten time, ensuring flexible risk management.
Trend Signal MomentumOVERVIEW
Signal Trend Momentum is a hybrid strategy that combines multiple confirmations and filters to obtain better potential trading signals. Each confirmation and filter in Signal Trend Momentum aims to avoid possible false and trap signals.
HYBRID CONCEPTS
Smart Money Concept – This indicator forms market structure and Bullish & Bearish Order Block areas to make it easier to identify market trends and strong areas where price reversals often occur. Its purpose is to simplify recognizing market direction and serve as the first confirmation.
MSS + BOS (Market Structure Shift + Break of Structure) – This indicator serves as additional confirmation for the Smart Money Concept. With the presence of two types of market structure, the market trend direction becomes clearer and more convincing.
RSI Momentum Signal – This indicator becomes the third confirmation. When the Market Trend is clear and convincing, supported by the formation of Bearish and Bullish Order Blocks, the role of the Momentum Signal here becomes crucial as it provides trend momentum based on overbought and oversold areas.
Momentum Position – This indicator becomes the next confirmation based on buyer and seller VOLUME in the market. If buyer volume is higher, the momentum position will be depicted on the chart with an upward arrow, and conversely, if seller volume is higher, it will be depicted with a downward arrow.
SnR (Support and Resistance) – This final indicator is Support and Resistance, which will serve as the last and more convincing confirmation. Support and Resistance will strengthen the Order Block areas formed by the Smart Money Concept indicator. A Bullish Order Block + Support creates a higher possibility for an upward trend in the market, conversely, a Bearish Order Block + Resistance creates a higher possibility for a downward trend in the market.
The combination of these several indicators will provide a strong market direction + persistent buyer and seller areas, as well as depict momentum based on volume + RSI which serve as additional confirmations.
These additional confirmations will produce stronger signals and help avoid false and trap signals in the market.
HOW TO USE
A SHORT SIGNAL will be strong if there is a Downtrend Market Structure + Bearish Order Block + Resistance + Oversold RSI Momentum + Strong Seller Volume Momentum.
A LONG SIGNAL will be strong if there is an Uptrend Market Structure + Bullish Order Block + Support + Overbought RSI Momentum + Strong Buyer Volume Momentum.
CONCLUSION
Signal Trend Momentum is a combination of several powerful indicators designed to produce stronger, clearer, and easier-to-read signals.
This strategy is highly suitable for traders seeking more convincing trade signals based on multiple confirmations from the combined indicators, thereby creating a strong signal with a higher probability.

Jenkins OscillatorAn oscillator designed to capture price movement relative to recent intra-candle volatility. Z-score normalization is applied to smoothed price and therefore should be read in terms of standard deviation AND direction.

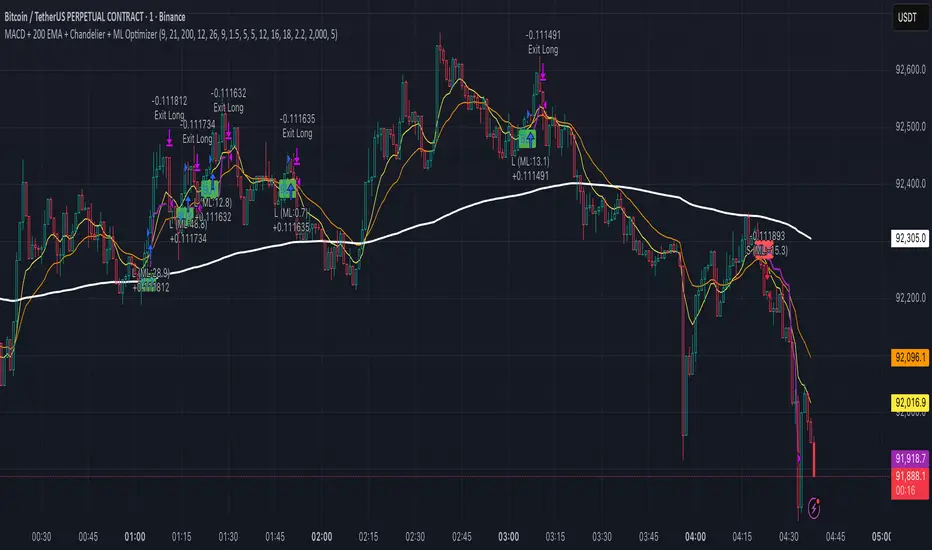
MACD + 200 EMA + Chandelier + ML OptimizerNeural MACD Trend Strategy
This script modernizes a classic high-probability trend strategy by integrating Machine Learning and dynamic risk management. It is built on the foundation of the 9, 21, and 200 EMAs with MACD execution, designed to automate the workflow of trend traders.
Key Features:
1. Core Logic: Trades are executed on MACD crosses, but only when aligned with the long-term trend (200 EMA). An optional setting enforces a simultaneous 9/21 EMA cross for high-momentum confirmation.
2. Machine Learning Optimizer: A K-Nearest Neighbors (KNN) algorithm runs in the background, analyzing RSI, CCI, and ROC. It compares the current setup to the last 1,000 bars of history; if the historical probability is negative, the ML blocks the trade to save capital.
3. Range Filter: Uses ADX to detect choppy markets. If the market is ranging (ADX < 20), the background turns gray and trading is paused.
4. Advanced Exits: Automatically calculates Stop Losses based on recent Swing Highs/Lows. Includes a Chandelier Exit (ATR Trailing Stop) to lock in profits dynamically. You can choose between fixed Reward-to-Risk targets (e.g., 1.5x) or disable targets to ride the trend until the trailing stop is hit.
Enhanced VolumeEnhanced Volume allows you to show multiple highlights on your volume:
HVE - Highest Volume Ever
HV1 - Highest Volume in 1 Year
Volume Average Moving Average
Projected Volume - Shows the projected volume based on the time of the bar left
2x and 3x volume bars. Shows to bars of where the volume needs to hit to be 2 or 3x above average
Color coding of low volume bars and high volume bars
Up/Down Volume
% Change

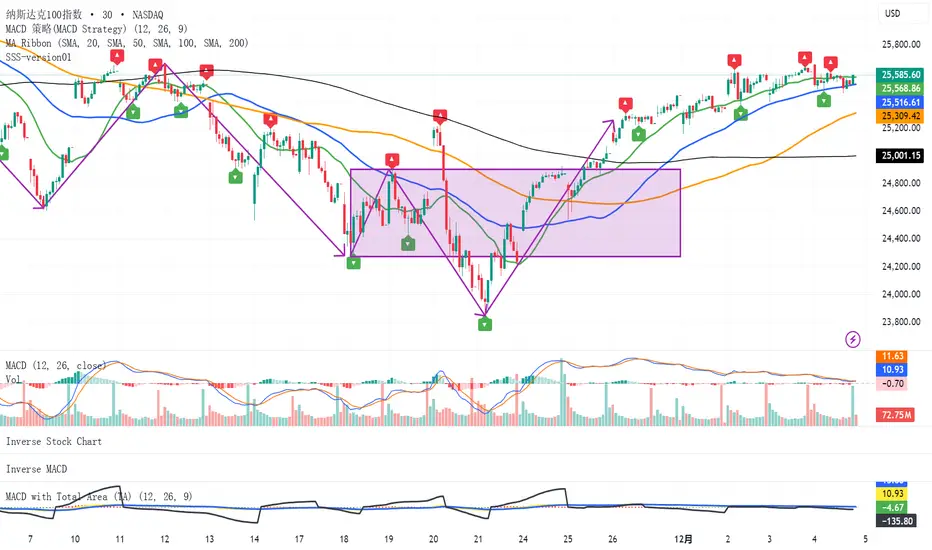
SSS-version01SSS(standard serialize system)
This indicator is designed to analyze market fluctuations and automatically mark the local highs and lows of each wave.
By tracking these key "twisting" points, the indicator provides a clear structural view of price movements, allowing users to visualize how each wave evolves within the broader trend.
Through overviewing the distribution of tops and bottoms, users can quickly recognize the underlying market direction and structure.
(While the signals may appear with a slight delay — as the formation of each wave requires confirmation — they provide a more reliable reflection of the completed market movement)
This is the initial release of the complete SSS indicator, focused on basic wave recognition and labeling.
Future updates will continuously refine the detection algorithm and introduce additional structural features, enabling a deeper and more detailed deconstruction of market behavior.

BEM Scalping & Trend Continuation ToolThe BEM Scalping & Trend Continuation Tool highlights 3-candle pullback structures into moving averages and visualizes potential continuation areas within ongoing trends. The script includes two pullback detectors using configurable moving averages, a trend-direction average, VWAP, signal markers, and dynamic swing-level tracking. These elements are designed to support visual analysis of short-term momentum, pullbacks, and structural behavior across different markets and timeframes.
How It Works:
The script identifies descending 3-bar patterns (for bullish pullbacks) and ascending 3-bar patterns (for bearish pullbacks). Pullbacks are highlighted when they interact with a selected moving average and meet additional structural criteria. Optional markers plot when such patterns occur.
Swing levels are detected using pivots, extended forward, and removed when invalidated.
Intended Use:
This tool supports discretionary and rule-assisted chart analysis by highlighting pullbacks, trend context, and market structure. It does not generate predictions or financial advice, and its signals do not imply performance or outcomes.
⭐ Core Features
1️⃣ Highlighted Pullback Bars (Fast + Deep Retracements)
The tool uses two customizable moving averages:
MA1 (default 9) → Fast trend pullback
MA2 (default 45) → Deeper retracement pullback
The script highlights candles when the price creates a structured 3-bar pullback into either moving average. Colors automatically reflect bullish or bearish continuation conditions.
2️⃣ Trend Direction Filter
A longer moving average (default 102) provides directional bias.
This helps traders visually stay aligned with the dominant trend.
3️⃣ VWAP Integration
VWAP is included as a dynamic institutional support/resistance level.
Useful for intraday bias, mean reversion, and trend continuation confluence.
4️⃣ Automated Pullback Signals
Triangle signals appear when a pullback meets all conditions:
Bullish/Short-term long
Bearish/Short-term short
Deep Bullish pullback (MA45)
Deep Bearish pullback (MA45)
These optional markers provide clear visual confirmation.
5️⃣ Smart Swing Lines (Auto-Structure Tracking)
Swing highs and lows are automatically detected and projected forward.
Broken levels self-remove to keep the chart clean.
Great for structure trading, liquidity analysis, and break-of-structure confirmation. To help identify the best possible scenario for the trend continuation pullback work A+.
🔍 How the Pullback Logic Works
The BEM Scalping & Trend Continuation Tool uses a 3-bar structural pattern:
Bullish Pullback Pattern
The High of the first candle needs to be higher than the second one, and the high of the second needs to be higher than the third, moving down in a pullback to the moving average.
Price wicks into MA
Open above MA (rejection)
Continuation expected upward
Bearish Pullback Pattern
The Low of the first candle needs to be lower than the second one, and the low of the second one needs to be lower than the third one, moving upward to the moving average.
Price wicks into MA
Open below MA (rejection)
Continuation expected downward
Bars are highlighted in different colors based on MA1(fast) or MA2(slow and deeper) pullback.
📘 How to Trade the System (Optional Use Case)
(Not predictive; for discretionary workflow support.)
LONG Scenario
Price above Trend MA
Price above VWAP (optional confluence)
Gold (MA9) or Blue (MA45) bullish pullback highlight
Bullish triangle plotted
Entry: candle close or break of signal candle high
Stop: below MA or swing low
Target: next liquidity level, swing high, or trail with MA9
SHORT Scenario
Price below Trend MA
Price below VWAP
Purple (MA9) or Deep Violet (MA45) bearish pullback highlight
Bearish triangle plotted
Entry: candle close or break of signal candle low
Stop: above MA or swing high
Target: next swing low or break structure
*
This tool is for charting and better visualization of pullback and trend continuation only.
It does not guarantee profits.
Always combine with proper risk management.

⚔️ The Scalpel⚔️ THE SCALPEL v2.0
━━━━━━━━━━━━━━━━━━━━━━━━━━━━━━━━━━━━━━━━━━━━━━━━━━━━━━━━
Surgical-Grade Market Structure Detection System
🔬 WHAT IS THE SCALPEL?
The Scalpel is a precision-engineered market structure analyzer that identifies and tracks critical support and resistance zones with surgical accuracy. Unlike conventional S&R tools that flood your chart with noise, The Scalpel cuts through the clutter to reveal only the most significant price structures.
━━━━━━━━━━━━━━━━━━━━━━━━━━━━━━━━━━━━━━━━━━━━━━━━━━━━━━━━
⚙️ CORE TECHNOLOGY
▸ Pivot-Based Detection Engine
Advanced pivot analysis calibrated by user-defined precision settings
▸ Tissue Integrity Validation
Filters structures based on candle body-to-range ratios
▸ Dynamic Stress Analysis
Tracks zone interactions and removes exhausted levels automatically
▸ Volatility-Adaptive Zones
Zone width scales with ATR for consistent performance across all markets
━━━━━━━━━━━━━━━━━━━━━━━━━━━━━━━━━━━━━━━━━━━━━━━━━━━━━━━━
🎨 VISUAL SPECTRUM
💜 STERILE ZONES (Electric Violet)
Fresh, untested structures with maximum potential
🔴 COMPRESSION ZONES (Magenta Fire)
Tested resistance ceilings under selling pressure
🩵 FOUNDATION ZONES (Neon Teal)
Tested support floors with proven buyer interest
✨ PLASMA AURA EFFECT
Multi-layered glow effect for enhanced visibility
━━━━━━━━━━━━━━━━━━━━━━━━━━━━━━━━━━━━━━━━━━━━━━━━━━━━━━━━
📐 PARAMETERS
🔪 Blade Precision (1-10)
Higher = fewer but sharper pivots detected
🩺 Tissue Integrity % (30-90)
Minimum candle body percentage required
📏 Incision Depth (0.1-2.0 ATR)
Controls zone thickness based on volatility
💉 Stress Threshold (1-10)
Maximum touches before zone invalidation
📐 Projection Range (10-200)
How far zones extend into the future
━━━━━━━━━━━━━━━━━━━━━━━━━━━━━━━━━━━━━━━━━━━━━━━━━━━━━━━━
💡 HOW TO USE
1. Fresh sterile zones (violet) are your highest-probability setups
2. Watch for price reaction at zone boundaries
3. Tested zones confirm structure but may have diminished strength
4. Zones auto-remove after stress threshold is reached
5. Use projection range to anticipate future tests
━━━━━━━━━━━━━━━━━━━━━━━━━━━━━━━━━━━━━━━━━━━━━━━━━━━━━━━━
🎯 BEST FOR
✓ Scalping & Day Trading
✓ Swing Trade Entries
✓ Stop Loss Placement
✓ Take Profit Targeting
✓ Multi-Timeframe Analysis
━━━━━━━━━━━━━━━━━━━━━━━━━━━━━━━━━━━━━━━━━━━━━━━━━━━━━━━━
⚠️ DISCLAIMER
This indicator is for educational purposes only. Always conduct your own analysis and use proper risk management. Past performance does not guarantee future results.
━━━━━━━━━━━━━━━━━━━━━━━━━━━━━━━━━━━━━━━━━━━━━━━━━━━━━━━━
🏷️ TAGS
support resistance zones SNR pivot points market structure scalping day trading swing trading price action order blocks smart money supply demand technical analysis

Ichimoku MTF HeatmapGreat for flying down you watchlist, getting an idea what time frame to go to. Enjoy!

Simulated Liquidation Heatmap [QuantAlgo]🟢 Overview
This indicator visualizes where clusters of stop-loss orders and liquidation levels are likely located, displayed as a 'heatmap'. It's based on the concept of market structure liquidity: large groups of stop orders tend to gather around obvious technical levels (like swing highs and lows), and these pools of orders often attract price movement from institutional traders. The indicator uses a fractal-based algorithm to identify these high-probability liquidation zones and displays them as dynamic, color-coded boxes.
The key feature is the thermal color gradient, which indicates the freshness (age) and therefore the relative relevance of the liquidity zone. Hot colors (e.g., Red/Yellow) represent fresh clusters that have just formed, suggesting strong and immediate liquidity interest. Cold colors (e.g., Blue/Purple) represent aged or decaying clusters that are becoming less relevant over time. This visualization allows traders to anticipate potential liquidity sweeps (stop hunts) and understand areas of significant retail and institutional positioning.
🟢 Key Features
1. Liquidity Zone Heatmap
The core function is the identification of swing high and swing low price points using a user-defined Lookback period. These points are where retail traders are statistically most likely to place their stop-loss orders. The indicator simulates the clustering of these orders by drawing a zone (box) around the detected swing point, with the vertical size controlled by the Stop/Liquidation Zone Width (%) setting.
▶ Cluster Lookback: Defines the sensitivity of swing point detection. Lower values detect frequent, minor zones (scalping/intraday); higher values detect major, stronger swing points (swing trading).
▶ Zone Width (%): Sets the percentage range above and below the swing point where stops are simulated to cluster, accounting for slippage and typical stop placement spread.
▶ Liquidity Decay: Zones gradually fade in color intensity and are eventually removed after the user-defined Liquidity Decay Period (Bars), ensuring the heatmap only displays relevant, current liquidity areas.
▶ Round Number Filter: An optional filter that limits the display to liquidity zones occurring only at psychologically significant round numbers (e.g., $100, $1,500.00), which typically attract higher concentrations of orders.
2. Thermal Color Gradient
The heatmap's color is a direct function of the zone's age, providing a visual proxy for immediate relevance.
▶ Freshness: Newly created zones are displayed in the Hot Color (high relevance).
▶ Decay: As bars pass, the zone color transitions along the gradient toward the Cold Color and increased transparency (lower relevance), until it is removed entirely.
▶ Color Schemes: Multiple pre-configured and custom color schemes are available to optimize the visualization for different chart themes and color preferences.
3. Liquidity Heat Thermometer
An optional visual thermometer is displayed on the chart to provide an instant, overall assessment of the current liquidation heat level in the immediate vicinity of the price.
▶ Calculation: The thermometer calculates an aggregate heat score based on the age and proximity of all liquidity zones within a user-defined Zone Detection Range (%) of the current price.
▶ Visual Feedback: A marker (triangle) points to the corresponding level on the thermometer's color gradient (Hot to Cold). A high reading indicates price is close to fresh, dense stop clusters, suggesting high volatility or an imminent liquidity sweep is probable. A low reading indicates price is in a low-density or aged liquidity area.
▶ Customization: The thermometer's resolution, position, and text size are fully customizable for optimal chart placement and readability.
🟢 Practical Applications
▶ Anticipate Sweeps: Prioritize trading in the direction of Hot (fresh) liquidity zones. For example, a hot low-side zone suggests strong sell-side liquidity (stop-losses) is available for large buyers to sweep.
▶ Filter Noise: Use the Round Number Filter to focus only on the highest probability liquidation zones, which are often at clean, psychological price levels.
▶ Validate Entries: Combine the Heat Thermometer with price action analysis. A rising heat level indicates increasing proximity to a major stop cluster, signaling a potential turn or an aggressive market move to sweep those stops.
▶ Risk Management: Understand that price often acts dynamically around these zones. High heat levels imply high risk/reward setups; stops should be placed strategically beyond the defined Liquidation Zone Width.
▶ Multi-Timeframe Context: Higher timeframes (e.g., Daily, 4-Hour) often reveal more significant, major liquidity zones. Use this indicator on lower timeframes (e.g., 5-min, 15-min) for execution, but prioritize zones that align with higher-timeframe structures.
