4x Stochastic Combo - %K only4x Stochastic Combo in one indicator.
Default parameters: (9, 3, 3), (14, 3, 3), (40, 4, 4), (60, 10, 10)
Only %K is shown.
Possibility to set alerts "all above 80" or "all below 20".
How to use:
Look for divergence after getting an alert for good quality signals. Connect the stochastic signals with multi-timeframe analysis.
Penunjuk dan strategi

ATR/ADR MTF Projection ArrayATR/ADR MTF Projection Array
Overview
A powerful predictive tool that projects ATR (Average True Range) and ADR (Average Daily Range) levels as clean support and resistance arrays on your chart. Designed for traders who want to anticipate the high and low of the day using volatility-based projections with multi-timeframe confluence.
This indicator combines traditional ATR analysis with ICT-style ADR methodology, giving you institutional-grade level projections from a single, customizable tool.
Key Features
🎯 Dual Volatility Metrics
ATR Projections — Classic volatility-based levels with full multi-timeframe support
ADR Projections (ICT Style) — Average Daily Range levels using Inner Circle Trader methodology
Enable/disable each independently based on your trading preference
📊 Multi-Timeframe ATR Analysis
Plot ATR levels from up to 3 timeframes simultaneously (Daily, Weekly, Monthly or custom)
Each timeframe displays with distinct styling for easy identification
Perfect for confluence trading across multiple time horizons
⚡ ICT ADR Methodology
NY Midnight calculation mode (ICT standard) or Classic Daily
Key ICT levels built-in:
1/3 ADR (Judas Swing) — Critical manipulation level where fake moves often terminate
1/2 ADR — Mid-range reference
2/3 ADR — Trending day continuation target
100% ADR — Full daily range completion
150% ADR — Extension target for expansion days
Two projection modes: Static (from anchor) or Dynamic (from session high/low)
🔧 Flexible Anchor Points
Previous Close (default)
Daily Open
Weekly Open
Monthly Open
Session Open
📈 Range Completion Tracking
Real-time display of how much of the expected daily range has been consumed
Visual status indicator helps identify when the day's move may be exhausted
How To Use
For Bias Confirmation:
Establish your directional bias using your preferred method (trigger day, market structure, etc.)
Monitor the 1/3 ADR level during London/NY open for potential Judas Swing (manipulation move)
Target 2/3 to 100% ADR for your HOD/LOD objective
For Target Setting:
Use ATR levels as volatility-based profit targets
ADR 100% level often marks session extremes
When Range Used reaches 100%+, expect consolidation or reversal
For Multi-Timeframe Confluence:
Enable Weekly/Monthly ATR levels alongside Daily
Look for clustering of levels across timeframes for high-probability zones
Settings Guide
Master Controls — Toggle ATR/ADR systems and bull/bear levels independently
ATR Settings — Configure period, multiplier, anchor point, and select which timeframes to display
ATR Level Multipliers — Choose which projection levels to show (0.5x, 0.75x, 1.0x, 1.25x, 1.5x)
ADR Settings (ICT Style) — Select calculation mode (NY Midnight recommended), period (5 days is ICT standard), and projection mode
ADR Level Selection — Toggle individual ICT levels (1/3, 1/2, 2/3, 100%, 150%)
Visual Settings — Customize colors, line styles, labels, and info table position
Alerts Included
ATR 1.0x Bull/Bear Cross
ADR 1/3 Judas Swing Zone (Bull/Bear)
ADR 100% Range Completion (Bull/Bear)

Institutional VWAP Pressure – 5M Execution With 15M HTF BiasHow Smart Money Fades Overextended Intraday Moves
Most intraday traders rely on lagging indicators, chasing breakouts or reacting emotionally to volatility spikes.
Institutional traders do the opposite: they fade inefficiencies, accumulate liquidity, and force price back toward VWAP — the intraday “fair value anchor”.
In this idea, I’ll show you how 5M execution timing combined with 15M VWAP bias creates one of the cleanest mean-reversion models you can trade.
🧩 Why VWAP Matters for Institutional Flow
Large players measure performance and position quality relative to VWAP.
When price stretches too far above or below VWAP:
liquidity becomes thin
market orders become inefficient
continuation becomes unlikely
reversion becomes the path of least resistance
This creates exploitable opportunities — if you know where to look.
⏱ Why the 5M Timeframe Is Ideal for Execution
Most intraday inefficiencies (liquidity grabs, stop runs, exhaustion wicks) occur on 1M–5M candles, not on higher timeframes.
On 5-minute, we see:
microstructure shifts
orderflow exhaustion
failed breakouts
aggressive wicks into VWAP extremes
momentum curls (stochastics turning)
These details are invisible on 15M, meaning the 5M chart is where the actual entries should be taken.
📊 Why 15M Should Be Your HTF Bias Layer
Before fading an extended move, you must know:
Is the session trending strongly?
Is VWAP sloping up or down?
Are we in a high-volume directional environment?
15M gives clarity that 5M alone cannot.
It filters out setups that would fail in trending conditions and ensures that reversion plays align with institutional behavior.
Think of 15M as your macro intraday compass.
🎯 The Institutional VWAP Pressure Setup
We use a combination of three factors:
1️⃣ VWAP Deviation Zones (Overextension)
Price must exceed a tolerance band (e.g., ±0.5%) from VWAP.
This marks inefficiencies where retail is trapped.
2️⃣ Volume Exhaustion (Weak Liquidity)
Continuation requires strong volume.
Reversion happens when volume drops below a threshold (e.g., 70% of average).
Weak volume = weak conviction = high reversion probability.
3️⃣ Momentum Reversal (Stochastics Curl)
Institutions don’t fade blindly — they wait for momentum to turn:
SHORT: Stoch turns down from high levels
LONG: Stoch turns up from depressed levels
This avoids early entries and aligns with microstructure shifts.
🔻 SHORT Conditions (5M Execution)
Price > VWAP + tolerance
Volume < 0.7 × average
Stoch turning down (momentum shift)
15M VWAP not trending strongly upward
This identifies weak, extended rallies likely to mean-revert.
🔹 LONG Conditions (5M Execution)
Price < VWAP − tolerance
Volume exhaustion (weak selling)
Stoch curling upward
15M VWAP not trending sharply downward
This captures panic-driven selling that institutions often buy.
🧠 Why This Works Consistently
Because the model isn’t based on patterns or random indicators — it’s based on how real liquidity is managed:
VWAP = institutional fair value
Extreme deviations = retail emotion
Low volume = lack of continuation
Stochastic curl = momentum turning
15M slope = session structure
You’re essentially trading the natural tendency of price to return to efficiency.

Dragon Smart Ratings (IBD/CANSLIM methodology)🐉 Dragon Smart Ratings – Institutional Grade Analysis
Dragon Smart Ratings is a comprehensive technical and fundamental analysis tool designed to identify market leaders instantly. Inspired by the legendary IBD/CANSLIM methodology, this script calculates five key ratings to help traders separate the "True Leaders" from the rest of the market.
📊 KEY RATINGS EXPLAINED
1. 🟢 Composite Rating (Overall Score)
The master score (1-99) that combines all other ratings.
Smart Protection Logic: Includes a "Contrarian Shield." If a stock has exceptional fundamentals (EPS/SMR) but temporary price weakness, the Composite Rating is protected to ensure you don't miss potential turnaround plays (e.g., META scenarios).
Leader Boost: If a stock exhibits both high RS and high EPS, the score is mathematically forced to 95-99.
2. 📈 RS Rating (Relative Strength)
Measures price performance against the general market (SPY) over the last 12 months.
Leader Logic: heavily weights the most recent 3 months.
Near-High Bonus: Awards extra points if the price is trading near its 52-week high.
3. 💰 EPS Rating (Earnings Per Share)
Analyzes earnings growth on both a Quarterly and Annual basis.
🚀 Smart Fill Technology: TradingView sometimes returns N/A or delayed data for ADRs (like TSM) or international stocks (like AGI). This script detects if a stock has high Price Strength (RS > 90) and automatically extrapolates a fair EPS score, ensuring Leaders are never rated "40" due to missing data.
King Mode: If a stock shows massive growth (>50%) in either the last quarter or the 3-year average, it gets a perfect score.
4. 💎 SMR Rating (Sales + Profit Margins + ROE)
Grades stocks from A (Best) to E (Worst).
Hero Mode: Unlike traditional strict algorithms, Dragon Ratings recognizes that one "Super Metric" (e.g., a massive 40% Margin) can outweigh a lower ROE. If a stock excels in just one category, it qualifies for an A or B.
5. 📦 Acc/Dis Rating (Accumulation/Distribution)
Analyzes Volume and Price action to detect Institutional Buying or Selling.
Strict Mode: Uses a refined Chaikin Money Flow (CMF) logic combined with a "Trend Penalty." It is very difficult to get an A rating unless there is significant heavy-volume buying while the price is above key moving averages.
📱 MOBILE OPTIMIZED (SOLO MODE)
Most fundamental scripts crash on mobile due to memory limits. Dragon Smart Ratings V33 uses advanced Tuple Requests and reduced historical calls to ensure zero crashes on the TradingView Mobile App, while still delivering deep fundamental analysis.
🔔 ALERTS & TELEGRAM INTEGRATION
Built-in support for JSON Alerts.
You can set up a single alert to send a formatted message to your Telegram Bot containing all rating details whenever a stock crosses your defined threshold (default: Composite > 80).
🛡️ COPYRIGHT & CREDITS
Powered by TieulongFX
🌐 Website: tieulongfx.com
This tool is developed to support the trading community with high-precision data analysis.
For tutorials, advanced trading strategies, and community support, please visit our website.
Disclaimer: This tool is for informational purposes only and does not constitute financial advice. Always do your own due diligence.

RSL Screener Column//@version=5
indicator("RSL Screener Column", shorttitle="RSL", overlay=false)
sma26 = ta.sma(close, 26)
rsl = close / sma26
plot(rsl)

UM OBV with Signal (EMA/SMA/WMA/NWE)SUMMARY
A visual OBV trend tool that highlights bullish and bearish volume pressure using smart smoothing and intuitive color-coding.
⸻
WHY THIS INDICATOR?
There are only three variables you can adjust on a chart: price, volume, and time. I wanted a good volume indicator.
⸻
DESCRIPTION
This tool extends classic On-Balance Volume with selectable trend smoothing (EMA, SMA, WMA, or NWE) and visual directional coloring on both OBV and the Signal line. Green shows bullish volume flow, red shows bearish volume flow. Optional crossover markers help confirm shifts in buying pressure.
Nadaraya-Watson Regression (NWE) provides a smooth, non-MA alternative for filtering volume trend noise, and optional dual-NWE coloring helps reduce false flips in choppy markets.
⸻
THE CHART
The indicator is added twice at the bottom; once with a 21 EMA and again with a 55 SMA. The chart has text and illustrations to show where the OBV flipped colors. More red equals more selling pressure. More green equals more buying volume or pressure.
⸻
DEFAULTS
• OBV smoothing length = 3
• Signal = 21 EMA
• Crossover bubbles are hidden/off by default
⸻
SUGGESTED USES
• Combine with price structure, momentum, or volatility tools to confirm trend strength.
• Try switching between EMA and NWE on faster intraday charts to see volume trend earlier.
• Use crossover signals as secondary confirmation rather than standalone entries.
• Use this indicator with your other favorite indicators for confirmation.
• Select timeframes suitable to your style of trading.
• I use the 30-minute, 6-hour, and Daily timeframes.
• I question myself if I am buying something with this indicator being red.
• Experiment with various timeframes and settings.
⸻
AUTHOR OBSERVATIONS
OBV often turns before price—especially when volume surges ahead of breakout levels.
NWE tends to smooth choppy OBV much better than traditional moving averages in noisy markets.
Look for Signal color flips at key support/resistance or volatility inflection points.
⸻
ALERTS
Right-click the indicator and choose Add alert… – two presets are available:
• Bullish OBV Turning Up
• Bearish OBV Turning Down

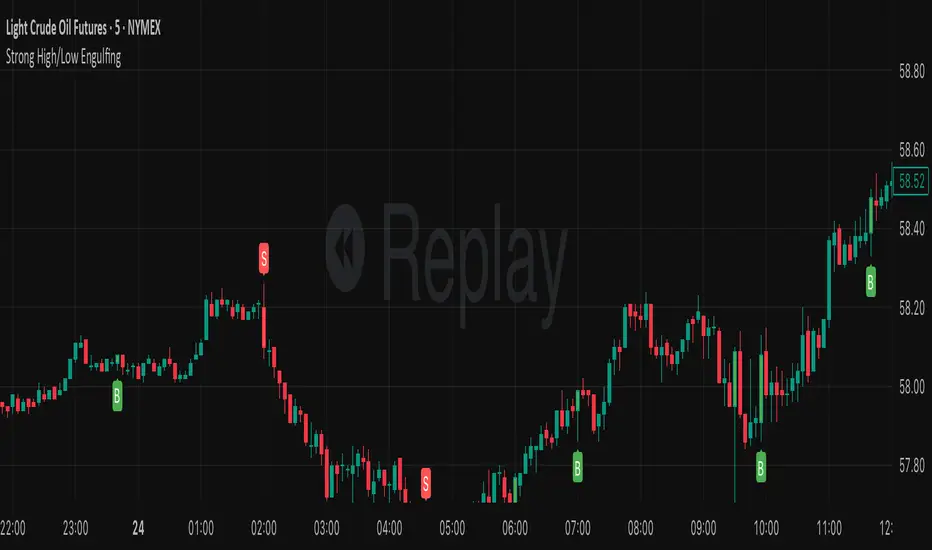
Strong High/Low EngulfingThis indicator identifies a high-momentum variation of the classic Engulfing candlestick pattern. Unlike standard engulfing patterns that only look at the candle body, this script requires the signal candle to completely engulf the entire range (High to Low) of the previous candle and, crucially, close beyond those extremes.
This logic is designed to filter out weak reversals and identify candles that signify a strong shift in market sentiment by "trapping" the previous candle's liquidity.
Unchased Wick Detector and ReversalsThis indicator can be used to track unchased wick from previous pivot points.
The idea is to visualise liquidity cluster and grab before a potential reversal.
Unchased wick Visual:
- White lines are protected highs or lows.
- Gray lines are previous wicks where prices have passed through and where the prices did not reverse.
Reversal window:
Reversal window parameters define a period range (a min and a max bars) where the reversal is valid.
The idea is that the reversal must be done in the couple bars right after the wick is chased (this event should stay short in time but you can adjust the period as you wish).
By default the default, the window 1-5 bars (e.g., daily, during 1-5 days).
Green color indicates a grab from a low and a reversal to the upside.
Red color indicates a grab from a high and a reversal to the downside.
Disclamer:
Of course this indicator can lead to false reversal signals and must be combined with other data and must be careful to use it alone for opening any position.
This indicator is a Alpha version let me know if any problem.

wedge hunter (Buy - Sell) signalsthis indicator can work on different options like forex and stock markets(shares).
this indicator watching charts for highs and lows and search for squeeze and pıvots for finding entrıes. i try to help to community for understand the formations and easly find an entry point. with rsi confirmation you find the best entry locations

ZynIQ Pullback Zones Lite - (Lite Pack)Overview
ZynIQ Pullback Zones Lite identifies dynamic EMA-based retracement areas inside trending markets. These zones highlight where price is most likely to pull back before continuing in the dominant direction. The tool is intentionally simple, visual, and designed to complement the rest of the ZynIQ Lite package without adding noise or complexity.
This is a contextual tool — ideal for timing continuation entries, filtering counter-trend trades, and improving overall trend structure awareness.
Key Features
• Dynamic pullback zones using profile-based EMA + ATR
• Smart trend detection with optional HTF confirmation
• Fresh-touch recognition for potential continuation setups
• Clean ZynIQ-themed visuals (teal/fuchsia zones)
• Lightweight chart footprint for intraday and swing traders
• ZynIQ Lite HUD with profile, trend and HTF status
• Moveable watermark for clear branding on streams and screenshots
• Alerts for long and short pullback opportunities
Use Cases
• Identifying pullback areas within established trends
• Avoiding early entries during retracements
• Timing continuation setups more cleanly
• Filtering false breakouts and counter-trend traps
• Combining with breakout or momentum tools for confluence
• Works on crypto, forex, indices and commodities
Notes
This tool provides structure and context for pullback-based trend trading.
It is not a standalone strategy and should be combined with your preferred confirmations and risk management rules.

RSI + MACD Day Trading Toolkit//@version=6
indicator("RSI + MACD Day Trading Toolkit", overlay = true)
//──────────────────────────────────────────────────────────────────────────────
// 1. INPUTS
//──────────────────────────────────────────────────────────────────────────────
// RSI settings
rsiLength = input.int(14, "RSI Length")
rsiOverbought = input.float(70, "RSI Overbought Level", minval = 50, maxval = 100)
rsiOversold = input.float(30, "RSI Oversold Level", minval = 0, maxval = 50)
// MACD settings (classic 12 / 26 / 9)
macdFastLength = input.int(12, "MACD Fast Length")
macdSlowLength = input.int(26, "MACD Slow Length")
macdSignalLength = input.int(9, "MACD Signal Length")
// Risk model selection
riskModel = input.string("ATR", "Risk Model", options = )
// ATR-based SL/TP
atrLength = input.int(14, "ATR Length")
atrSLMult = input.float(1.5, "SL ATR Multiplier", minval = 0.1, step = 0.1)
atrTPMult = input.float(2.5, "TP ATR Multiplier", minval = 0.1, step = 0.1)
// Percent-based SL/TP (for scalping on very tight spreads)
slPercent = input.float(0.5, "SL % (when Risk Model = Percent)", minval = 0.05, step = 0.05)
tpPercent = input.float(1.0, "TP % (when Risk Model = Percent)", minval = 0.05, step = 0.05)
// Visual / styling
showSLTPLines = input.bool(true, "Plot Stop Loss / Take Profit Lines")
//──────────────────────────────────────────────────────────────────────────────
// 2. CORE INDICATORS: RSI & MACD
//──────────────────────────────────────────────────────────────────────────────
rsiValue = ta.rsi(close, rsiLength)
// Manual MACD calculation (avoids tuple unpacking issues)
macdFastEMA = ta.ema(close, macdFastLength)
macdSlowEMA = ta.ema(close, macdSlowLength)
macdValue = macdFastEMA - macdSlowEMA
macdSignal = ta.ema(macdValue, macdSignalLength)
macdHist = macdValue - macdSignal
atrValue = ta.atr(atrLength)
// Hide internal plots from price scale (still accessible if you change display)
plot(rsiValue, "RSI", display = display.none)
plot(macdValue, "MACD", display = display.none)
plot(macdSignal, "MACD Sig", display = display.none)
plot(macdHist, "MACD Hist", display = display.none)
//──────────────────────────────────────────────────────────────────────────────
// 3. SIGNAL LOGIC (ENTRY CONDITIONS)
//──────────────────────────────────────────────────────────────────────────────
//
// Idea:
// - LONG bias: RSI emerges from oversold AND MACD crosses above signal below zero
// - SHORT bias: RSI falls from overbought AND MACD crosses below signal above zero
//
// Combines momentum (RSI) with trend confirmation (MACD).
//──────────────────────────────────────────────────────────────────────────────
// RSI events
rsiBullCross = ta.crossover(rsiValue, rsiOversold) // RSI crosses UP out of oversold
rsiBearCross = ta.crossunder(rsiValue, rsiOverbought) // RSI crosses DOWN from overbought
// MACD crossover with trend filter
macdBullCross = ta.crossover(macdValue, macdSignal) and macdValue < 0 // Bullish cross below zero-line
macdBearCross = ta.crossunder(macdValue, macdSignal) and macdValue > 0 // Bearish cross above zero-line
// Raw (ungated) entry signals
rawLongSignal = rsiBullCross and macdBullCross
rawShortSignal = rsiBearCross and macdBearCross
//──────────────────────────────────────────────────────────────────────────────
// 4. STATE MANAGEMENT (SIMULATED POSITION TRACKING)
//──────────────────────────────────────────────────────────────────────────────
//
// position: 1 = long
// -1 = short
// 0 = flat
//
// We track entry price and SL/TP levels as if this were a strategy.
// This is still an indicator – it just computes and plots the logic.
//──────────────────────────────────────────────────────────────────────────────
var int position = 0
var float longEntryPrice = na
var float shortEntryPrice = na
var float longSL = na
var float longTP = na
var float shortSL = na
var float shortTP = na
// Per-bar flags (for plotting / alerts)
var bool longEntrySignal = false
var bool shortEntrySignal = false
var bool longExitSignal = false
var bool shortExitSignal = false
// Reset per-bar flags each bar
longEntrySignal := false
shortEntrySignal := false
longExitSignal := false
shortExitSignal := false
//──────────────────────────────────────────────────────────────────────────────
// 5. EXIT LOGIC (STOP LOSS / TAKE PROFIT / OPPOSITE SIGNAL)
//──────────────────────────────────────────────────────────────────────────────
//
// Exits are evaluated BEFORE new entries on each bar.
//──────────────────────────────────────────────────────────────────────────────
// Stop-loss / take-profit hits for existing positions
longStopHit = position == 1 and not na(longSL) and low <= longSL
longTakeHit = position == 1 and not na(longTP) and high >= longTP
shortStopHit = position == -1 and not na(shortSL) and high >= shortSL
shortTakeHit = position == -1 and not na(shortTP) and low <= shortTP
// Opposite signals can also close positions
reverseToShort = position == 1 and rawShortSignal
reverseToLong = position == -1 and rawLongSignal
// Combine exit conditions
longExitNow = longStopHit or longTakeHit or reverseToShort
shortExitNow = shortStopHit or shortTakeHit or reverseToLong
// Register exits and flatten position
if longExitNow and position == 1
longExitSignal := true
position := 0
longEntryPrice := na
longSL := na
longTP := na
if shortExitNow and position == -1
shortExitSignal := true
position := 0
shortEntryPrice := na
shortSL := na
shortTP := na
//──────────────────────────────────────────────────────────────────────────────
// 6. ENTRY LOGIC WITH RISK MODEL (SL/TP CALCULATION)
//──────────────────────────────────────────────────────────────────────────────
//
// Only take a new trade when flat.
// SL/TP are calculated relative to entry price using either ATR or Percent.
//──────────────────────────────────────────────────────────────────────────────
if position == 0
// Long entry
if rawLongSignal
position := 1
longEntryPrice := close
if riskModel == "ATR"
longSL := longEntryPrice - atrValue * atrSLMult
longTP := longEntryPrice + atrValue * atrTPMult
else // Percent model
longSL := longEntryPrice * (1.0 - slPercent / 100.0)
longTP := longEntryPrice * (1.0 + tpPercent / 100.0)
longEntrySignal := true
// Short entry
else if rawShortSignal
position := -1
shortEntryPrice := close
if riskModel == "ATR"
shortSL := shortEntryPrice + atrValue * atrSLMult
shortTP := shortEntryPrice - atrValue * atrTPMult
else // Percent model
shortSL := shortEntryPrice * (1.0 + slPercent / 100.0)
shortTP := shortEntryPrice * (1.0 - tpPercent / 100.0)
shortEntrySignal := true
//──────────────────────────────────────────────────────────────────────────────
// 7. PLOTTING: ENTRIES, EXITS, STOPS & TARGETS
//──────────────────────────────────────────────────────────────────────────────
// Entry markers
plotshape(longEntrySignal, title = "Long Entry", style = shape.triangleup, location = location.belowbar, color = color.new(color.lime, 0), size = size.small, text = "LONG")
plotshape(shortEntrySignal, title = "Short Entry", style = shape.triangledown, location = location.abovebar, color = color.new(color.red, 0), size = size.small, text = "SHORT")
// Exit markers (generic exits: SL, TP or reversal)
plotshape(longExitSignal, title = "Long Exit", style = shape.xcross, location = location.abovebar, color = color.new(color.orange, 0), size = size.tiny, text = "LX")
plotshape(shortExitSignal, title = "Short Exit", style = shape.xcross, location = location.belowbar, color = color.new(color.orange, 0), size = size.tiny, text = "SX")
// Optional: show SL/TP levels on chart while in position
plot(showSLTPLines and position == 1 ? longSL : na, title = "Long Stop Loss", style = plot.style_linebr, color = color.new(color.red, 0), linewidth = 1)
plot(showSLTPLines and position == 1 ? longTP : na, title = "Long Take Profit", style = plot.style_linebr, color = color.new(color.lime, 0), linewidth = 1)
plot(showSLTPLines and position == -1 ? shortSL : na, title = "Short Stop Loss", style = plot.style_linebr, color = color.new(color.red, 0), linewidth = 1)
plot(showSLTPLines and position == -1 ? shortTP : na, title = "Short Take Profit", style = plot.style_linebr, color = color.new(color.lime, 0), linewidth = 1)
//──────────────────────────────────────────────────────────────────────────────
// 8. ALERT CONDITIONS
//──────────────────────────────────────────────────────────────────────────────
//
// Configure TradingView alerts using these conditions.
//──────────────────────────────────────────────────────────────────────────────
// Entry alerts
alertcondition(longEntrySignal, title = "Long Entry (RSI+MACD)", message = "RSI+MACD: Long entry signal")
alertcondition(shortEntrySignal, title = "Short Entry (RSI+MACD)", message = "RSI+MACD: Short entry signal")
// Exit alerts (by type: SL vs TP vs reversal)
alertcondition(longStopHit, title = "Long Stop Loss Hit", message = "RSI+MACD: Long STOP LOSS hit")
alertcondition(longTakeHit, title = "Long Take Profit Hit", message = "RSI+MACD: Long TAKE PROFIT hit")
alertcondition(shortStopHit, title = "Short Stop Loss Hit", message = "RSI+MACD: Short STOP LOSS hit")
alertcondition(shortTakeHit, title = "Short Take Profit Hit", message = "RSI+MACD: Short TAKE PROFIT hit")
alertcondition(reverseToShort, title = "Long Exit by Reverse Signal", message = "RSI+MACD: Long exit by SHORT reverse signal")
alertcondition(reverseToLong, title = "Short Exit by Reverse Signal", message = "RSI+MACD: Short exit by LONG reverse signal")
//──────────────────────────────────────────────────────────────────────────────
// 9. QUICK USAGE NOTES
//──────────────────────────────────────────────────────────────────────────────
//
// - Indicador, não estratégia: ele simula posição, SL/TP e sinais de saída.
// - Para backtest/auto, basta portar a mesma lógica para um script `strategy()`
// usando `strategy.entry` e `strategy.exit`.
// - Em day trade, teste ATR vs Percent e ajuste os multiplicadores ao ativo.
//──────────────────────────────────────────────────────────────────────────────

Pro Trader SystemPro Trader System is a comprehensive trading indicator that combines multiple technical analysis tools into one powerful system. It provides clear BUY/SELL signals with a proprietary scoring system (0-100) to help traders make informed decisions across all timeframes and markets.

Previous Day/Week High and Low • Ahmed SiddiquiThe script shows Previous Day's Candle High and Low & Previous Week's Candle High and Low which updates automatically everyday and every week. There are few more modification will be done in next versions.

MPT Efficient FrontierAMEX:VT
Efficient Frontier: The Tool for Creating a "Superb" Portfolio
The Efficient Frontier is a vital concept in the world of investment that helps investors build a Portfolio—a collection of investment assets—that provides the best possible return for a given level of acceptable risk. This concept stems from the Modern Portfolio Theory (MPT), developed by Nobel laureate in Economics, Harry Markowitz.
What is the Efficient Frontier?
Imagine all the possible investment combinations you can put together. Each portfolio combination has a different level of risk (measured by volatility or Standard Deviation) and a different expected return.
When you plot all these possible portfolios on a graph, with the horizontal axis representing Risk and the vertical axis representing Return, you get a cloud of points (portfolios).
The Efficient Frontier is the curve that sits on the upper-most and left-most boundary of this cloud of points.
"Upper-most" means that the portfolios on this line provide the maximum return for that specific level of risk.
"Left-most" means that the portfolios on this line have the lowest risk for a given return.
Simply put, a portfolio lying on the Efficient Frontier is considered "Efficient" because no other portfolio exists that can offer a higher return at the s ame level of risk, or lower risk at the same level of return.
How to Use the Efficient Frontier
Investors use the Efficient Frontier to help them decide on the optimal portfolio for their needs. The key steps are:
1. Data Collection and Generating Possible Portfolios
Collect Data: Use historical data (or future projections) for the assets you are interested in (e.g., stocks, bonds, funds) to calculate their Expected Return, Risk (Standard Deviation), and, most importantly, the Correlation between the different assets.
Simulate Portfolios: Use computers or mathematical programs to simulate thousands or tens of thousands of different asset mix proportions to find all possible portfolio points.
2. Finding the "Minimum Variance Portfolio" (MVP)
The Minimum Variance Portfolio (MVP) is the point on the frontier with the absolute lowest risk (the far-left point on the curve). Investors with a very low risk tolerance might focus on this portfolio.
3. Finding the "Optimal Portfolio" for You
Once the Efficient Frontier is established, investors must select the point on the line that aligns with their personal Risk Tolerance.
Risk-Averse Investors: Will choose points on the left side of the curve (low risk and moderate return).
Risk-Tolerant Investors: Will choose points on the right side of the curve (high risk and high return).
Visualization Elements:
🔴 Red/Orange/Yellow/Green Dots => Each dot represents 1 portfolio combination. Plotted according to Risk (X-axis) and Return (Y-axis).
Color Coding by Sharpe Ratio => 🟢 Green: Sharpe > 2
🟡 Yellow: Sharpe 1-2
🟠 Orange: Sharpe 0-1
🔴 Red: Sharpe < 0
⬤ Large Yellow DotRepresents the MAX SHARPE RATIO—the Optimal Portfolio! Lying on the Efficient Frontier curve. Labeled with " Efficient Frontier".
❶❷❸❹ Colored Circles => Represents the Individual Assets (e.g., Blue, Red, Green, Purple).
■ Blue Square => Represents the Current Portfolio location.
Four Data Tables
1. Optimal Weights Table => Compares Current vs. Optimal weights for each asset. Weights Comparison: Green = Should increase weight. Red = Should decrease weight.
Max Sharpe (Current and Optimal).
2.Performance Comparison => Return, Risk, Sharpe for Current vs. Optimal portfolios.Improvement Metrics: Return (percent increase), Risk (percent decrease), Sharpe (percent improvement).Recommendation: 🚀 REBALANCE! (Score > 20); Consider (5-20); Maintain (< 5).
3.Correlation Matrix => Displays the Correlation between all assets. Helps assess Diversification.
4.Asset Statistics => Provides detailed statistics for Each Individual Asset.

Bubbles + Clusters + SweepsIndicator For Bubbles + Clusters + Sweeps
✔ Volume bubbles
✔ Delta coloring (green/red intensity)
✔ Auto supply/demand zones
✔ Volume-profile style blocks inside zones
✔ Liquidity sweep markers
✔ Box drawings extending until filled
✔ Optional bubble filters (min-volume threshold)

GBM Prob: nearest unswept H/L (up to 50 bars)This indicator is designed to analyze market structure and price behavior in relation to previous highs and lows. It automatically identifies prior swing highs and lows and tracks whether they have been taken by the current price movement.
The main goal of the indicator is to show which side of the market has already been cleared of liquidity and where untouched liquidity remains. Based on this data, it calculates the percentage of liquidity taken, helping traders assess the directional bias of price.
The indicator can be used as a higher timeframe filter (D1, H4) and as contextual guidance for entries on lower timeframes during the London and New York sessions. It works especially well with ICT / SMC concepts, OTE zones, and liquidity-based analysis.
Suitable for both intraday and swing trading, the indicator helps traders make more informed decisions and avoid trading against already swept liquidity.

YSR TRIDENT FX - Smoothed Heiken Ashi Candles – Offset Version🧿 What This Indicator Does
This indicator plots Smoothed Heiken Ashi Candles with a custom vertical offset, allowing traders to view both:
Regular price candles
Smoothed Heiken Ashi trend candles
side-by-side without overlapping.
Traditional Heiken Ashi candles can hide real price movement.
This version solves that by adding double smoothing + adjustable spacing, giving crystal-clear trend visualization while preserving real market structure.
🔥 Key Features
✅ 1. Dual EMA Smoothing
The script applies smoothing twice:
First smoothing: EMA applied on OHLC
Second smoothing: EMA applied on Heiken Ashi values
This creates ultra-clean trend candles with reduced noise.
✅ 2. Adjustable Vertical Distance (Offset)
Control how far Smoothed HA candles appear from regular candles.
Great for:
Scalpers
Price Action traders
educators (clean charts)
No overlap → cleaner market structure.
✅ 3. Accurate Heiken Ashi Formula
Uses:
HA Close = Average of smoothed OHLC
HA Open = Previous HA Open + Previous HA Close / 2
HA High / Low = True trend-based levels
Fully compatible with all markets and timeframes.
🌈 Color Coding
Green → Bullish Trend
Red → Bearish Trend
(The colors follow the smoothed structure, not raw candles.)
✔️ Best Used For
Trend following
Reversal filtering
Identifying clean directional bias
Removing noise from volatile markets
⭐ Recommended Settings
Length 1: 9
Length 2: 9
Vertical Distance: 0.3% to 1%

BlackboxBlackbox is a comprehensive multi-session trading indicator designed for serious traders who need professional-level market structure analysis across all major trading sessions. This all-in-one toolkit combines institutional-grade session tracking, market structure identification, and key price level analysis into a single, powerful visualization tool.

Compression / ExpansionI created this Indicator to warn of compression and expansion so I could find the best area to trade I use it In conjunction with VWAP works on any timeframe and any asset where there is Volume
The Indicator produces a Letter C at the Start of Compression and a Letter E at the Start of Expansion you can change the settings to your liking On the chart my Expansion is in Red and compression is is Blue use In Conjunction with your favorite Indicators for Confluence

Annual Lump Sum: Yearly & CompoundedAnnual Lump Sum Investment Analyzer (Yearly vs. Compounded)
Overview
This Pine Script indicator simulates a disciplined "Lump Sum" investing strategy. It calculates the performance of buying a fixed dollar amount (e.g., $10,000) on the very first trading day of every year and holding it indefinitely.
Unlike standard backtesters that only show a total percentage, this tool breaks down performance by "Vintage" (the year of purchase), allowing you to see which specific years contributed most to your wealth.
Key Features
Automated Execution: Automatically detects the first trading bar of every new year to simulate a buy.
Dual-Yield Analysis: The table provides two distinct ways to view returns:
Yearly %: How the market performed specifically during that calendar year (Jan 1 to Dec 31).
Compounded %: The total return of that specific year's investment from the moment it was bought until today.
Live Updates: For the current year, the "End Price" and "Yields" update in real-time with market movements.
Portfolio Summary: Displays your Total Invested Capital vs. Total Current Value at the top of the table.
Table Column Breakdown
The dashboard in the bottom-right corner displays the following:
Year: The vintage year of the investment.
Buy Price: The price of the asset on the first trading day of that year.
End Price: The price on the last trading day of that year (or the current price if the year is still active).
Yearly %: The isolated performance of that specific calendar year. (Green = The market ended the year higher than it started).
Compounded %: The "Diamond Hands" return. This shows how much that specific $10,000 tranche is up (or down) right now relative to the current price.
How to Use
Add the script to your chart.
Crucial: Set your chart timeframe to Daily (D). This ensures the script correctly identifies the first trading day of the year.
Open the Settings (Inputs) to adjust:
Annual Investment Amount: Default is $10,000.
Table Size: Adjust text size (Tiny, Small, Normal, Large).
Max Rows: Limit how many historical years are shown to keep the chart clean.
Use Case
This tool is perfect for investors who want to visualize the power of long-term holding. It allows you to see that even if a specific year had a bad "Yearly Yield" (e.g., buying in 2008), the "Compounded Yield" might still be massive today due to time in the market.

ULTRA KAMA (Hayalet Sinyaller)Although you only see the KAMA (Kaufman Adaptive Moving Average) line on the chart, signal generation is managed by a powerful, 5-layer confirmation system running in the background.
Average Candle SizeI created this indicator because I couldn't find a simple tool that calculates just the average candle size without additional complexity. Built for traders who want a straightforward volatility measure they can fully understand. How it works:
1. Calculate high-low for each candle
2. Sum all results
3. Divide by the total number of candles
Simple math to get the average candle size of the period specified in Length.

Hyper Insight MA Strategy [Universal]Hyper Insight MA Strategy ** is a comprehensive trend-following engine designed for traders who require precision and flexibility. Unlike standard indicators that lock you into a single calculation method, this strategy serves as a "Universal Adapter," allowing you to **Mix & Match 13 different Moving Average types** for both the Fast and Slow trend lines independently.
Whether you need the smoothness of T3, the responsiveness of HMA, or the classic reliability of SMA, this script enables you to backtest thousands of combinations to find the perfect edge for your specific asset class.
---
🔬 Deep Dive: Calculation Logic of Included MAs
This strategy includes 13 distinct calculation methods. Understanding the math behind them will help you choose the right tool for your specific market conditions.
#### 1. Standard Averages
* **SMA (Simple Moving Average):** The unweighted mean of the previous $n$ data points.
* *Logic:* Treats every price point in the period with equal importance. Good for identifying long-term macro trends but reacts slowly to recent volatility.
* **WMA (Weighted Moving Average):** A linear weighted average.
* *Logic:* Assigns heavier weight to current data linearly (e.g., $1, 2, 3... n$). It reacts faster than SMA but is still relatively smooth.
* **SWMA (Symmetrically Weighted Moving Average):**
* *Logic:* Uses a fixed-length window (usually 4 bars) with symmetrical weights $ $. It prioritizes the center of the recent data window.
#### 2. Exponential & Lag-Reducing Averages
* **EMA (Exponential Moving Average):**
* *Logic:* Applies an exponential decay weighting factor. Recent prices have significantly more impact on the average than older prices, reducing lag compared to SMA.
* **RMA (Running Moving Average):** Also known as Wilder's Smoothing (used in RSI).
* *Logic:* It is essentially an EMA but with a slower alpha weight of $1/length$. It provides a very smooth, stable line that filters out noise effectively.
* **DEMA (Double Exponential Moving Average):**
* *Logic:* Calculated as $2 \times EMA - EMA(EMA)$. By subtracting the "lag" (the smoothed EMA) from the original EMA, DEMA provides a much faster reaction to price changes with less noise than a standard EMA.
* **TEMA (Triple Exponential Moving Average):**
* *Logic:* Calculated as $3 \times EMA - 3 \times EMA(EMA) + EMA(EMA(EMA))$. This effectively eliminates the lag inherent in single and double EMAs, making it an extremely fast-tracking indicator for scalping.
#### 3. Advanced & Adaptive Averages
* **HMA (Hull Moving Average):**
* *Logic:* A composite formula involving Weighted Moving Averages: ASX:WMA (2 \times Integer(n/2)) - WMA(n)$. The result is then smoothed by a $\sqrt{n}$ WMA.
* *Effect:* It eliminates lag almost entirely while managing to improve curve smoothness, solving the traditional trade-off between speed and noise.
* **ZLEMA (Zero Lag Exponential Moving Average):**
* *Logic:* This calculation attempts to remove lag by modifying the data source before smoothing. It calculates a "lag" value $(length-1)/2$ and applies an EMA to the data: $Source + (Source - Source )$. This creates a projection effect that tracks price tightly.
* **T3 (Tillson T3 Moving Average):**
* *Logic:* A complex smoothing technique that runs an EMA through a filter multiple times using a "Volume Factor" (set to 0.7 in this script).
* *Effect:* It produces a curve that is incredibly smooth and free of "overshoot," making it excellent for filtering out market chop.
* **ALMA (Arnaud Legoux Moving Average):**
* *Logic:* Uses a Gaussian distribution (bell curve) to assign weights. It allows the user to offset the moving average (moving the peak of the weight) to align it perfectly with the price, balancing smoothness and responsiveness.
* **LSMA (Least Squares Moving Average):**
* *Logic:* Calculates the endpoint of a Linear Regression line for the lookback period. It essentially guesses where the price "should" be based on the best-fit line of the recent trend.
* **VWMA (Volume Weighted Moving Average):**
* *Logic:* Weights the closing price by the volume of that bar.
* *Effect:* Prices on high volume days pull the MA harder than prices on low volume days. This is excellent for validating true trend strength (i.e., a breakout on high volume will move the VWMA significantly).
---
### 🛠 Features & Settings
* **Universal Switching:** Change the `Fast MA` and `Slow MA` types instantly via the settings menu.
* **Trend Cloud:** A dynamic background fill (Green/Red) highlights the crossover zone for immediate visual trend identification.
* **Strategy Mode:** Built-in Backtesting logic triggers `LONG` entries when Fast MA crosses over Slow MA, and `EXIT` when Fast MA crosses under.
### ⚠️ Disclaimer
This script is intended for educational and research purposes. The wide variety of MA combinations can produce vastly different results. Past performance is not indicative of future results. Please use proper risk management.
