Hosoda ZHosoda’s Clouds is a trend-following strategy designed to trade only long positions in traditionally trending markets with a strong bullish bias: SPY(D); DJI (D); NDX (D); XAUUSD (D); Tesla (D, H4, H1); AAPL (D, H4, H1); GOOG (D, H4); META (D, H4); NVDA (D, H4); AMZN(D, H4).
Strategy Parameters
Initial Capital: $10,000 USD.
Position Size: Risks 10% of your equity per trade.
Commission: 0.1%
Indicators
The strategy combines two main technical tools:
A. Ichimoku Cloud This is the core of the strategy. It calculates the classic lines:
• Tenkan-sen (Fast Line): Average of the highest high and lowest low of the last 9 periods.
• Kijun-sen (Base Line): Average of the last 26 periods.
• Cloud (Senkou Span A and B): Projects future support/resistance.
B. EMA 500 (Trend Filter)
• A 500-period Exponential Moving Average is calculated.
• Function: Serves as a very long-term trend filter. If the price is above the EMA 500, the market is considered bullish in the long term.
Entry Rules
• Bullish Cross (Bull Cross): The fast line (Tenkan) crosses above the base line (Kijun). This is the classic Ichimoku entry signal.
• Trend Filter (Optional):
•If you check the "Enable EMA Filter" box in the options, the system will only buy if the closing price is above the EMA 500.
•If the box is unchecked, it will ignore the EMA and buy based solely on the Ichimoku cross.
Exit Rules
A. Stop Loss (Loss Protection) It is a dynamic Stop Loss based on market structure, not a fixed percentage.
• At the moment of entry, the code looks back 12 bars (configurable in sl_bars_back) and finds the lowest price (low).
• It places the Stop Loss at that minimum level.
• Visual: Draws a dotted red line on the chart showing where your Stop Loss is.
B. Technical Take Profit (Exit due to Weakness) Lets profits run until the trend shows weakness.
• Condition: Closes the trade if the Tenkan line crosses below the bottom of the Cloud .
• This means short-term momentum has been lost and the price has entered or crossed below the cloud.
Statistics Panel
In the top right corner, the code draws a table (Panel) that updates in real-time or at the end of Backtesting. It shows:
• Total P&L: Net profit or loss in dollars.
• Win Rate: Percentage of winning trades.
• Trades: Total number of trades executed.
Summary
1. The script waits for the blue line (Tenkan) to cross over the red line (Kijun).
2. It verifies if the price is above the orange line (EMA 500) (if the filter is active).
3. If so, it BUYS.
4. It immediately places a Stop Loss at the low of the last 12 candles (red dotted line).
5. It keeps the trade open until the Stop Loss is hit or until the Tenkan line drops below the Cloud.
Customizable Settings
• Whether to use the EMA filter or not.
• The EMA length (default is 500).
• The Ichimoku periods (9, 26, 52 are standard).
• How many bars to look back to set the Stop Loss.
Penunjuk dan strategi

AI PRE-MARKET PRO - True/Fake Gap Classification-Version 1.0## **AI PRE-MARKET PRO: QUICK START GUIDE**
This indicator classifies market gaps by comparing the **Current Price** to yesterday’s **High (PDH)**, **Low (PDL)**, and **Close (PDC)**.
### **1. GAP CLASSIFICATIONS**
* **🔥 TRUE GAPS (High Momentum)**
* **True Gap Up:** Price is above PDH. The market is in "Discovery Mode." High probability of trend continuation.
* **True Gap Down:** Price is below PDL. Significant bearish sentiment. High probability of further selling.
* **⚠️ FAKE GAPS (Mean Reversion)**
* **Fake Gap Up:** Above PDC but below PDH. Price is "trapped" in yesterday's value. Often reverts to the Close (PDC).
* **Fake Gap Down:** Below PDC but above PDL. Price is "trapped." Often bounces back toward the Close (PDC).
### **2. TRADING STRATEGY CHEAT SHEET**
| Scenario | Primary Play | Entry Logic |
| --- | --- | --- |
| **True Gap Up** | **Continuation** | Wait for a pullback to **PDH**; buy the hold. |
| **True Gap Down** | **Continuation** | Wait for a rally to **PDL**; short the rejection. |
| **Fake Gap Up** | **Fade/Range** | Short the rejection of **PDH** or **ONH**; target **PDC**. |
| **Fake Gap Down** | **Fade/Range** | Buy the bounce at **PDL** or **ONL**; target **PDC**. |
### **3. CRITICAL LEVELS ON YOUR CHART**
* **PDH / PDL:** The "Line in the Sand." Breaking these turns a Fake Gap into a True Gap.
* **ONH / ONL:** Overnight High/Low. These are your immediate support/resistance targets for the first 30 minutes of trading.
* **PDC:** Previous Day Close. The "Magnet." If the market doesn't trend, it usually returns here.
### **4. HOW TO READ THE AI TABLES**
* **Left Table:** Shows real-time distance (RT Δ) to key levels and whether they have been hit yet (**Mitigated**).
* **Bottom Tables:** Provide a probability-based "Game Plan" and specific execution rules (e.g., "Wait for 15-minute confirmation").
---
**Next Step:** Would you like me to show you how to set up an alert for when the price crosses the **PDH** or **PDL** to catch a True Gap breakout?

10 DMA vs 20 DMA Professional Chart by hasan15 minutes chart for intraday bull and bear flag . this will gives you trend confirmation as well

Colored HMA + Color SARThis is a simple yet effective chart setup that I really like and trade with. I use the Heiken Ashi candlesticks so with this I get three conformations in one. If you like it great. I am not a coder but I do know what works for my brain and thought I would share this, thanks to Chat GBT.
I use it for entry most of the time on the 5 minute chart New York open. I also like the Orb break and retest by Quant Crawler as my second indicator.

Volume MAs Oscillator | Lyro RS// This Pine Script® code is subject to the terms of the Mozilla Public License 2.0 at mozilla.org
// © LyroRS
//@version=6
indicator("Volume MAs Oscillator | Lyro RS")
import LyroRS/LMAs/1 as DynamicMAs
//─────────────────────────────────────────────────────────────────────────────────────────────────────────────
//─██████─────────████████──████████─████████████████───██████████████───────████████████████───██████████████─
//─██░░██─────────██░░░░██──██░░░░██─██░░░░░░░░░░░░██───██░░░░░░░░░░██───────██░░░░░░░░░░░░██───██░░░░░░░░░░██─
//─██░░██─────────████░░██──██░░████─██░░████████░░██───██░░██████░░██───────██░░████████░░██───██░░██████████─
//─██░░██───────────██░░░░██░░░░██───██░░██────██░░██───██░░██──██░░██───────██░░██────██░░██───██░░██─────────
//─██░░██───────────████░░░░░░████───██░░████████░░██───██░░██──██░░██───────██░░████████░░██───██░░██████████─
//─██░░██─────────────████░░████─────██░░░░░░░░░░░░██───██░░██──██░░██───────██░░░░░░░░░░░░██───██░░░░░░░░░░██─
//─██░░██───────────────██░░██───────██░░██████░░████───██░░██──██░░██───────██░░██████░░████───██████████░░██─
//─██░░██───────────────██░░██───────██░░██──██░░██─────██░░██──██░░██───────██░░██──██░░██─────────────██░░██─
//─██░░██████████───────██░░██───────██░░██──██░░██████─██░░██████░░██───────██░░██──██░░██████─██████████░░██─
//─██░░░░░░░░░░██───────██░░██───────██░░██──██░░░░░░██─██░░░░░░░░░░██───────██░░██──██░░░░░░██─██░░░░░░░░░░██─
//─██████████████───────██████───────██████──██████████─██████████████───────██████──██████████─██████████████─
//─────────────────────────────────────────────────────────────────────────────────────────────────────────────
// LyroRS v1.0
// Groups
ma_g = "𝗠𝗢𝗩𝗜𝗡𝗚 𝗔𝗩𝗘𝗥𝗔𝗚𝗘"
bands_g = "𝗕𝗔𝗡𝗗"
display_g = '𝗗𝗜𝗦𝗣𝗟𝗔𝗬'
// Inputs
// -- Moving Average
source = input.source(close, "Source", group= ma_g, tooltip= "Select where the data originates (open, high, low, close, etc..).")
ma_type = input.string("EMA", "Select Moving Average", options= , group=ma_g, tooltip="Choose a moving average type to apply to the price multiplied by volume. VWMA already incorporates volume directly.")
ma_length = input.int(30, "Moving Average Length", group= ma_g, tooltip= "Defines the length or period of the selected moving average.")
// -- Bands
band_length = input.int(27, "Band Length", group=bands_g, tooltip="Number of bars used to calculate standard deviation.")
band_smoothing = input.float(0.8, "Band Smoothing", group=bands_g, minval=0, tooltip="Smooths the band edges to reduce noise.")
pbm = input.float(1.8, "Positive Band Multiplier", group=bands_g, minval=0, tooltip="Multiplier for the upper band distance.")
nbm = input.float(-0.85, "Negative Band Multiplier", group=bands_g, maxval=0, tooltip="Multiplier for the lower band distance.")
// Color Inputs
signal_type = input.string("Trend", "Select Signal Type", options= , group=display_g, tooltip="Select which way to use the indicator.")
ColMode = input.string("Mystic", "Custom Color Palette", inline="drop", options= , display=display.none, group= display_g, tooltip="Select a predefined color scheme for the indicator display. (Major Themes color mode automatically switches colors based on the major asset you picked for valuation analysis.)")
cpyn = input.bool (true, "Use Custom Palette", group= display_g, display=display.none, tooltip="Enables custom color selection for signals.")
cp_UpC = input.color (#00ff00, "Custom Up", inline = "Custom Palette", group= display_g, display=display.none, tooltip="")
cp_DnC = input.color (#ff0000, "Custom Down", inline = "Custom Palette", group= display_g, display=display.none, tooltip="User specifed bullish and bearish colors.")
d_obos_sigs = input.bool (true, "Display Oversold/Overbought Signs", group= display_g, display=display.none, tooltip="Enables triangle signs to be displayed.")
d_signs = input.bool (true, "Display Signs", group= display_g, display=display.none, tooltip="Enables signs for Trend mode.")
d_bgcol = input.bool (true, "Display Background Color", group= display_g, display=display.none, tooltip="Enables background color for Reversion & Valuation mode.")
// Colors
color UpC = na
color DnC = na
// -- Predefined Colors
switch ColMode
"Classic" =>
UpC := #00E676
DnC := #880E4F
"Mystic" =>
UpC := #30FDCF
DnC := #E117B7
"Accented" =>
UpC := #9618F7
DnC := #FF0078
"Royal" =>
UpC := #FFC107
DnC := #673AB7
// -- Custom Colors
if cpyn
UpC := cp_UpC
DnC := cp_DnC
// Coloring Function for Valuation
coloring(src) =>
color.from_gradient(src, ta.lowest(src, band_length), ta.highest(src, band_length), UpC, DnC)
// Moving Average Switch
float ma = na
switch ma_type
"SMA" => ma := DynamicMAs.SMA(source * volume, ma_length) / DynamicMAs.SMA(volume, ma_length)
"EMA" => ma := DynamicMAs.EMA(source * volume, ma_length) / DynamicMAs.EMA(volume, ma_length)
"WMA" => ma := DynamicMAs.WMA(source * volume, ma_length) / DynamicMAs.WMA(volume, ma_length)
"VWMA" => ma := DynamicMAs.VWMA(source, volume, ma_length) // Already Volume Based MA
"DEMA" => ma := DynamicMAs.DEMA(source * volume, ma_length) / DynamicMAs.DEMA(volume, ma_length)
"TEMA" => ma := DynamicMAs.TEMA(source * volume, ma_length) / DynamicMAs.TEMA(volume, ma_length)
"RMA" => ma := DynamicMAs.RMA(source * volume, ma_length) / DynamicMAs.RMA(volume, ma_length)
"HMA" => ma := DynamicMAs.HMA(source * volume, ma_length) / DynamicMAs.HMA(volume, ma_length)
"LSMA" => ma := DynamicMAs.LSMA(source * volume, ma_length, 0) / DynamicMAs.LSMA(volume, ma_length, 0)
"SMMA" => ma := DynamicMAs.SMMA(source * volume, ma_length) / DynamicMAs.SMMA(volume, ma_length)
"ALMA" => ma := DynamicMAs.ALMA(source * volume, ma_length, 0, 20) / DynamicMAs.ALMA(volume, ma_length, 0, 20)
"ZLSMA" => ma := DynamicMAs.ZLSMA(source * volume, ma_length) / DynamicMAs.ZLSMA(volume, ma_length)
"FRAMA" => ma := DynamicMAs.FRAMA(source * volume, ma_length) / DynamicMAs.FRAMA(volume, ma_length)
"KAMA" => ma := DynamicMAs.KAMA(source * volume, ma_length) / DynamicMAs.KAMA(volume, ma_length)
"JMA" => ma := DynamicMAs.JMA(source * volume, ma_length, 0) / DynamicMAs.JMA(volume, ma_length, 0)
"T3" => ma := DynamicMAs.T3(source * volume, ma_length, 0.5) / DynamicMAs.T3(volume, ma_length, 0.5)
price_diff = ((source - ma) / ma) * 100 // Percentage Difference between Source and the Moving Average of the source
// Calculations for the Bands
std = ta.stdev(price_diff, band_length)
upperBandRaw = std * pbm
lowerBandRaw = std * nbm
var float upperBand = na
var float lowerBand = na
// Smooth
upperBand := upperBandRaw * band_smoothing + nz(upperBand ) * (1 - band_smoothing)
lowerBand := lowerBandRaw * band_smoothing + nz(lowerBand ) * (1 - band_smoothing)
// Plot Color
var color pc = na
var color uB_color = na
var color lB_color = na
var int signal = 0
if signal_type == "Trend"
uB_color := UpC
lB_color := DnC
if price_diff > upperBand
pc := UpC
signal := 1
if price_diff < lowerBand
pc := DnC
signal := -1
if signal_type == "Reversion"
uB_color := DnC
lB_color := UpC
if price_diff > upperBand
pc := DnC
signal := -1
else if price_diff < lowerBand
pc := UpC
signal := 1
else
pc := color.gray
signal := 0
if signal_type == "Valuation"
uB_color := UpC
lB_color := DnC
pc := coloring(price_diff)
// Plot
plot(price_diff, color= pc, linewidth = 2, title= "Volume MAs Oscillator")
plot(upperBand, color= color.new(uB_color, 50), title= "Upper Band")
plot(lowerBand, color= color.new(lB_color, 50), title= "Lower Band")
plot(0, color= color.new(pc, 60), linewidth = 2, display= display.pane, title= "Mid Line")
plot(0, color= color.new(pc, 75), linewidth = 5, display= display.pane, title= "Mid Line Glow 1")
plot(0, color= color.new(pc, 85), linewidth = 10, display= display.pane, title= "Mid Line Glow 2")
plotchar(upperBand + 0.5, char='▼', color= ta.crossunder(price_diff, upperBand) ? DnC : na, location=location.absolute, title= "Overbought Signal", display= d_obos_sigs ? display.pane : display.none, size= size.tiny)
plotchar(lowerBand - 0.5, char='▲', color= ta.crossover(price_diff, lowerBand) ? UpC : na, location=location.absolute, title= "Oversold Signal", display= d_obos_sigs ? display.pane : display.none, size= size.tiny)
reversion_enable = signal_type == "Reversion"
valuation_enable = signal_type == "Valuation"
bgcolor(d_bgcol and ((valuation_enable and price_diff > upperBand) or (reversion_enable and ta.crossunder(price_diff, upperBand))) ? color.new(DnC, 85) : na, title= "BG Color OB")
bgcolor(d_bgcol and ((valuation_enable and price_diff > upperBand) or (reversion_enable and ta.crossunder(price_diff, upperBand))) ? color.new(DnC, 85) : na, title= "BG Color OB Overlay", force_overlay = true)
bgcolor(d_bgcol and ((valuation_enable and price_diff < lowerBand) or (reversion_enable and ta.crossover(price_diff, lowerBand))) ? color.new(UpC, 85) : na, title= "BG Color OS")
bgcolor(d_bgcol and ((valuation_enable and price_diff < lowerBand) or (reversion_enable and ta.crossover(price_diff, lowerBand))) ? color.new(UpC, 85) : na, title= "BG Color OS Overlay", force_overlay = true)
plotshape(ta.crossover(signal, 0), title="Buy Signal", location=location.belowbar,
style=shape.labelup, text="𝓛𝓸𝓷𝓰", textcolor=#000000, size=size.small,
color=UpC, force_overlay=true, display= signal_type == "Trend" and d_signs == true ? display.pane : display.none)
plotshape(ta.crossunder(signal, 0), title="Sell Signal", location=location.abovebar,
style=shape.labeldown, text="𝓢𝓱𝓸𝓻𝓽", textcolor=#000000, size=size.small,
color=DnC, force_overlay=true, display= signal_type == "Trend" and d_signs == true ? display.pane : display.none)
plotcandle(open, high, low, close, color= pc, wickcolor = pc, bordercolor = pc, force_overlay = true, display= display.pane, title= "Plot Candle")
barcolor(pc, title= "Barcolor")
// ==========================================================================================
// === Dashboard with Telegram Link ===
var table myTable = table.new(position.top_center, 1, 1, border_width=1, frame_color=color.black, bgcolor=color.white)
// Add Telegram Message to Dashboard
table.cell(myTable, 0, 0, "Join Telegram @mrexpert_ai", bgcolor=color.blue, text_color=color.white, text_size=size.normal)

Jin#10 HMA/OBV Pro Trader System (15m)HMA/OBV Pro Trader System Overview (15m Timeframe)
This system is designed to identify high-probability entry and exit points on the 15-minute chart by integrating multiple indicators for confirmation.
1. Trend and Confirmation
HMA Lines (Solid Lines): These are two Hull Moving Averages (HMA 8 and HMA 15).
Green/Red HMA 8 (Line 1): The faster HMA, showing short-term momentum.
Blue/Red HMA 15 (Line 3): The slower HMA, indicating the medium-term trend direction.
Trend Alignment: A strong trend requires the fast HMA (8) to be above the slow HMA (15) and both to be sloping favorably.
MTF Background Color (Candle Background): This represents the 30-minute trend filter.
Light Green/Teal: The 30-minute trend is upward and strong.
Light Orange/Red: The 30-minute trend is downward and strong.
This acts as a major confirmation filter for entries.
2. Trading Signals (Shapes)
🚀 BUY / 🔻 SELL: These are the Final Confirmation Signals. They appear when all conditions (HMA alignment, Stochastic, MACD, and the 30m MTF filter) are met.
⚠️ Pre-BUY / Pre-SELL: These are Warning/Early Signals indicating that most conditions on the 15m chart are aligned, but the 30m filter has not yet confirmed the trend direction.
🔥 Volatility Spike / 🧊 Volatility Crash (Small Circle): Alerts the user to an unusually large candle (ATR spike), signaling extreme volatility or a potential reversal.
3. Exit and Risk Management
ATR Trailing Stop (Dashed Line): This dynamic line serves as a Soft Exit or Stop-Loss Guide.
❌ Exit Long / Exit Short (X-Cross): This shape appears when the price crosses the ATR Trailing Stop, suggesting the existing position (Long or Short) should be closed immediately.
Dashed TP/SL Lines (Green/Red): These lines mark a calculated Take Profit (TP) and Stop Loss (SL) based on the entry price and the defined Risk-Reward Ratio (e.g., 1:1.5).

AI-based Price action confluence dashboard# **AI-Based Price Action Confluence Dashboard - Publication Guide**
Here's a comprehensive introduction guide for your TradingView indicator publication:
***
## **📊 TITLE**
**AI-Based Price Action Confluence Dashboard**
***
## **🎯 SHORT DESCRIPTION** (For the summary field)
A sophisticated real-time confluence scoring system that analyzes multiple price action signals across 15-minute timeframes, providing traders with an AI-weighted scoring mechanism (0-6 scale) to identify high-probability trade setups through visual signal panels and intelligent path detection.
***
## **📝 FULL DESCRIPTION**
### **Overview**
The AI-Based Price Action Confluence Dashboard is an advanced technical indicator designed to eliminate guesswork in intraday trading by systematically scoring and displaying multiple price action signals in real-time. Unlike traditional single-indicator approaches, this dashboard employs a confluence methodology that combines multiple independent signals to provide stronger trade confirmations and reduce false signals.
This indicator is specifically optimized for **1-minute chart analysis** while monitoring **15-minute price structure**, making it ideal for day traders and scalpers who need precise entry timing with larger timeframe context.
***
### **🔑 Key Features**
**✅ Real-Time AI Confluence Scoring**
- Dynamic scoring system (0-6 points) for both bullish and bearish setups
- Visual meter display shows signal strength at a glance
- Color-coded backgrounds indicate confluence levels (strong, moderate, mixed)
**✅ Multi-Signal Analysis**
The dashboard tracks 6 distinct signal types:
1. **FTFC (First to Finish Close)** - Base & Bonus signals
2. **Long/Short Grab** - Liquidity sweep patterns (Path A)
3. **High/Low Hold** - Extended momentum confirmation (+2 bonus)
4. **2-Up/2-Down** - Clean breakout patterns (Path B)
5. **Breakaway** - First candle gap strategies
**✅ Intelligent Path Detection**
- Mutually exclusive path logic prevents signal conflicts
- Automatically identifies whether price is following a "sweep path" or "clean path"
- Unavailable paths are clearly marked with gray indicators
**✅ Visual Signal Panels**
- 🟢 Green Light = Bullish signal ACTIVE
- 🔴 Red Light = Bearish signal ACTIVE
- 🟡 Yellow Light = Signal BUILDING (conditions partially met)
- ⚪ White Light = Signal OFF
- ▪️ Gray Square = Path UNAVAILABLE (mutually exclusive)
**✅ Comprehensive Alert System**
- 10 different alert conditions covering all major signals
- Strong confluence alerts (5+ points)
- Individual signal completion alerts
- Customizable alert messages
***
### **📐 How It Works**
#### **The Confluence Methodology**
This indicator implements a sophisticated confluence trading approach where multiple independent price action signals are combined to identify high-probability setups. Each signal type contributes points to either the bullish or bearish score, with a maximum of 6 points per direction.
**Scoring Breakdown:**
**BULLISH SIGNALS:**
- FTFC Base (15m close > previous 15m close) = +1
- FTFC Bonus (price clears 15th candle high) = +1
- **PATH A (Sweep):** Long Grab = +1, High Hold Bonus = +2
- **PATH B (Clean):** 2-Up = +1, 2-Up Bonus = +1
- Breakaway (gap above first candle) = +1
**BEARISH SIGNALS:**
- FTFC Base (15m close < previous 15m close) = +1
- FTFC Bonus (price clears 15th candle low) = +1
- **PATH A (Sweep):** Short Grab = +1, Low Hold Bonus = +2
- **PATH B (Clean):** 2-Down = +1, 2-Down Bonus = +1
- Breakaway (gap below first candle) = +1
#### **Path Detection Logic**
The indicator automatically determines which path the market is following:
**PATH A: SWEEP PATH**
- Activated when previous 15m low (bull) or high (bear) is breached
- Indicates liquidity grab before reversal
- Includes powerful +2 bonus for "Hold" confirmations
- Mutually exclusive with Path B
**PATH B: CLEAN PATH**
- Activated when previous 15m low (bull) or high (bear) holds
- Indicates strong directional momentum without sweep
- Cleaner price action but smaller point potential
- Mutually exclusive with Path A
This mutual exclusivity prevents double-counting and ensures signal accuracy.
***
### **🎨 How to Use**
#### **Installation**
1. Add indicator to your 1-minute chart
2. The dashboard appears as a table overlay (default: top right)
3. No additional indicators required - this is a complete system
#### **Reading the Dashboard**
**Top Section - Confluence Meter:**
- Shows current bull/bear scores with visual dot meters
- Background color changes based on confluence strength:
- **Bright Green/Red** = 5+ points (strong directional bias)
- **Medium Green/Red** = 3+ points (moderate bias)
- **Orange** = 3+ points both sides (conflicting signals)
- **Gray** = Low confluence (choppy conditions)
**Signal Panels Section:**
- Each row shows a signal type with bull/bear lights side-by-side
- Active signals (🟢🔴) contribute to the total score
- Building signals (🟡) indicate potential setups forming
- Unavailable paths (▪️) show which exclusive path is blocked
#### **Trading Strategy**
**High-Probability Long Entries:**
- Bull score ≥ 5 AND bear score ≤ 1
- Multiple green lights active in signal panels
- PATH A or PATH B showing full completion
- Consider entry on pullback to key 15m level
**High-Probability Short Entries:**
- Bear score ≥ 5 AND bull score ≤ 1
- Multiple red lights active in signal panels
- PATH A or PATH B showing full completion
- Consider entry on rally to key 15m level
**Avoid Trading When:**
- Both scores are 3+ (conflicting signals)
- No path is showing active/building status
- Score is below 3 on both sides (low confluence)
#### **Risk Management**
- Use 15m swing high/low for stop placement
- Target opposing 15m level or previous session extremes
- Scale out at partial targets when confluence decreases
- Best results when combined with proper position sizing
***
### **⚙️ Customization**
**Dashboard Settings:**
- **Table Location:** Top Left, Top Right, Bottom Left, Bottom Right
- **Text Size:** Tiny, Small, Normal, Large
**Color Scheme:**
- **Bullish Color:** Customize green for bull signals (default: #00cc66)
- **Bearish Color:** Customize red for bear signals (default: #ff4444)
- **Building Color:** Customize yellow for forming signals (default: #ffaa00)
- **Inactive Color:** Customize gray for off signals (default: #555555)
- **Unavailable Color:** Customize dark gray for blocked paths (default: #333333)
All colors can be adjusted to match your chart theme or visual preferences.
***
### **🎯 Best Practices**
1. **Use on 1-minute charts only** - The indicator is calibrated for this timeframe
2. **Trade during liquid sessions** - Best results during NY/London overlap
3. **Wait for 3+ confluence** - Minimum threshold for trade consideration
4. **Watch path transitions** - Signal strength changes when paths flip
5. **Use alerts strategically** - Set alerts for 5+ confluence to catch strong setups
6. **Combine with volume** - High volume confirms signal validity
7. **Respect 15m structure** - Don't fight the larger timeframe bias
***
### **⚠️ Important Notes**
- This indicator is designed for **intraday trading only**
- Requires active monitoring during trading sessions
- Works best on liquid instruments (major forex pairs, indices, large-cap stocks)
- Not suitable for swing trading or position trading
- Past performance does not guarantee future results
- Always use proper risk management and position sizing
***
### **🏷️ Category**
**Oscillators** or **Volatility** (choose based on TradingView categories)
***
### **🏷️ Suggested Tags**
- confluence
- price action
- day trading
- scalping
- intraday
- signals
- dashboard
- multi-timeframe
- 1-minute
- 15-minute
***
### **📜 Disclaimer**
This indicator is a tool for technical analysis and should not be used as the sole basis for trading decisions. All trading involves risk, and you should never risk more than you can afford to lose. The developer assumes no responsibility for trading losses incurred through the use of this indicator. Always practice proper risk management and consider your own risk tolerance before trading.


Andres System - SuperTrend DMI EMAAdvanced Multi-Filter Trading System combining SuperTrend, DMI (Directional Movement Index), and EMA crossovers for high-probability trade entries.
**Key Features:**
- Real-time DMI table showing trend strength (Sideways/Mild/Normal/Strong/Very Strong)
- Filter status dashboard - see exactly which conditions are met
- Smart entry logic: signals trigger during entire EMA alignment period, not just at exact crossover
- Clear BUY/SELL signals with exit markers
- One signal per trade - prevents duplicate entries
**Entry Requirements:**
LONG: EMA 7 > 21 + SuperTrend bullish + DI+ > 20
SHORT: EMA 7 < 21 + SuperTrend bearish + DI- > 20
**Exit Conditions:**
Position closes when EMA crosses back or SuperTrend changes direction
**Additional Tools:**
- Previous Day High/Low levels
- Daily VWAP
- Color-coded EMAs (7, 21, 50)
- Customizable thresholds for all filters
**Best Timeframes:** 4H for swing trading, 1D for position trading
All visual elements can be toggled on/off. Alerts available for all signals.

ADX Trend IndicatorThe Average Directional Index (ADX) is commonly known in English as the "Trend Strength Indicator" or "ADX Trend Strength Indicator".It measures the strength of a trend (regardless of direction: up or down), not the direction itself. Traders often call it a "trending ADX" or simply "ADX for trend" when focusing on its role in identifying strong trending markets (typically when ADX > 25).Quick Overview in English:ADX > 25 — Strong trend (good for trend-following strategies).
ADX < 20 — Weak or no trend (ranging/sideways market; avoid trend trades).
It combines with +DI (positive directional indicator) and -DI (negative directional indicator) to also show trend direction.

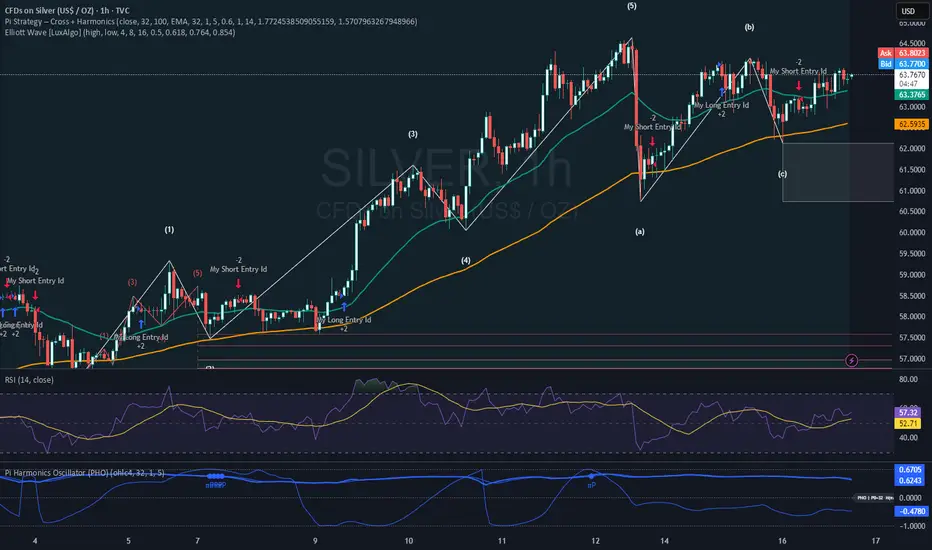
Pi Strategy Cross Harmonicsstill customizing this one, buy and sell seems to off on alternate time settings.
a work in progress, see if this works for anyone.
thanks again.
Plan Your Trade, Trade Your Plan. Levels. - by TenAMTrader📍 Plan Your Trade, Trade Your Plan. Levels. — by TenAMTrader
Successful trading is rarely about predicting — it’s about preparing.
"Plan Your Trade, Trade Your Plan. Levels" is designed to bridge the gap between analysis and execution by forcing clarity before the trade ever happens. Instead of reacting to price in real time, this tool encourages traders to define their plan, map their key levels, and then simply trade what they already decided.
🧠 Why Planning Matters
Most trading mistakes don’t come from bad analysis — they come from abandoning a plan mid-trade. Emotions take over when levels aren’t clearly defined ahead of time.
This indicator is built around a simple philosophy:
Make the plan first. Trade the plan second.
By writing your thesis directly into the indicator and visually anchoring it to price, you remove ambiguity and hesitation when the market starts moving.
📊 What This Indicator Does
Converts your written trade plan or market outlook into clearly plotted price levels
Automatically identifies:
Pivot level (key decision point)
Resistance levels (above pivot)
Support levels (below pivot)
Displays contextual notes directly on the chart so you always remember why a level matters
Keeps your focus on execution, not interpretation
✍️ How to Use It
Paste your daily or weekly plan into the Input your Plan/Levels box
Let the script extract and plot the levels automatically
Observe how price behaves around predefined zones
Execute only what aligns with your original plan
No guesswork. No moving targets.
🎯 Designed For
Traders who value structure and discipline
Futures, index, and equity traders who trade key levels
Traders focused on process over prediction
⚠️ Important Disclaimer
This indicator is provided for educational and informational purposes only and does not constitute financial advice, investment advice, or a recommendation to buy or sell any security, futures contract, or financial instrument.
Trading involves substantial risk and is not suitable for all investors. Past performance is not indicative of future results. All trading decisions, risk management, and position sizing are the sole responsibility of the user.
By using this indicator, you acknowledge that TenAMTrader assumes no liability for any losses, damages, or decisions made based on its use.
Trade prepared. Trade disciplined.
"Plan Your Trade, Trade Your Plan.
— TenAMTrader

FVG Heatmap [Hash Capital Research]FVG Map
FVG Map is a visual Fair Value Gap (FVG) mapping tool built to make displacement imbalances easy to see and manage in real time. It detects 3-candle FVG zones, plots them as clean heatmap boxes, tracks partial mitigation (how much of the zone has been filled), and summarizes recent “fill speed” behavior in a small regime dashboard.
This is an indicator (not a strategy). It does not place trades and it does not publish performance claims. It is a market-structure visualization tool intended to support discretionary or systematic workflows.
What this script detects
Bullish FVG (gap below price)
A bullish FVG is detected when the candle from two bars ago has a high below the current candle’s low.
The zone spans from that prior high up to the current low.
Bearish FVG (gap above price)
A bearish FVG is detected when the candle from two bars ago has a low above the current candle’s high.
The zone spans from the current high up to that prior low.
What makes it useful
Heatmap zones (clean, readable FVG boxes)
Bullish zones plot below price. Bearish zones plot above price.
Partial fill tracking (mitigation progress)
As price trades back into a zone, the script visually shows how much of the zone has been filled.
Mitigation modes (your definition of “filled”)
• Full Fill: price fully trades through the zone
• 50% Fill: price reaches the midpoint of the zone
• First Touch: price touches the zone one time
Optional auto-cleanup
Optionally remove zones once they’re mitigated to keep the chart clean.
Fill-Speed Regime Dashboard
When zones get mitigated, the script records how many bars it took to fill and summarizes the recent environment:
• Average fill time
• Median fill time
• % fast fills vs % slow fills
• Regime label: choppy/mean-revert, trending/displacement, or mixed
How to use
Use FVG zones as structure, not guaranteed signals.
• Bullish zones are often watched as potential support on pullbacks.
• Bearish zones are often watched as potential resistance on rallies.
The fill-speed dashboard helps provide context: fast fills tend to appear in more rotational conditions, while slow fills tend to appear in stronger trend/displacement conditions.
Alerts
Bullish FVG Created
Bearish FVG Created
Notes
FVGs are not guaranteed reversal points. Fill-speed/regime is descriptive of recent behavior and should be treated as context, not prediction. On realtime candles, visuals may update as the bar forms.

USD Liquidity Regime for BTC Perps (Dual) V1USD Liquidity Regime for BTC Perps (Dual)
This intents to be a BTC Perps USD Liquidity Regime macro indicator.
As it names states it is designed for BTCUSDT perpetual futures traders.
It attempts to tracks USD strength (DXY, UUP, yields, VIX composite) as liquidity proxy:
Lower index = weak USD = Risk-On (green background/histogram = long tailwind for BTC).
Higher = strong USD = Risk-Off (red = caution longs, shorts favor).
How to use:
Green background/histogram: Favor longs — rallies likely, dips bought.
Red: Caution longs — corrections hurt, short bias possible.
Blue line (index) vs red SMA: Crosses signal regime shifts.
Histogram strength: Bigger bars = stronger bias.
This is not intended as financial advise or trigger signal tool.
This is a work in progress
Its value is limited, if you do not understand any or some of the words above please do not use this indicator. If you did, then you understand you are not supposed to use this alone to make decisions.
Feel free to ask any questions, this is a work in progress.
Feel free to suggest improvements.
Educational macro context tool — not signals/advice.
Ok for avoiding going against the USD trend dominance by following liquidity.
By @frank_vergaram

Sell-to-Buy Pressure RatioSell/Buy Pressure Ratio
What It Measures
The Sell/Buy Pressure Ratio quantifies the aggressiveness of sellers versus buyers by comparing conviction-weighted volume on down candles versus up candles. It answers a simple question: who is more committed right now—buyers or sellers?
How It Works
The indicator examines each candle and determines directional conviction based on where price closes within the bar's range. A candle that closes near its high shows strong buyer conviction. A candle that closes near its low shows strong seller conviction. This conviction percentage is then multiplied by volume to create a weighted measure of buying and selling pressure.
The ratio divides total selling pressure by total buying pressure over a lookback period. A ratio of 1.5 means sellers are 50% more aggressive than buyers. A ratio of 0.5 means buyers are twice as aggressive as sellers.
Key Features
Conviction weighting: Not all volume is equal. A strong close near the high counts more than a weak close mid-range.
Doji handling: Indecisive candles (where open and close are nearly equal) split volume 50/50 between buyers and sellers.
Volume filtering: Low-volume bars below 60% of average are excluded to focus on meaningful activity.
Normalized output: Optional -1 to +1 scale for cross-stock comparison.
Interpretation
RatioMeaning≤ 0.5Strong buyers — accumulation, continuation setups0.5 – 0.8Buyers favored — healthy environment for longs0.8 – 1.2Balanced — equilibrium, wait for direction1.2 – 1.5Sellers favored — caution warranted≥ 1.5Strong sellers — distribution, avoid new longs
Primary Use
Timing entries within confirmed trends. The ratio identifies when selling pressure has exhausted itself, signaling safer entry points. Rather than buying strength, traders wait for the ratio to transition from elevated levels back toward equilibrium—buying when selling stops being dangerous.
What It Does Not Do
This indicator does not predict direction. It measures current pressure dynamics. Pair it with trend analysis (moving averages, price structure) to determine direction, then use the pressure ratio to time entries and exits.

CT Market Fragility & Systemic Risk Monitor v1.0CT ⊕ Market Fragility & Systemic Risk Monitor v1.0
Systemic Stress & Market Regime Monitor
OVERVIEW
Wall Street-grade structural monitoring now open-source.
CT ⊕ Market Fragility & Systemic Risk Monitor v1.0 is a real-time systemic risk tool designed to detect fragility before it hits price. Built by former institutional traders, it delivers structural insight typically reserved for desks inside hedge funds and global macro desks.
This isn’t about finding entries or exits, it’s about understanding the environment you're trading in, and recognizing when it's shifting.
WHAT IT DOES
• Monitors six key market domains: Equities, Rates/Credit, FX (USD stress), Commodities, Crypto, and Macro
• Detects volatility stress, cross-domain coupling, and regime synchronization
• Classifies market structure into Normal → Fragile → Critical
• Shows a live dashboard with scores, coupling levels, and structural state
• Plots event markers (T1, T2, T3) for structural transitions
• Implements hysteresis logic to model post-stress 'memory
• Supports both single-domain ("Local Mode") and system-wide monitoring
HOW IT WORKS
This engine does not rely on traditional TA. No moving averages. No MACD. No patterns. No guesswork.
Instead, it measures how markets are behaving beneath price detecting when stress is:
• Building internally
• Spreading across domains
• Synchronizing into systemic fragility
T1 (🟠) — Early instability: acceleration in market coupling
T2 (🔵) — Fragile regime: multiple domains simultaneously stressed
T3 (🔴) — Critical regime: synchronized, system-wide stress
These are not buy/sell signals. They are structural regime alerts, the same kind used by institutions to cut risk before stress cascades.
WHY IT MATTERS
Most retail tools are reactive. They interpret surface-level patterns after the move.
This tool is different. It’s proactive – measuring pressure before it breaks structure.
Institutions have used structural fragility models like this for years. This script helps close that gap, giving everyday traders the same early warnings that pros use to reduce exposure and sidestep systemic blowups.
It’s not about finding the edge.
It’s about not getting crushed when the system breaks.
Whether you trade crypto, stocks, FX, or macro, this engine helps answer:
• Is the system stable right now?
• Are stress levels rising across markets?
• Is it time to tighten risk?
Institutions don’t wait for breakouts. They monitor structure.
Now, you can too.
KEY FEATURES
• Works on any asset class and any timeframe
• Fully customizable domain selection
• Three-tier structural alert system (T1–T3)
• Real-time dashboard: stress scores, states, and coupling levels
• Hysteresis modeling: post-stress “memory” detection
• Supports single-domain (local) or multi-domain (systemic) monitoring
• PineScript alerts built-in
RECOMMENDED USE
Active traders - all asset classes
Use the dashboard and T1–T3 alerts to stay aware of structural risk in real time.
Track multi-timeframe alignment to detect where risk originates and how it spreads across markets.
Crypto trader s
Monitor upstream domains (Equities, FX, Rates, Macro) to detect pressure before it reaches crypto.
Identify reflexive stress before Bitcoin reacts — and stay ahead of contagion events.
Macro & systematic traders
Use T1–T3 transitions as volatility filters, exposure governors, or dynamic risk overlays.
Build regime-aware models that adapt to shifting systemic conditions.
Examples & Visuals
Question: Would it have helped to know that at 9:30 on October 9th and again at 10:00 on October 10th that critical states were detected in the structural behavior of Bitcoin? Take a look:
30 min chart BTC shows two distinct T3 (critical) regime detections October 9th and 10:30 October 10th
5m BTC chart reveals high frequency instability for the same period, identifying instability, fragility, criticality
The 30minute BTC chart at 16:30 Friday October 10th,, a few hours after first detecting critical systemic risk
RISK DISCLAIMER
This is a structural analysis tool, not a predictive signal. It does not provide financial advice, trade entries, or forecasts. Use at your own risk. Full disclaimer embedded in the script.
Complexity Trading - From Wall St to Main St
No patterns. No repainting. No mysticism. Just logic, math, science and market structure - now made accessible to everyone.
Developer of LPPL Critical Pulse (LPPLCP), the Temporal Phase Model (TPM) and other
other advanced structural and attractor based systems inspired by Sornette’s LPPL framework and other differentiated thinkers.
Note on Methodology
This tool is not predictive, and not designed for academic publication.
It is a real-time structural monitoring system inspired by academically established concepts,
including LPPL attractor dynamics, cross-asset coupling, reflexivity, and phase regime transitions, implemented within the real-time constraints of PineScript, and intended for visual, exploratory, and diagnostic use.

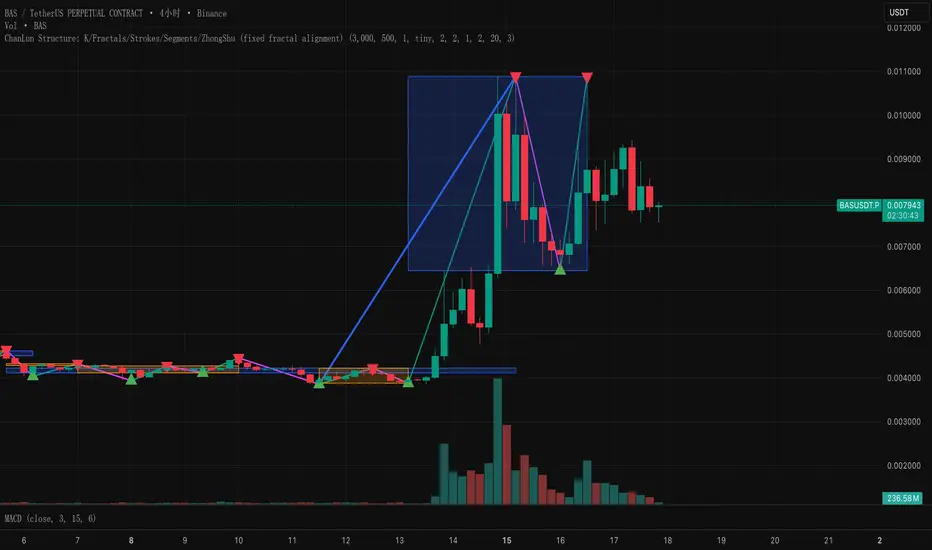
ChanLun Structure: K/Fractals/Strokes/Segments/ZhongShuThis script implements the "line and center" concept of CHANLUN.
AXUUSD Range < $3 HighlighterHighlights all candles where the gap between the high and low is less than USD 3

QUANT TRADING ENGINE [PointAlgo]Quant Trading Engine is a quantitative market-analysis indicator that combines multiple statistical factors to study trend behavior, mean reversion, volatility, execution efficiency, and market stability.
The indicator converts raw price behavior into standardized signals to help evaluate directional bias and risk conditions in a systematic way.
This script focuses on factor alignment and regime awareness, not prediction certainty.
Design Philosophy
Markets move through different regimes such as trending, ranging, volatile expansion, and instability.
This indicator attempts to model these regimes by blending:
Momentum strength
Mean-reversion pressure
Volatility risk
Trend filtering
Execution context (VWAP)
Correlation structure
Each component is normalized and combined into a single Quant Alpha framework.
Factor Construction
1. Momentum Factor
Measures directional strength using percentage price change over a rolling window.
Standardized using mean and standard deviation.
Represents trend continuation pressure.
2. Mean Reversion Factor
Measures deviation from a longer moving average.
Standardized to identify stretched conditions.
Designed to capture counter-trend behavior.
Directional Clamping
Mean-reversion signals are dynamically restricted:
No counter-trend buying during downtrends.
No counter-trend selling during uptrends.
Allows both sides only in neutral regimes.
This prevents conflicting signals in strong trends.
3. Volatility Factor
Uses realized volatility derived from price changes.
Penalizes environments where volatility deviates significantly from its norm.
Acts as a risk adjustment rather than a directional driver.
4. Composite Quant Alpha
The final Quant Alpha is a weighted blend of:
Momentum
Mean reversion (trend-clamped)
Volatility risk
The composite is standardized into a Z-score, allowing consistent interpretation across instruments and timeframes.
Signal Logic
Buy signal occurs when Quant Alpha crosses above zero.
Sell signal occurs when Quant Alpha crosses below zero.
Zero-cross logic is used to represent shifts from negative to positive statistical bias and vice versa.
Signals reflect statistical regime change, not trade instructions.
Volatility Smile Context
Measures price deviation from its statistical distribution.
Identifies skewed conditions where upside or downside volatility becomes dominant.
Highlights extreme deviations that may imply elevated derivative risk.
Exotic Risk Conditions
Detects sudden price expansion combined with volatility spikes.
Highlights environments where execution and risk become unstable.
Visual background cues are used for awareness only.
Execution Context (VWAP)
Measures price distance from VWAP.
Used to assess execution efficiency rather than direction.
Helps identify stretched conditions relative to average traded price.
Correlation Structure
Evaluates short-term return correlations.
Detects when price behavior becomes less predictable.
Flags structural instability rather than trend direction.
Visualization
The indicator plots:
Quant Alpha (scaled) with directional coloring
Volatility smile deviation
Price vs VWAP distance
Correlation structure
Signal markers indicate Quant Alpha zero-cross events and risk conditions.
Dashboard
A compact dashboard summarizes:
Trend filter state
Quant Alpha polarity and value
Individual factor readings
Current action state (Buy / Sell / Wait / Risk)
The dashboard provides a real-time snapshot of internal model conditions.
Usage Notes
Designed for analytical interpretation and research.
Best used alongside price action and risk management tools.
Factor behavior depends on instrument liquidity and volatility.
Not optimized for illiquid or irregular markets.
Disclaimer
This script is provided for educational and analytical purposes only.
It does not provide financial, investment, or trading advice.
All outputs should be independently validated before making any trading decisions.

SCOTTGO - RSI Divergence IndicatorRSI Divergence Indicator
This indicator combines the Relative Strength Index (RSI) with an automatic divergence detection system.
It is designed to help traders spot potential trend changes by:
Color-Coded RSI: The main RSI line dynamically changes color (e.g., green/red) above and below a user-defined threshold (default 50) to highlight strong or weak momentum instantly.
Divergence Signals: It automatically identifies and plots four types of RSI divergences (Regular Bullish, Hidden Bullish, Regular Bearish, and Hidden Bearish) between the price and the oscillator.
Custom Alerts: Includes alerts for all divergence types so you can be notified when a new signal is found.
This tool helps visualize momentum shifts and potential reversals in the market.

NCL Noise FilterOne of our Favorite Indicators - the NeoChartLabs Noise Filter.
FILTER OUT THE NOISE and focus on the moves that matter, toggle the settings to match your preference.
Or switch the Duration Setting to Institutional on a high timeframe (1W+) to locate great spot buying opportunities near cycle tops and bottoms.
Volume Filter: The volume filter automatically turns OFF when you switch to Major Macro Cycle or Institutional Baseline, as those high-timeframe structural breaks are often valid even on lower relative volume.
You can change the volume requirement by checking the volume of the current breakout bar against its Relative Volume (RVOL) - A setting of 0 turns this OFF.
A common professional standard is to require the breakout volume to be at least 1.5x to 2x higher than the 20-period average volume.
*we recommend using a higher volume setting on low timeframes under the 4HR to reduce false signals.
MTF Filter:
*we recommend to set at least 1 timeframe above your trade (i.e if you enter on the 2hour set to the 4 hour)
It prevents entering trades that are essentially minor pullbacks in a much larger opposing trend.
By integrating a higher timeframe EMA (e.g., a 200-period EMA from a 4x higher timeframe), you can filter out counter-trend trades that have a higher probability of failing.
ATR Filter:
Filters "Fake-Outs": It forces the price to not just "touch" the trendline, but to break it with enough force to clear the current average volatility.
Adaptive: Unlike a fixed pip/dollar amount, the ATR adjusts to the asset. On Bitcoin, the threshold might be $500; on a penny stock, it might be $0.05.
Bullish Cross: The price must close above the support trendline + (0.5 * ATR).
Bearish Cross: The price must close below the resistance trendline - (0.5 * ATR).
MACD Filter:
Bullish Crosses require the MACD Histogram to be increasing (showing positive momentum acceleration).
Bearish Crosses require the MACD Histogram to be decreasing (showing negative momentum acceleration).
RSI Filter:
Bullish Breakout (Cross of the lower/support trendline): You would want the RSI to be rising or above 50, showing that buyers are in control.
Bearish Breakdown (Cross of the upper/resistance trendline): You would want the RSI to be falling or below 50, showing sellers are in control.
Market Structure Shifts (CHoCH) - identifying Trends with bullish/bearish dashed horizontal lines for each CHoCH providing a cleaner visualization of the support or resistance level that price has just violated.
Duration Table for 1Week Charts
Trading Style Fractal Length (p) Pattern Span Confirmation Delay
Standard Swing 2 5 Weeks 2 Weeks
Intermediate Trend 5 11 Weeks 5 Weeks
Major Macro Cycle 10–20 21–41 Weeks 10–20 Weeks
Institutional Baseline 44 ~2 Years ~10 Months

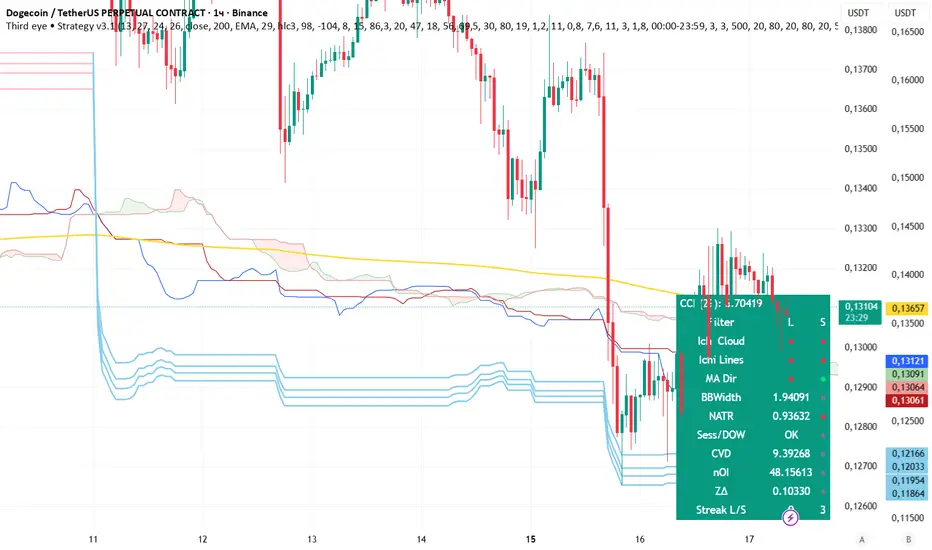
Third eye Strategy v3.1 DogeThird eye • Strategy v3.1 Doge Third eye • Strategy v3.1 Doge Third eye • Strategy v3.1 Doge
Hicham XAUUSD Key Levels PRO (Custom Series) V2🔑 XAUUSD Key Levels PRO | 1H / 4H Structure + Psychological Levels v2
This indicator is designed specifically for Gold (XAUUSD) traders who want clean, institutional-grade key levels without chart clutter.
It combines market structure levels with true psychological price levels used by institutions, making it ideal for scalping, intraday, and swing trading.
📌 Features
🔹 Market Structure Key Levels
Automatic 1H & 4H High / Low detection
Based on swing pivots (configurable strength)
Solid lines for clear structure visibility
🔹 Gold Psychological Levels (XAUUSD)
Major levels: every 500$ (strong institutional zones)
Medium levels: every 250$
Minor levels: every 10$
Dynamic levels around current price
No line spam, optimized performance
🔹 Visual Clarity
Solid / dashed / dotted line styles
Custom colors & line thickness
Optional price labels
Works perfectly on M1 → H4
🎯 Best Use Cases
Liquidity sweeps & reactions
Premium / discount zones
Stop-loss & take-profit placement
Confluence with BOS / CHoCH
London & New York sessions
⚙️ Fully Customizable
Toggle 1H / 4H levels
Adjust psychological level spacing
Enable / disable labels
Clean & lightweight (no lag)
⚠️ Notes
Optimized for XAUUSD (Gold)
Best results when combined with price action & structure
Not a trading signal indicator
If you want:
Session-based levels
Alerts on key levels
Smart Money Concepts integration
Feel free to comment or DM 👊
Happy trading 💛📈
Open-source script
In true TradingView spirit, the creator of this script has made it open-source, so that traders can review and verify its functionality. Kudos to the author! While you can use it for free, remember that republishing the code is subject to our House Rules.
hichamfata
Disclaimer
The information and publications are not meant to be, and do not constitute, financial, investment, trading, or other types of advice or recommendations supplied or endorsed by TradingView. Read more in the Terms of Use.
